Hospitalizations for Patients Aged 85 and Over in the United States, 2000–2010
- Key findings
- What percentage of hospital care was provided to adults aged 85 and over?
- Were adults aged 85 and over more likely than other age groups to be hospitalized?
- What were common causes of hospitalization for adults aged 85 and over?
- How likely were adults aged 85 and over to be hospitalized for injury?
- Summary
- Definitions
- Data source and methods
- About the authors
- References
- Suggested citation
NCHS Data Brief No. 182, January 2015
PDF Versionpdf icon (588 KB)
Shaleah Levant, M.P.H.; Karishma Chari, M.P.H.; and Carol J. DeFrances, Ph.D.
Key findings
Data from the National Hospital Discharge Survey
- In 2010, adults aged 85 and over accounted for only 2% of the U.S. population but 9% of hospital discharges.
- From 2000 through 2010, the rate of hospitalizations for adults aged 85 and over declined from 605 to 553 hospitalizations per 1,000 population, a 9% decrease.
- The rate of fractures and other injuries was higher for adults aged 85 and over (51 per 1,000 population) than for adults aged 65–74 (9 per 1,000 population) and 75–84 (23 per 1,000 population).
- Adults aged 85 and over were less likely than those aged 65–74 and 75–84 to be discharged home and more likely to die in the hospital.
From 2000 through 2010, the number of adults aged 85 and over in the United States rose 31%, from 4.2 million to 5.5 million, and in 2010, this age group represented almost 14% of the population aged 65 and over (1). It is estimated that by 2050, more than 21% of adults over age 65 will be aged 85 and over (2). Given this increase, adults aged 85 and over are likely to account for an increasing share of hospital utilization and costs in the coming years (3). This report describes hospitalizations for adults aged 85 and over with comparisons to adults aged 65–74 and 75–84.
Keywords: inpatient care, health care utilization, National Hospital Discharge Survey
What percentage of hospital care was provided to adults aged 85 and over?
- In 2000, adults aged 85 and over accounted for only 2% of the U.S. population but 8% of hospital discharges. In 2010, adults aged 85 and over still accounted for 2% of the U.S. population but accounted for 9% of hospital discharges (Figure 1).
Figure 1. Population, discharges, and days of care, by age: United States, 2000 and 2010
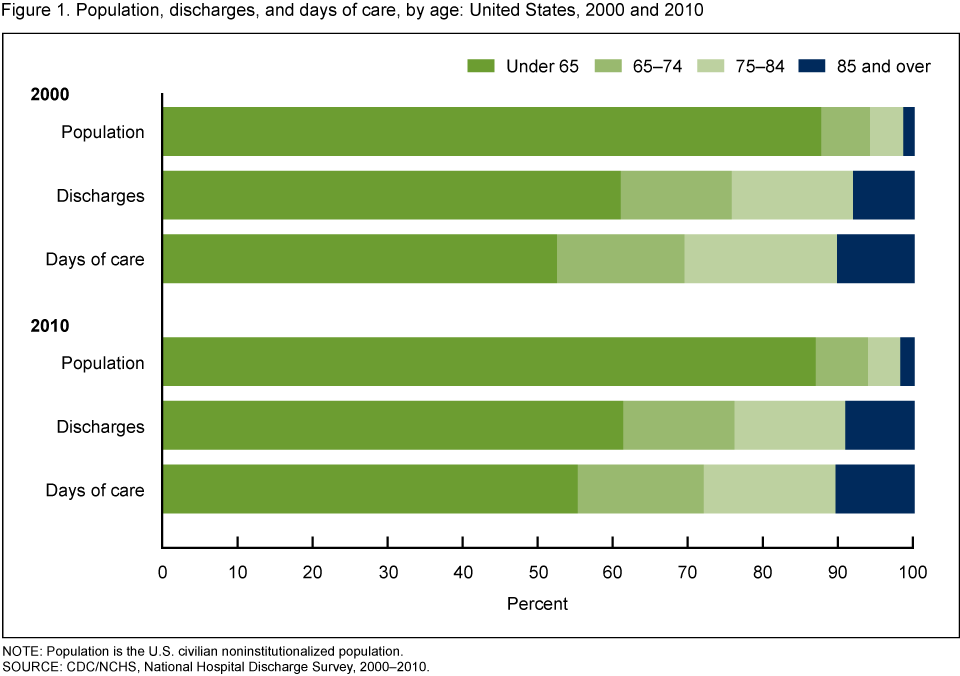
NOTE: Population is the U.S. civilian noninstitutionalized population.
SOURCE: CDC/NCHS, National Hospital Discharge Survey, 2000–2010.
- In 2000 and 2010, adults aged 85 and over accounted for 12% and 14%, respectively, of those aged 65 and over. However, adults aged 85 and over accounted for more than 20% of hospital discharges for those aged 65 and over for both years.
- Adults aged 85 and over accounted for a disproportionate share of the total days of care, 10% in 2000 and 11% in 2010.
Were adults aged 85 and over more likely than other age groups to be hospitalized?
- The hospitalization rate for adults aged 85 and over declined by 9% from 2000 through 2010, from 605 to 553 per 1,000 population, respectively (Figure 2).
Figure 2. Hospitalizations, by age: United States, 2000–2010
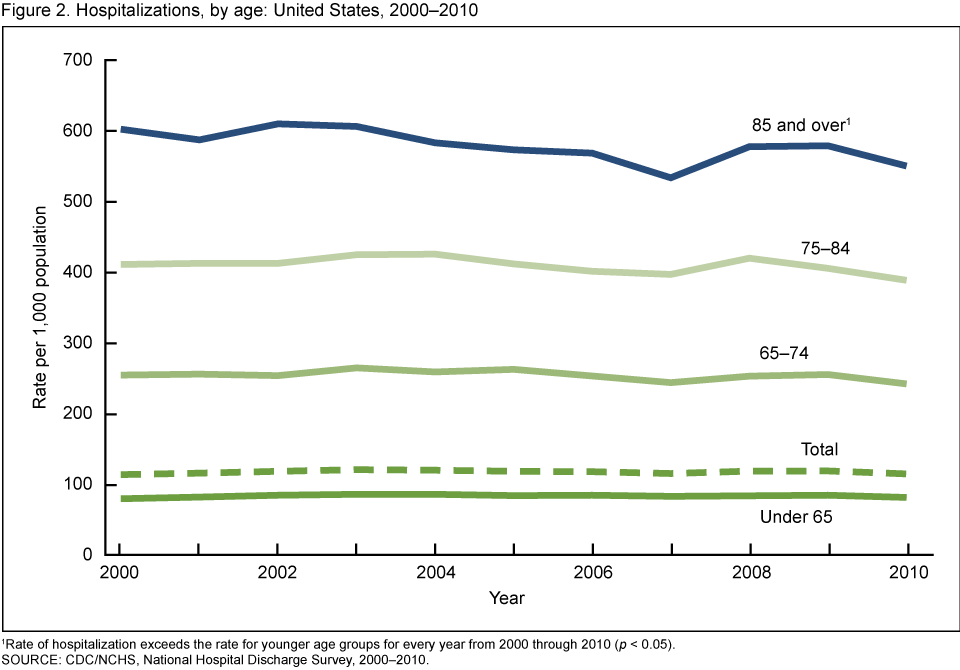
1Rate of hospitalization exceeds the rate for younger age groups for every year from 2000 through 2010 (p < 0.05).
SOURCE: CDC/NCHS, National Hospital Discharge Survey, 2000–2010.
- From 2000 through 2010, the hospitalization rate for adults aged 85 and over remained significantly higher than the rates for adults under age 65, aged 65–74, and aged 75–84.
- In 2010, the hospitalization rate for adults aged 85 and over (553 per 1,000 population) was more than five times higher than the rate for adults under 65 (80 per 1,000 population).
What were common causes of hospitalization for adults aged 85 and over?
- In 2010, congestive heart failure (43 per 1,000 population) was the most frequent first-listed diagnosis for adults aged 85 and over, but in 2000 and 2005, pneumonia (51 and 52 per 1,000 population, respectively) was the most common first-listed diagnosis for adults aged 85 and over (Table).
- Hospitalization rates for congestive heart failure, pneumonia, stroke, and hip fracture decreased from 2000 through 2010 for adults aged 85 and over, and the rates for urinary tract infections and septicemia increased from 2000 through 2010.
| First-listed diagnosis | 2000 | 2005 | 2010 | Percent change1 (2000 to 2010) |
|---|---|---|---|---|
| Rate of hospitalization per 1,000 population | ||||
| Congestive heart failure | 48 | 47 | 43 | –9.5 |
| Pneumonia | 51 | 52 | 34 | –32.8 |
| Urinary tract infection | 19 | 24 | 30 | +55.9 |
| Septicemia | 15 | 18 | 28 | +84.8 |
| Stroke | 37 | 27 | 28 | –25.0 |
| Hip fracture | 28 | 23 | 21 | –25.4 |
1Percent change for each diagnosis is significant from 2000 through 2010 (p < 0.05).
NOTE: First-listed diagnosis is considered to be the main cause or reason for the hospitalization. The diagnoses were chosen because they were the top six first-listed diagnoses in 2010.
SOURCE: CDC/NCHS, National Hospital Discharge Survey, 2000–2010.
How likely were adults aged 85 and over to be hospitalized for injury?
- The rate of all injuries for adults aged 85 and over (51 per 1,000 population) was higher than the rates for adults aged 65–74 and 75–84 (9 and 23 per 1,000 population, respectively) (Figure 3).
- The rate of hip fractures for adults aged 85 and over (21 per 1,000 population) was higher than the rates for adults aged 65–74 and 75–84 (2 and 8 per 1,000 population, respectively).
- The rate of other fractures for adults aged 85 and over (18 per 1,000 population) was higher than the rates for adults aged 65–74 and 75–84 (4 and 10 per 1,000 population, respectively).
- The rate of other injuries for adults aged 85 and over (12 per 1,000 population) was higher than the rates for adults aged 65–74 and 75–84 (3 and 6 per 1,000 population, respectively).
Figure 3. Injury hospitalizations, by age and selected diagnoses: United States, 2010
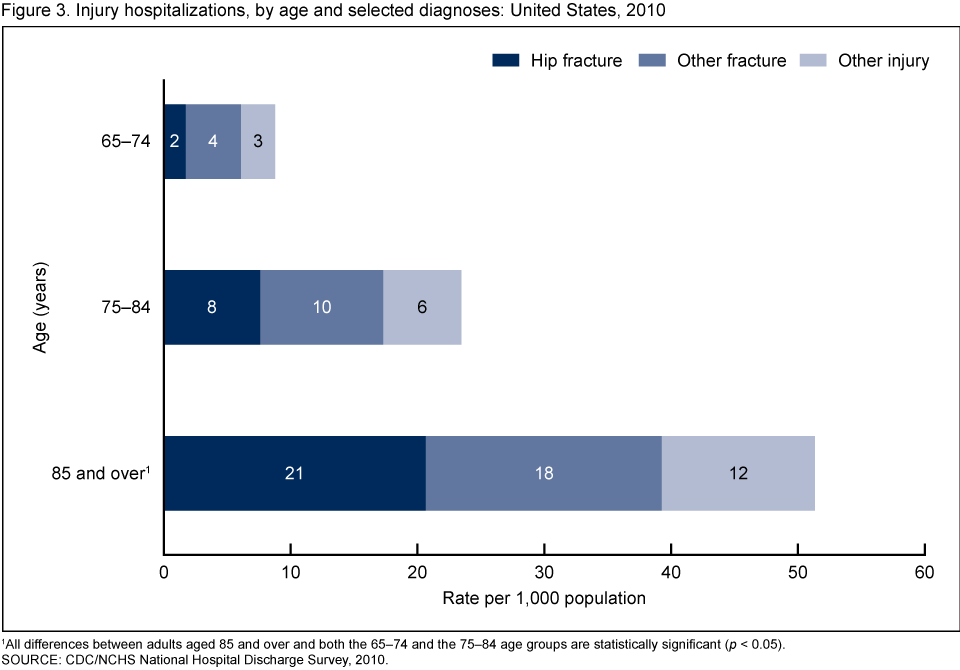
1All differences between adults aged 85 and over and both the 65–74 and the 75–84 age groups are statistically significant (p < 0.05).
SOURCE: CDC/NCHS National Hospital Discharge Survey, 2010.
Where were adults aged 85 and over discharged to after hospitalization?
- Adults aged 85 and over were less likely to be discharged to their homes (44%) than adults aged 65–74 and 75–84 (71% and 58%, respectively), and they were more likely to be discharged to a long-term care facility (36% compared with 14% and 24%, respectively) (Figure 4).
- Adults aged 85 and over were more likely to die during hospitalization than those aged 65–74 and 75–84 (6% compared with 3% and 4%, respectively).
Figure 4. Discharge status, by age group: United States, 2010
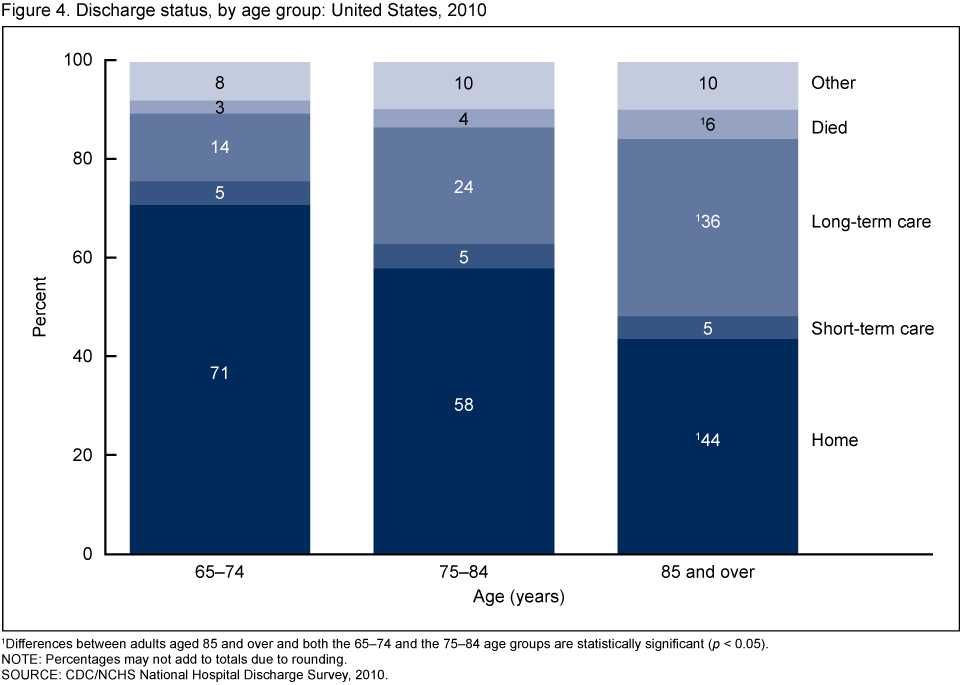
1Differences between adults aged 85 and over and both the 65–74 and the 75–84 age groups are statistically significant (p < 0.05).
NOTE: Percentages may not add to totals due to rounding.
SOURCE: CDC/NCHS National Hospital Discharge Survey, 2010.
Summary
This analysis examined hospitalizations for adults aged 85 and over from 2000 through 2010 and compared these adults with adults aged 65–74 and 75–84. In 2010, adults aged 85 and over accounted for 2% of the total U.S. population. However, they accounted for a disproportionate share of hospital discharges and days of care—9% and 11%, respectively. The hospitalization rate for adults aged 85 and over decreased between 2000 and 2010, but it remained significantly higher than all other age groups.
The life expectancy of people who reach age 85 is another 6.5 years; those who reach age 90 can expect to live another 4.6 years (4). As the number of adults aged 85 and over in the United States continues to rise, the recognition of age differences in the utilization and provision of inpatient services among this population will be important. Prevention efforts to keep adults aged 85 and over out of inpatient settings will help reduce health care costs and maintain quality of life. For example, falling causes more than 95% of hip fractures, one of the leading causes of hospital admission, and can ultimately result in nursing home admission, long-term functional impairment, and increased mortality (5).
Definitions
First-listed diagnosis: The principal diagnosis, considered to be the main cause or reason for the hospitalization. Diagnoses are coded according to the International Classification of Diseases, Ninth Revision, Clinical Modification (ICD–9–CM) coding system (6). The ICD–9–CM codes for the first-listed diagnoses included in this report are the following:
Congestive heart failure—codes 428.0 and 428.2–428.4
Pneumonia—codes 480–486
Stroke—codes 430–438
Urinary tract infection—code 599.0
Hip fracture—code 820
Other fracture—codes 800–819 and 821–829
Other injury—codes 830–959
Rate: The number of hospitalizations per unit of population (e.g., per 10,000 population). Using rates removes the influence of different population sizes (e.g., for adults aged 75–84 and 85 and over in the same year or for the same age group over multiple years) so that data can be compared across these groups. For 2000–2010, rates were calculated using U.S. Census Bureau 2000-based postcensal civilian population estimates.
Data source and methods
Data for this report are from the National Hospital Discharge Survey (NHDS), a national probability sample survey of discharges from nonfederal, short-stay hospitals or general hospitals in the United States. The survey was conducted annually until 2010 by the Centers for Disease Control and Prevention’s (CDC) National Center for Health Statistics, Division of Health Care Statistics. NHDS uses a modified three-stage design. Units selected at the first stage consist of either hospitals or geographic areas, such as counties, groups of counties, or metropolitan statistical areas. Within a sampled geographic area, hospitals are selected. Finally at the last stage, systematic random sampling is used to select discharges within sampled hospitals. Survey data on hospital discharges were obtained from the hospitals’ administrative data. Note that if an individual is admitted to the hospital multiple times during the survey year, that individual could be counted more than once in NHDS.
Because of the complex multistage design of NHDS, the survey data must be inflated or weighted to produce national estimates. Estimates of inpatient care presented in this report exclude newborns. More details about the design of NHDS have been published elsewhere (7).
A weighted least-squares regression method (8), based on all 11 years of NHDS data from 2000 through 2010, was used to test for linear trends in the table and all figures. This is the case even if only selected years of data are shown. A p value of less 0.05 indicated statistical significance. Differences among subgroups were evaluated with two-tailed t tests using p < 0.05 as the level of significance. Terms that express differences such as “higher,” “lower,” “largest,” “smallest,” “leading,” “increased,” or “decreased,” were used only when the differences were statistically significant. When a comparison is described as “similar,” it means no statistically significant difference was found. All comparisons reported in the text were statistically significant unless otherwise indicated. Data analyses were performed using the statistical packages SAS version 9.3 (SAS Institute, Cary, N.C.) and SUDAAN version 11.0 (RTI International, Research Triangle Park, N.C.).
About the authors
Shaleah Levant, Karishma Chari, and Carol J. DeFrances are with CDC’s National Center for Health Statistics, Division of Health Care Statistics.
References
- Werner CA. The older population: 2010. C2010BR–09. U.S. Census Bureau: Washington, DC. 2011.
- Vincent GK, Velkoff VA. The next four decades. The older population in the United States: 2010 to 2050. Current population reports P25–1138. U.S. Census Bureau: Washington, DC. 2010.
- Federal Interagency Forum on Aging-Related Statistics. Older Americans 2012: Key indicators of well-being. Federal Interagency Forum on Aging-Related Statistics. Washington, DC: U.S. Government Printing Office. 2012.
- Murphy SL, Xu JQ, Kochanek KD. Deaths: Preliminary data for 2010 pdf icon[PDF – 1.84KB]. National vital statistics reports; vol 60 no 4. Hyattsville, MD: National Center for Health Statistics. 2012.
- National Center for Injury Prevention and Control. Home and recreational safety: Hip fractures among older adults. 2013.
- CDC. International classification of diseases, ninth revision, clinical modification. 6th ed. 2006.
- Hall MJ, DeFrances CJ, Williams SN, et al. National Hospital Discharge Survey: 2007 summary pdf icon[PDF – 403KB]. National health statistics reports; no 29. Hyattsville, MD: National Center for Health Statistics. 2010.
- Gillum BS, Graves EJ, Kozak LJ. Trends in hospital utilization: United States, 1988–92 pdf icon[PDF – 578KB]. National Center for Health Statistics. Vital Health Stat 13(124). 1996.
Suggested citation
Levant S, Chari K, DeFrances CJ. Hospitalizations for patients aged 85 and over in the United States, 2000–2010. NCHS data brief, no 182. Hyattsville, MD: National Center for Health Statistics. 2015.
Copyright information
All material appearing in this report is in the public domain and may be reproduced or copied without permission; citation as to source, however, is appreciated.
National Center for Health Statistics
Charles J. Rothwell, M.S., M.B.A., Director
Jennifer H. Madans, Ph.D., Associate Director for Science
Division of Health Care Statistics
Clarice Brown., M.S., Director