Mortality in the United States, 2013
NCHS Data Brief No. 178, December 2014
PDF Versionpdf icon (416 KB)
Kenneth D. Kochanek, M.A.; Sherry L. Murphy, B.S.; Jiaquan Xu, M.D.; Elizabeth Arias, Ph.D.
Key findings
Data from the National Vital Statistics System, Mortality
- Life expectancy for the U.S. population in 2013 was unchanged from 2012 at 78.8 years.
- The age-adjusted death rate of 731.9 per 100,000 standard population did not change significantly from 2012.
- The 10 leading causes in 2013 remained the same as in 2012, although unintentional injuries became the fourth leading cause, while stroke became the fifth. Age-adjusted death rates significantly decreased for 4 leading causes and increased for 2.
- The infant mortality rate in 2013 of 596.1 infant deaths per 100,000 live births did not change significantly from the rate in 2012. The 10 leading causes of infant death in 2013 remained the same as in 2012, although maternal complications became the third leading cause, while Sudden infant death syndrome became the fourth.
This report presents 2013 U.S. final mortality data on deaths and death rates by demographic and medical characteristics. These data provide information on mortality patterns among U.S. residents by such variables as sex, race and ethnicity, and cause of death. Information on mortality patterns is key to understanding changes in the health and well-being of the U.S. population (1). Life expectancy estimates, age-adjusted death rates by race and ethnicity and sex, 10 leading causes of death, and 10 leading causes of infant death were analyzed by comparing 2013 final data with 2012 final data. In 2013, a total of 2,596,993 resident deaths were registered in the United States.
Keywords: vital statistics, life expectancy, leading cause, death rates
How long can we expect to live?
Life expectancy at birth represents the average number of years that a group of infants would live if the group was to experience throughout life the age-specific death rates present for the year of birth. U.S. life expectancy at birth for the total population was 78.8 years in 2013—the same as in 2012 (Figure 1). In 2013, life expectancy was 81.2 years for females and 76.4 for males. Life expectancy for females was consistently higher than that for males. In 2013, the difference in life expectancy between females and males was 4.8 years, the same as in 2012.
Life expectancy at age 65 for the total population was 19.3 years, the same as in 2012. Life expectancy for females at age 65 was 20.5 years and for males, 17.9 years. The difference in life expectancy at age 65 between females and males was 2.6 years in 2013, the same as in 2012.
Figure 1. Life expectancy at selected ages, by sex: United States, 2013
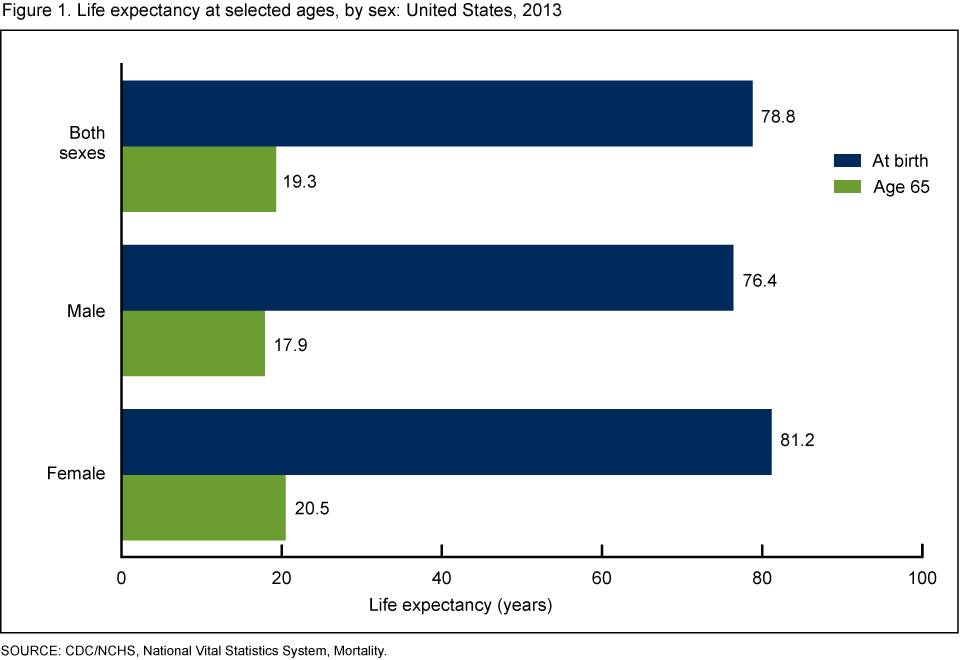
SOURCE: CDC/NCHS, National Vital Statistics System, Mortality.
Which population groups experienced reductions in mortality?
The age-adjusted death rate for the total population in 2013 of 731.9 per 100,000 standard population did not change significantly from the rate of 732.8 in 2012. From 2012 to 2013, age-adjusted death rates in the United States did not change significantly for either males or females among the non-Hispanic white, non-Hispanic black, and Hispanic populations (Figure 2).
Figure 2. Age-adjusted death rates for selected populations: United States, 2012 and 2013
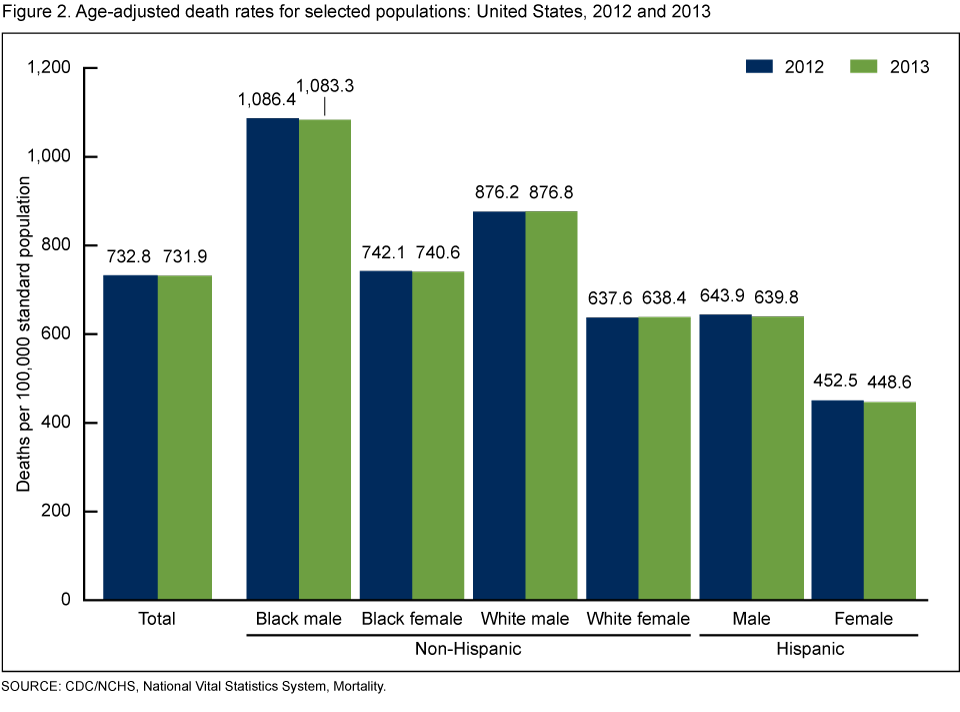
SOURCE: CDC/NCHS, National Vital Statistics System, Mortality.
What are the leading causes of death?
In 2013, the 10 leading causes of death (heart disease, cancer, chronic lower respiratory diseases, unintentional injuries, stroke, Alzheimer’s disease, diabetes, influenza and pneumonia, kidney disease, and suicide) remained the same as in 2012, although two causes exchanged ranks. Unintentional injuries, the fifth leading cause in 2012, became the fourth leading cause in 2013, while stroke, the fourth leading cause in 2012, became the fifth leading cause in 2013 (1). The 10 leading causes accounted for 73.6% of all deaths in the United States in 2013 (Figure 3).
From 2012 to 2013, age-adjusted death rates decreased significantly for 4 of 10 leading causes of death. The rate decreased 0.4% for heart disease, 2.0% for cancer, 1.9% for stroke, and 1.3% for Alzheimer’s disease. The rate increased significantly by 1.4% for chronic lower respiratory diseases and by 10.4% for influenza and pneumonia. The rates for unintentional injuries and kidney disease did not change significantly, and the rates for diabetes and suicide remained the same.
Figure 3. Age-adjusted death rates for the 10 leading causes of death: United States, 2012 and 2013
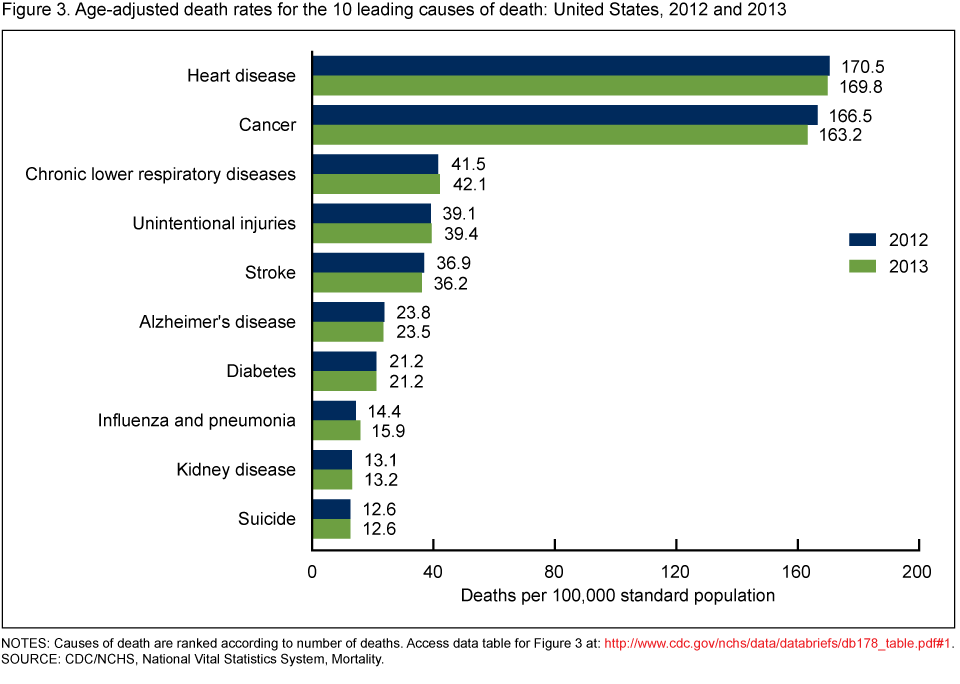
NOTES: Causes of death are ranked according to number of deaths.
Access data table for Figure 3pdf icon.
SOURCE: CDC/NCHS, National Vital Statistics System, Mortality.
What are the leading causes of infant death?
The infant mortality rate (IMR)—the ratio of infant deaths to live births in a given year—is generally regarded as a good indicator of the overall health of a population. In 2013, a total of 23,440 deaths occurred in children under age 1 year, which was 189 fewer infant deaths than in 2012. The IMR declined 0.3%, to 596.1 infant deaths per 100,000 live births in 2013 from 597.8 in 2012, but the difference was not significant.
The 10 leading causes of infant death in 2013 accounted for 69.0% of all infant deaths in the United States. The leading causes remained the same as in 2012, although two causes exchanged ranks (Figure 4). Maternal complications, the fourth leading cause in 2012, became the third leading cause in 2013, while Sudden infant death syndrome (SIDS), the third leading cause in 2012, became the fourth leading cause in 2013. Mortality rates for the 10 leading causes of infant death did not change significantly.
Figure 4. Infant mortality rates for the 10 leading causes of infant death: United States, 2012 and 2013
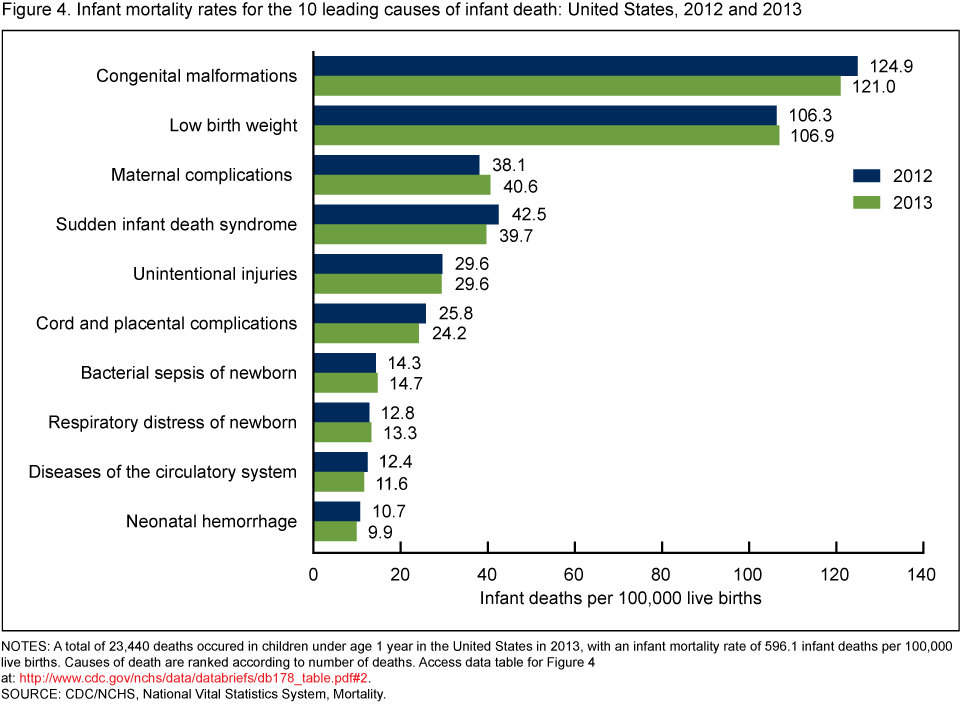
NOTES: A total of 23,440 deaths occurred in children under age 1 year in the United States in 2013, with an infant mortality rate of 596.1 infant deaths per 100,000 live births. Causes of death are ranked according to number of deaths.
Access data table for Figure 4pdf icon
SOURCE: CDC/NCHS, National Vital Statistics System, Mortality.
Summary
From 2012 to 2013, overall mortality for the total population did not change significantly, and life expectancy at birth remained unchanged at 78.8 years. Decreases in mortality in 2013 from 2012 for heart disease, cancer, stroke, and Alzheimer’s disease were offset by a large increase in mortality from influenza and pneumonia and a lower, but significant, increase in chronic lower respiratory diseases. Decreases in mortality from heart disease and cancer, the top two leading causes of death, are consistent with continued long-term trends. These two causes accounted for nearly one-half of all deaths in 2013. The age-adjusted death rate in the United States decreased 15.8%, from 869.0 to 731.9 deaths per 100,000 standard population, from 2000 to 2013. Although changes in mortality overall were not statistically significant from 2012 to 2013, long-term trends show apparent progress in reducing mortality (1).
The leading causes of death in 2013 remained the same as in 2012, although two causes exchanged ranks. Stroke, the fourth leading cause of death in 2012, dropped to the fifth leading cause in 2013. Unintentional injuries, the fifth leading cause in 2012, became the fourth leading cause in 2013, although the age-adjusted death rate for this cause did not change significantly from 2012 to 2013.
Changes also occurred in the leading causes of infant death. SIDS dropped from the third leading cause of infant death in 2012 to the fourth leading cause in 2013, while maternal complications rose from the fourth leading cause in 2012 to the third leading cause in 2013.
Definitions
Cause-of-death classification: Based on medical information—including injury diagnoses and external causes of injury—that is entered on death certificates filed in the United States. This information is classified and coded in accordance with the International Statistical Classification of Diseases and Related Health Problems, Tenth Revision (ICD–10) (2).
Death rates: For 2013, based on population estimates for July 1, 2013, that are consistent with the April 1, 2010, census. These population estimates (as well as population figures for the 2010 census) are available on the Centers for Disease Control and Prevention’s (CDC) National Center for Health Statistics (NCHS) website (3). Age-adjusted death rates are useful when comparing different populations because they remove the potential bias that can occur when the populations being compared have different age structures. NCHS uses the direct method of standardization; see Technical Notes in “Deaths: Final Data for 2010” (4) for more discussion.
Life expectancy: The expected average number of years of life remaining at a given age. It is denoted by ex, which means the average number of subsequent years of life for someone now aged x. Life expectancy estimates for 2013 are based on a methodology first implemented with 2008 final mortality data (5).
Leading causes of death: Ranked according to the number of deaths assigned to rankable causes (6).
Infant mortality rate (IMR): Computed by dividing the number of infant deaths in a calendar year by the number of live births registered for that same time period. IMR is the most widely used index for measuring the risk of dying during the first year of life.
Data source and methods
The data shown in this report reflect information collected by NCHS for 2012 and 2013 from death certificates filed in 50 states and the District of Columbia that are compiled into national data known as the National Vital Statistics System. Death rates shown in this report are calculated based on postcensal population estimates as of July 1, 2012 and 2013, that are consistent with the April 1, 2010, census.
About the authors
Kenneth D. Kochanek, Sherry L. Murphy, Jiaquan Xu, and Elizabeth Arias are with CDC’s National Center for Health Statistics, Division of Vital Statistics.
References
- Murphy SL, Kochanek KD, Xu JQ, et al. Deaths: Final data for 2012. National vital statistics reports; vol 63 no 9. Hyattsville, MD: National Center for Health Statistics. [Forthcoming.]
- World Health Organization. International statistical classification of diseases and related health problems, tenth revision (ICD–10). 2008 ed. Geneva, Switzerland. 2009.
- National Center for Health Statistics, National Vital Statistics System. U.S. census populations with bridged race categories.
- Murphy SL, Xu JQ, Kochanek KD. Deaths: Final data for 2010pdf icon. National vital statistics reports; vol 61 no 4. Hyattsville, MD: National Center for Health Statistics. 2013.
- Arias E. United States life tables, 2008pdf icon. National vital statistics reports; vol 61 no 3. Hyattsville, MD: National Center for Health Statistics. 2012.
- Heron M. Deaths: Leading causes for 2010pdf icon. National vital statistics reports; vol 62 no 6. Hyattsville, MD: National Center for Health Statistics. 2013.
Suggested citation
Kochanek KD, Murphy SL, Xu JQ, Arias E. Mortality in the United States, 2013. NCHS data brief, no 178. Hyattsville, MD: National Center for Health Statistics. 2014.
Copyright information
All material appearing in this report is in the public domain and may be reproduced or copied without permission; citation as to source, however, is appreciated.
National Center for Health Statistics
Charles J. Rothwell, M.S., M.B.A., Director
Jennifer H. Madans, Ph.D., Associate Director for Science
Division of Vital Statistics
Delton Atkinson, M.P.H., M.P.H., P.M.P., Director