Nut Consumption Among U.S. Adults, 2009–2010
- Key findings
- Were there differences by age in the percentage of U.S. adults aged 20 and over who consumed nuts on a given day in 2009–2010?
- Were there differences by race and Hispanic origin in the percentage of U.S. adults aged 20 and over who consumed nuts on a given day in 2009–2010?
- What percentage of U.S. adults aged 20 and over consumed more than 1.5 ounces of nuts on a given day in 2009–2010?
- What was the source of the nuts consumed in 2009–2010?
- Summary
- Definitions
- Data source and methods
- About the authors
- References
- Suggested citation
NCHS Data Brief No. 176, December 2014
PDF Versionpdf icon (586 KB)
Samara Joy Nielsen, Ph.D., M.Div.; Brian K. Kit, M.D., M.P.H.; and Cynthia L. Ogden, Ph.D., M.R.P.
Key findings
Data from the National Health and Nutrition Examination Survey, 2009–2010
- Almost 40% (38.2%) of adults consumed nuts on a given day.
- More non-Hispanic white (43.6%) than non-Hispanic black (23.7%) or Hispanic (25.5%) adults consumed nuts.
- Approximately 80% of nuts consumed (84.0% by men and 79.7% by women) were nuts or seeds as single-item foods or nut butters.
The 2010 Dietary Guidelines for Americans encourage the consumption of nutrient-dense foods such as nuts and seeds (1). Nut consumption has been associated with improved nutrient intake and diet quality (2–4) and improved health outcomes, including those related to cardiovascular disease (5–11). This report examines the percentage of U.S. adults who consumed nuts on a given day, using data from one in-person, 24-hour dietary recall interview.
Keyword: National Health and Nutrition Examination Survey
Were there differences by age in the percentage of U.S. adults aged 20 and over who consumed nuts on a given day in 2009–2010?
Approximately 40% (38.2%) of U.S. adults consumed nuts or seeds (referred to collectively here as nuts) on a given day (Figure 1). As age increased, the percentage of adults consuming nuts increased. Among those aged 20–39, 35.0% consumed nuts, while among those aged 60 and over, 42.3% consumed nuts. Similar trends were seen in men and women. Among men aged 20–39, 33.2% consumed nuts, while 40.0% of men aged 60 and over consumed nuts. Among women aged 20–39, 36.8% consumed nuts, while 44.1% of women aged 60 and over consumed nuts.
Figure 1. Adults aged 20 and over who consumed nuts on a given day, by sex and age: United States, 2009–2010
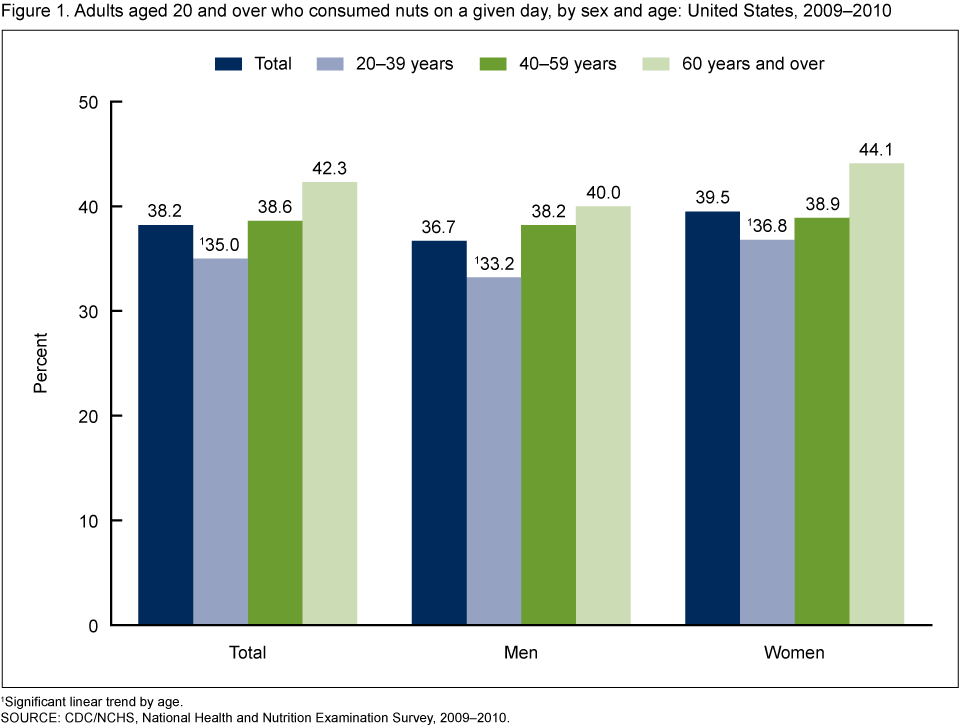
1Significant linear trend by age.
SOURCE: CDC/NCHS, National Health and Nutrition Examination Survey, 2009–2010.
Were there differences by race and Hispanic origin in the percentage of U.S. adults aged 20 and over who consumed nuts on a given day in 2009–2010?
Differences existed by race and Hispanic origin in the percentage of adults who consumed nuts. On a given day in 2009–2010, more non-Hispanic white adults (43.6%) consumed nuts than non-Hispanic black (23.7%) or Hispanic (25.5%) adults (Figure 2). Similar differences were seen among men and women. Among men, 42.4% of non-Hispanic white adults, 21.9% of non-Hispanic black adults, and 22.4% of Hispanic adults consumed nuts. Among women, 44.8% of non-Hispanic white adults, 25.1% of non-Hispanic black adults, and 28.5% of Hispanic adults consumed nuts.
Figure 2. Adults aged 20 and over who consumed nuts on a given day, by sex and race and Hispanic origin: United States, 2009–2010
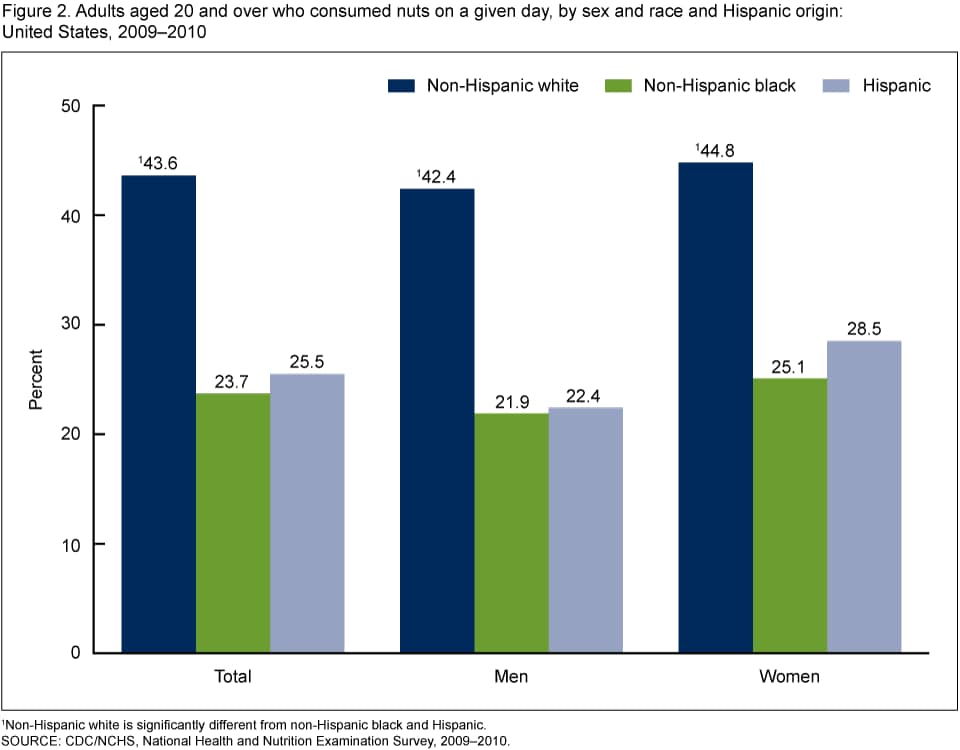
1Non-Hispanic white is significantly different from non-Hispanic black and Hispanic.
SOURCE: CDC/NCHS, National Health and Nutrition Examination Survey, 2009–2010.
What percentage of U.S. adults aged 20 and over consumed more than 1.5 ounces of nuts on a given day in 2009–2010?
One and one-half ounces of nuts is approximately 240 calories and is the daily amount that the U.S. Food and Drug Administration (FDA) suggests may reduce heart disease (12). Although 63.3% of men and 60.5% of women did not consume any nuts on a given day, 14.4% of men and 11.8% of women consumed greater than 1.5 ounces of nuts in 2009–2010 (Figure 3).
Figure 3. Adults aged 20 and over who consumed nuts on a given day, by sex and amount: United States, 2009–2010
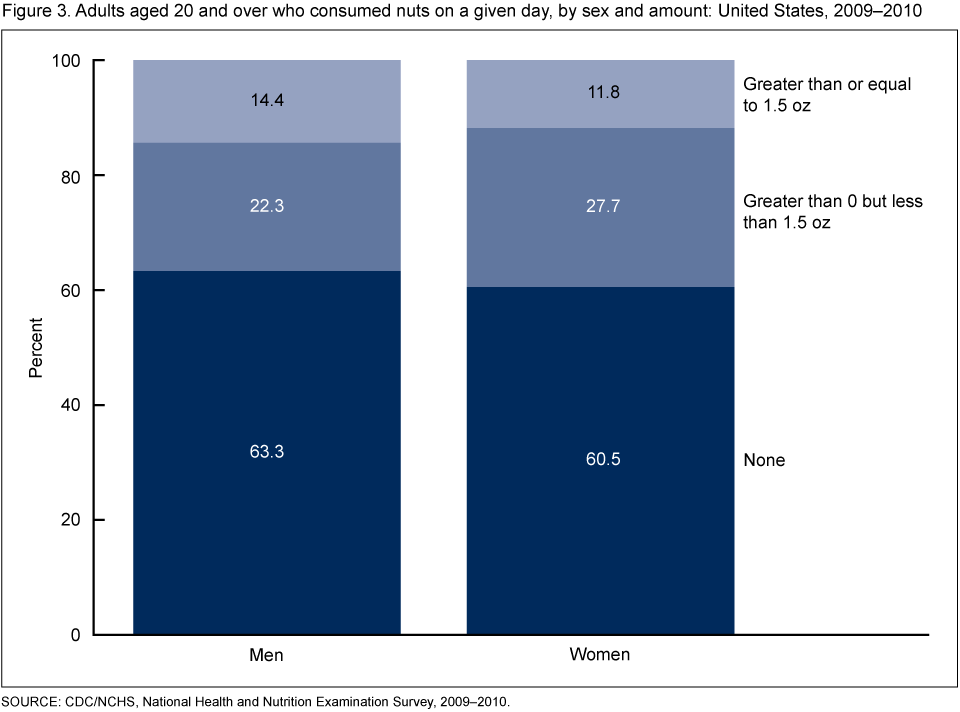
SOURCE: CDC/NCHS, National Health and Nutrition Examination Survey, 2009–2010.
What was the source of the nuts consumed in 2009–2010?
Approximately 80% of the nuts consumed on a given day (84.0% among men and 79.7% among women) were consumed as nuts (nuts as a single-item food, not as an ingredient in candy, breads, cakes, cookies, cereals, or other mixed dishes) or nut butters (Figure 4). Almost 7% (6.7%) of nuts consumed by men and 8.5% of nuts consumed by women were consumed as part of a grain-based dish. Eight percent of nuts consumed by men and 8.5% of nuts consumed by women were consumed as part of a candy food item.
Figure 4. Source of the nuts consumed on a given day, among adults aged 20 and over, by sex: United States, 2009–2010

1Nuts and seeds and nut butters.
2Includes breads, cakes, cookies, and cereals.
3Includes ice cream, cheese, mixed dishes, and nutrition bars.
SOURCE: CDC/NCHS, National Health and Nutrition Examination Survey, 2009–2010.
Summary
Almost 4 in 10 U.S. adults consumed nuts on a given day in 2009–2010. More women than men consumed nuts, and as age increased, the percentage of adults who consumed nuts increased. More non-Hispanic white than non-Hispanic black or Hispanic adults consumed nuts.
Improved nutrient intake and diet quality have been shown to be associated with nut consumption (2–4). Because nuts and seeds are calorie-dense and high in protein, small portions can be eaten as a replacement for other protein foods (1). Nut consumption has also been associated with decreased obesity, cardiovascular disease, metabolic syndrome, and diabetes (5–11). And in 2003, the FDA approved a qualified health claim that “scientific evidence suggests, but does not prove, that eating 1.5 ounces per day of most nuts as part of a diet low in saturated fat and cholesterol may reduce the risk of heart disease.” The results in this report show that about 40% of adults consumed nuts on a given day, while just over 1 in 10 consumed 1.5 ounces or more of nuts on a given day.
Definitions
Nuts and seeds: Refers to almonds, almond butter, almond paste, Brazil nuts, cashews, cashew butter, chestnuts, flax seeds, hazelnuts, macadamia nuts, peanuts, peanut butter, peanut flour, pecans, pine nuts, pistachios, pumpkin seeds, squash seeds, sesame butter (tahini), sesame seeds, sesame paste, sunflower seeds, and walnuts (13).
Nut consumer: Any individual who consumed foods containing nuts, as defined by the United States Department of Agriculture (USDA) Food Patterns Equivalents Database nut and seed food group, during the 24-hour recall.
Data source and methods
National Health and Nutrition Examination Survey (NHANES) data from 2009 through 2010 were used for these analyses. NHANES is conducted by the Centers for Disease Control and Prevention’s (CDC) National Center for Health Statistics to assess the health and nutritional status of the civilian noninstitutionalized U.S. population. The survey combines an in-home interview and a standardized physical examination at a mobile examination center (MEC). For this report, data were collected via an in-person 24-hour dietary recall interview (14) in the MEC. Dietary recalls cover intake during the day (24 hours) prior to the standardized physical examination in the MEC. The USDA Food Patterns Equivalents Database (13) was used to identify which reported foods were nuts (and seeds) or contained nuts (and seeds), and to convert foods to ounce equivalents.
The NHANES sample design includes oversampling to obtain reliable estimates of health and nutritional measures for population subgroups. Data were analyzed using the day 1 dietary sample weights to account for the days of the week, differential probabilities of selection, nonresponse, and noncoverage. The standard errors of the percentages were estimated using Taylor series linearization, a method that incorporates the sample design.
Unadjusted prevalence estimates are presented because the objective of the analysis was to show the percentage of the population that actually consumed nuts. Differences between groups, and tests for linear trends, were evaluated using a t statistic at the p less than 0.05 significance level. All differences reported are statistically significant unless otherwise indicated. Statistical analyses were conducted using SAS version 9.3 (SAS Institute, Cary, N.C.) and SUDAAN version 11.0 (RTI International, Research Triangle Park, N.C.).
About the authors
Samara Joy Nielsen, Brian K. Kit, and Cynthia L. Ogden are with CDC’s National Center for Health Statistics, Division of Health and Nutrition Examination Surveys.
References
- USDA, HHS. Dietary guidelines for Americans, 2010. 7th ed. Washington, DC: U.S. Government Printing Office. 2010.
- O’Neil CE, Keast DR, Fulgoni VL 3rd, Nicklas TA. Tree nut consumption improves nutrient intake and diet quality in US adults: An analysis of National Health and Nutrition Examination Survey (NHANES) 1999–2004. Asia Pac J Clin Nutr 19(1):142–50. 2010.
- O’Neil CE, Keast DR, Nicklas TA, Fulgoni VL 3rd. Out-of-hand nut consumption is associated with improved nutrient intake and health risk markers in US children and adults: National Health and Nutrition Examination Survey 1999–2004. Nutr Res 32(3):185–94. 2012.
- King JC, Blumberg J, Ingwersen L, Jenab M, Tucker KL. Tree nuts and peanuts as components of a healthy diet. J Nutr 138(9):1736S–1740S. 2008.
- Kris-Etherton PM, Hu FB, Ros E, Sabaté J. The role of tree nuts and peanuts in the prevention of coronary heart disease: Multiple potential mechanisms. J Nutr 138(9):1746S–1751S. 2008.
- Mattes RD, Kris-Etherton PM, Foster GD. Impact of peanuts and tree nuts on body weight and healthy weight loss in adults. J Nutr 138(9):1741S–1745S. 2008.
- Zhou D, Yu H, He F, Reilly KH, Zhang J, Li S, et al. Nut consumption in relation to cardiovascular disease risk and type 2 diabetes: A systematic review and meta-analysis of prospective studies. Am J Clin Nutr 100(1):270–7. 2014.
- Bao Y, Han J, Hu FB, Giovannucci EL, Stampfer MJ, Willett WC, Fuchs CS. Association of nut consumption with total and cause-specific mortality. N Engl J Med 369(21):2001–11. 2013.
- Afshin A, Micha R, Khatibzadeh S, Mozaffarian D. Consumption of nuts and legumes and risk of incident ischemic heart disease, stroke, and diabetes: A systematic review and meta-analysis. Am J Clin Nutr 100(1):278–88. 2014.
- Jackson CL, Hu FB. Long-term associations of nut consumption with body weight and obesity. Am J Clin Nutr 100(Suplement 1):408S–411S. 2014.
- Salas-Salvadó J, Guasch-Ferré M, Bulló M, Sabaté J. Nuts in the prevention and treatment of metabolic syndrome. Am J Clin Nutr 100(Supplement 1):399S–407S. 2014.
- FDA. Qualified health claims: Letter of enforcement discretion—Nuts and coronary heart disease (Docket No 02P–0505)external icon. 2003.
- Bowman SA, Clemens JC, Thoerig RC, Friday JE, Shimizu M, Moshfegh AJ. Food patterns equivalents database 2009–10: Methodology and user guide. 2013.
- NCHS. National Health and Nutrition Examination Survey: MEC in-person dietary interviewers procedures manualpdf icon. 2009.
Suggested citation
Nielsen SJ, Kit BK, Ogden CL. Nut consumption among U.S. adults, 2009–2010. NCHS data brief, no 176. Hyattsville, MD: National Center for Health Statistics. 2014.
Copyright information
All material appearing in this report is in the public domain and may be reproduced or copied without permission; citation as to source, however, is appreciated.
National Center for Health Statistics
Charles J. Rothwell, M.S., M.B.A., Director
Jennifer H. Madans, Ph.D., Associate Director for Science
Division of Health and Nutrition Examination Surveys
Kathryn S. Porter, M.D., M.S., Director