Operating Characteristics of Residential Care Communities, by Community Bed Size: United States, 2012
- Key findings
- In 2012, nearly 6 in 10 residential care communities had 4–25 beds, but more than 7 in 10 residents lived in communities with more than 50 beds.
- A higher percentage of communities with 26–50 beds and more than 50 beds were chain-affiliated, in operation for 10 years or more, and had special dementia units or only served dementia patients, compared with communities with 4–25 beds. But a smaller percentage of these communities were for profit.
- Compared with communities with fewer beds, a higher percentage of communities with more than 50 beds screened for cognitive impairment and depression.
- A higher percentage of communities with 26–50 beds and more than 50 beds provided therapeutic, hospice, mental health, and dental services compared with communities with 4–25 beds, but a lower percentage of communities with more than 50 beds provided skilled nursing services than did communities with 4–25 beds.
- Summary
- Definitions
- Data source and methods
- About the authors
- References
- Suggested citation
NCHS Data Brief No. 170, November 2014
PDF Versionpdf icon (588 KB)
Christine Caffrey, Ph.D.; Lauren Harris-Kojetin, Ph.D.;
Vincent Rome, M.P.H.; and Manisha Sengupta, Ph.D.
Key findings
Data from the National Study of Long-Term Care Providers, 2012
- In 2012, nearly 6 in 10 residential care communities had 4–25 beds, but more than 7 in 10 residents lived in communities with more than 50 beds.
- A higher percentage of communities with 26–50 beds and more than 50 beds were chain-affiliated and in operation for 10 years or more compared with communities with 4–25 beds.
- Compared with communities with 4–25 beds and 26–50 beds, a higher percentage of communities with more than 50 beds screened for cognitive impairment or provided dementia-specific programs.
- A higher percentage of communities with 26–50 beds and more than 50 beds provided therapeutic, hospice, mental health, and dental services compared with communities with 4–25 beds.
Residential care, including assisted living, provides long-term supports and services to individuals who cannot live independently but generally do not require the skilled level of care provided by nursing homes. In 2012, there were 22,200 residential care communities nationwide (1). With the aging of the population, residential care will likely continue to be an important part of the long-term care system. Using data from the first wave of the National Study of Long-Term Care Providers (NSLTCP), this report presents the most current national estimates of residential care, and compares selected residential care community characteristics by bed size. State-level estimates for the characteristics presented in this data brief are available from the NSLTCP website.
Keywords: assisted living, long-term care, National Study of Long-Term Care Providers
In 2012, nearly 6 in 10 residential care communities had 4–25 beds, but more than 7 in 10 residents lived in communities with more than 50 beds.
Figure 1. Residential care communities and residents, by community bed size: United States, 2012
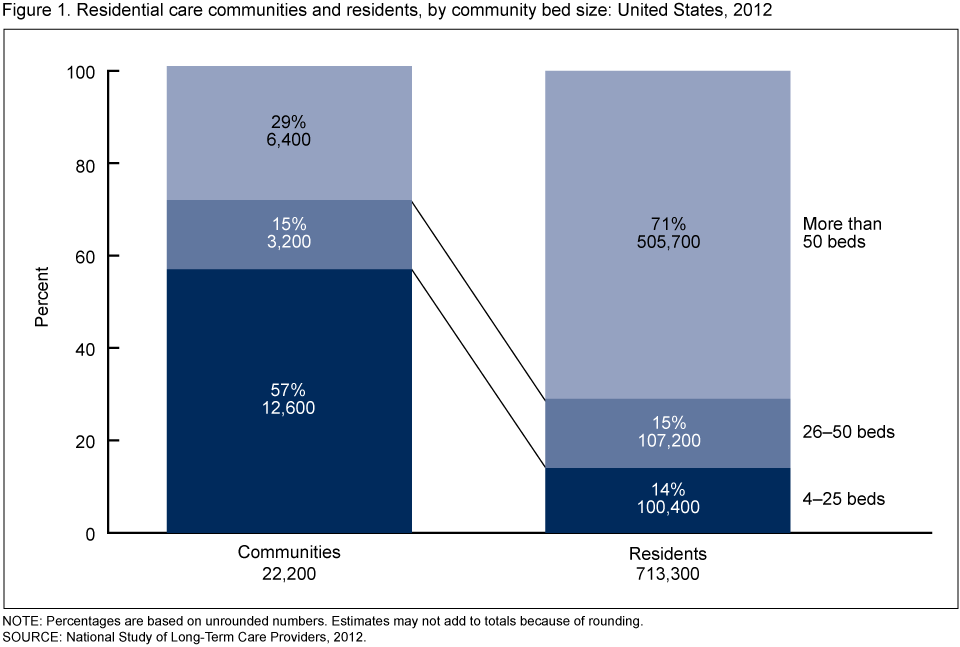
NOTE: Percentages are based on unrounded numbers. Estimates may not add to totals because of rounding.
SOURCE: National Study of Long-Term Care Providers, 2012.
- About 57% of communities had 4–25 beds, but these communities housed only 14% of all residents (Figure 1).
- Communities with more than 50 beds accounted for 29% of all providers but housed 71% of all residents.
- The remaining 15% of communities, those with 26–50 beds, housed 15% of all residents.
A higher percentage of communities with 26–50 beds and more than 50 beds were chain-affiliated, in operation for 10 years or more, and had special dementia units or only served dementia patients, compared with communities with 4–25 beds. But a smaller percentage of these communities were for profit.
- Seventy-five percent of communities with more than 50 beds were chain-affiliated compared with 49% of communities with 4–25 beds (Figure 2).
- As the community size increased, the percentage of communities that were for profit decreased. Eighty-six percent of communities with 4–25 beds were for profit compared with 68% of communities with 26–50 beds and 70% of communities with more than 50 beds.
- Smaller communities tended to be newer than larger communities. More than three-fourths of communities with more than 50 beds (78%) and 26–50 beds (77%) had been in operation for 10 years or more, while 49% of communities with 4–25 beds had been in operation 10 years or more.
- One-half of communities with more than 50 beds exclusively served residents with dementia or had a distinct dementia special care unit or wing, compared with 27% of communities with 26–50 beds and 14% of communities with 4–25 beds.
Figure 2. Selected characteristics among residential care communities, by community bed size: United States, 2012
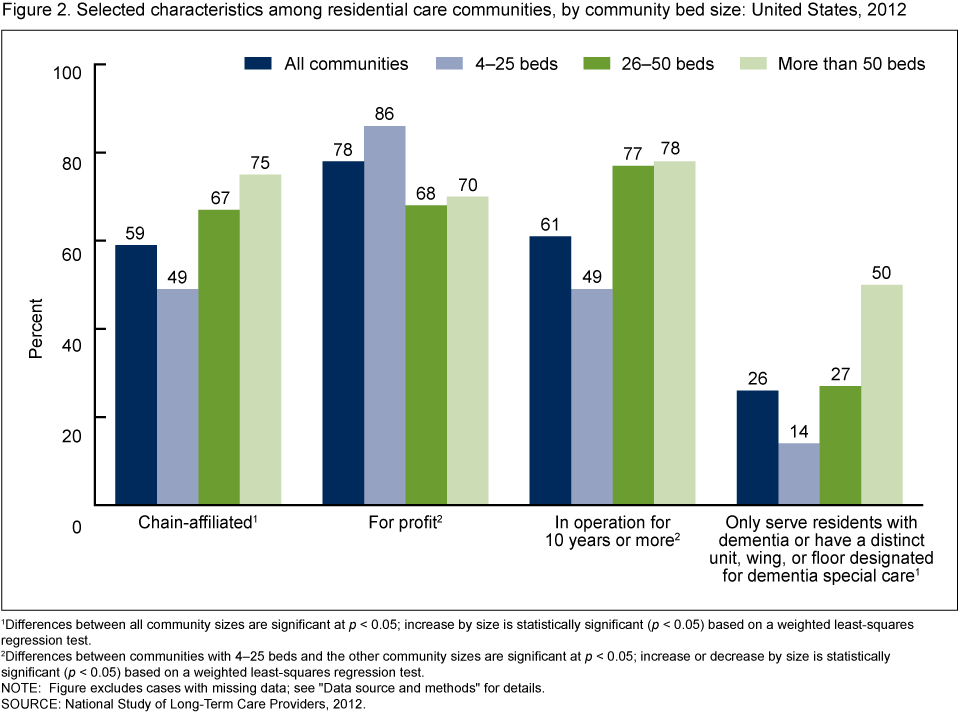
1Differences between all community sizes are significant at p < 0.05; increase by size is statistically significant (p < 0.05) based on a weighted least-squares regression test.
2Differences between communities with 4–25 beds and the other community sizes are significant at p < 0.05; increase or decrease by size is statistically significant (p < 0.05) based on a weighted least-squares regression test.
NOTE: Figure excludes cases with missing data; see “Data source and methods” for details.
SOURCE: National Study of Long-Term Care Providers, 2012.
Compared with communities with fewer beds, a higher percentage of communities with more than 50 beds screened for cognitive impairment and depression.
- Seventy-five percent of communities with more than 50 beds used a standardized tool to conduct a formal assessment of residents before or upon admission to identify anyone with a cognitive impairment. In comparison, 69% of communities with 26–50 beds and 65% of communities with 4–25 beds screened for cognitive impairment (Figure 3).
- Seventy-six percent of communities with more than 50 beds offered disease-specific programs for residents with Alzheimer’s disease and other dementias. In comparsion, 63% of communities with 26–50 beds and 65% of communities with 4–25 beds offered dementia-specific programs.
- A higher percentage of communities with more than 50 beds (22%) screened residents for depression with a standardized tool as part of the admission process compared with smaller communities with 4–25 beds (17%).
- Communities did not differ by size in their prevalence of offering disease-specific programs for residents with depression.
Figure 3. Screening and disease-specific programs for Alzheimer’s disease or other dementias and depression among residential care communities, by community bed size: United States, 2012
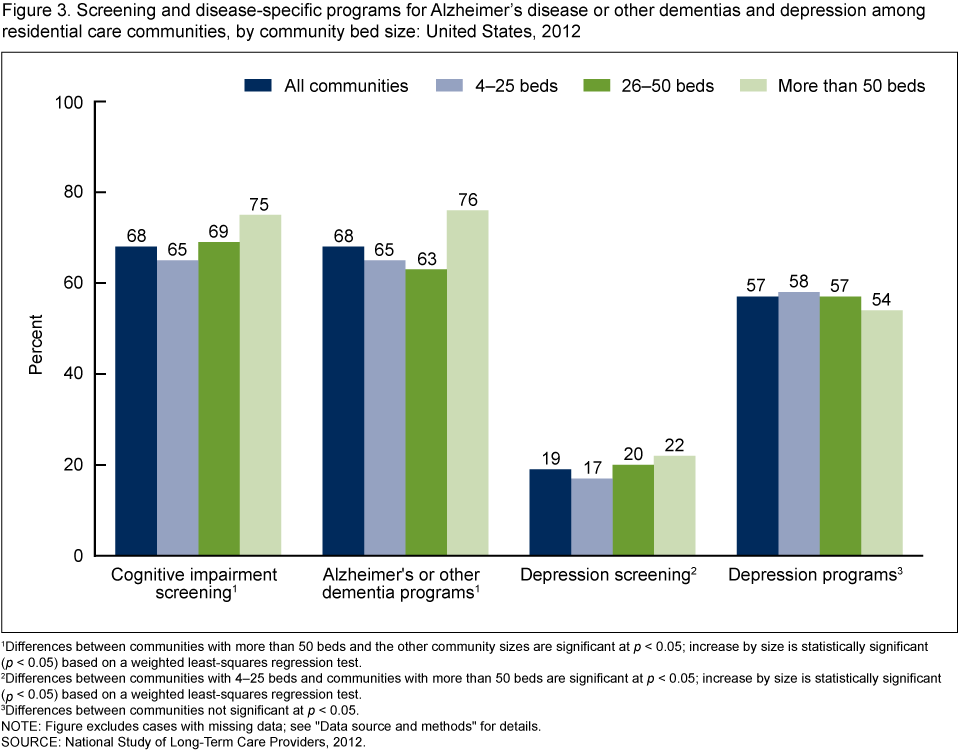
1Differences between communities with more than 50 beds and the other community sizes are significant at p < 0.05; increase by size is statistically significant (p < 0.05) based on a weighted least-squares regression test.
2Differences between communities with 4–25 beds and communities with more than 50 beds are significant at p < 0.05; increase by size is statistically significant (p < 0.05) based on a weighted least-squares regression test.
3Differences between communities not significant at p < 0.05.
NOTE: Figure excludes cases with missing data; see “Data source and methods” for details.
SOURCE: National Study of Long-Term Care Providers, 2012.
A higher percentage of communities with 26–50 beds and more than 50 beds provided therapeutic, hospice, mental health, and dental services compared with communities with 4–25 beds, but a lower percentage of communities with more than 50 beds provided skilled nursing services than did communities with 4–25 beds.
- A higher percentage of communities with 26–50 beds (92%) and more than 50 beds (94%) provided any therapeutic services compared with 85% of communities with 4–25 beds (Figure 4).
- A higher percentage of communities with 26–50 beds (91%) and more than 50 beds (95%) provided hospice services compared with 86% of communities with 4–25 beds.
- A higher percentage of communities with 26–50 beds (80%) and more than 50 beds (86%) provided mental health services compared with 73% of communities with 4–25 beds.
- A higher percentage of communities with 26–50 beds (71%) and more than 50 beds (72%) provided routine and emergency dental services compared with 63% of communities with 4–25 beds.
- A higher percentage of communities with 4–25 beds (77%) and 26–50 beds (78%) provided skilled nursing services compared with 73% of communities with more than 50 beds.
Figure 4. Provision of selected services among residential care communities, by community bed size: United States, 2012
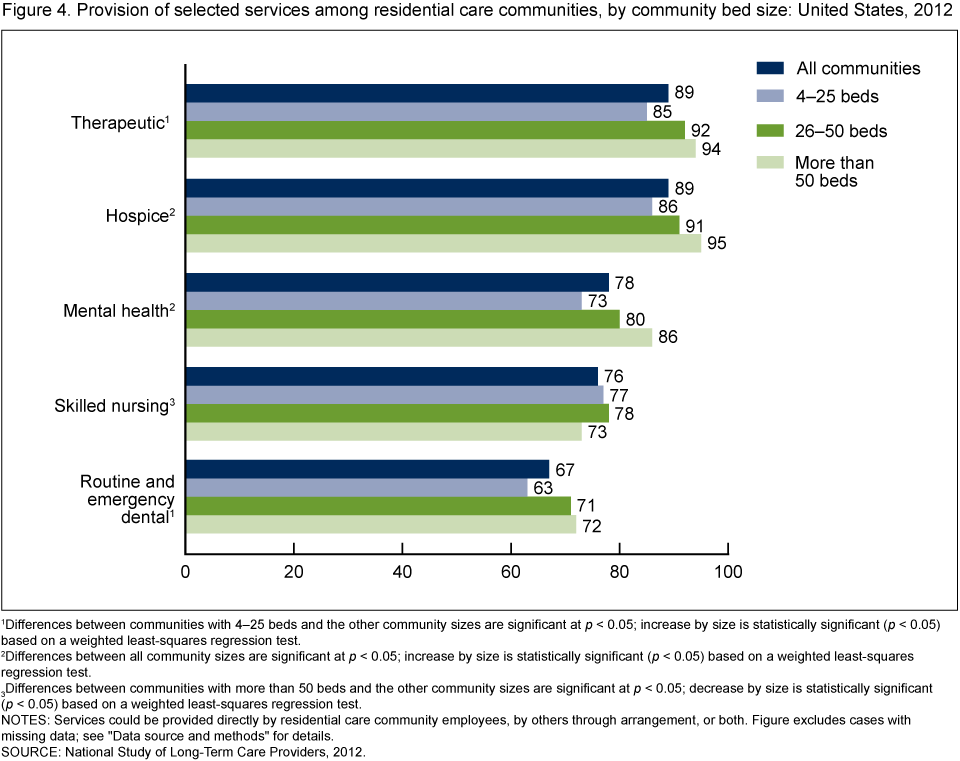
1Differences between communities with 4–25 beds and the other community sizes are significant at p < 0.05; increase by size is statistically significant (p < 0.05) based on a weighted least-squares regression test.
2Differences between all community sizes are significant at p < 0.05; increase by size is statistically significant (p < 0.05) based on a weighted least-squares regression test.
3Differences between communities with more than 50 beds and the other community sizes are significant at p < 0.05; decrease by size is statistically significant (p < 0.05) based on a weighted least-squares regression test.
NOTES: Services could be provided directly by residential care community employees, by others through arrangement, or both. Figure excludes cases with missing data; see “Data source and methods” for details.
SOURCE: National Study of Long-Term Care Providers, 2012.
Summary
In 2012, the majority of residential care communities had 4–25 beds, yet 71% of residents lived in communities with more than 50 beds. A lower percentage of communities with 4–25 beds were chain-affiliated, nonprofit, and in operation 10 years or more, compared with communities with 26–50 and more than 50 beds. Dementia-exclusive care or dementia care units were more common as community size increased. A higher percentage of communities with more than 50 beds screened for cognitive impairment and offered dementia-specific programming compared with communities with 4–25 and 26–50 beds. A higher percentage of communities with more than 50 beds screened for depression compared with communities with 4–25 beds. Compared with communities with 4–25 beds, a higher percentage of communities with 26–50 beds and more than 50 beds provided therapeutic, hospice, mental health, and dental services; but a lower percentage of communities with more than 50 beds provided skilled nursing services than did smaller communities.
This report presents national estimates of residential care communities, using data from the first wave of NSLTCP. This brief profile of residential care communities provides useful information to policymakers, providers, researchers, and consumer advocates as they plan to meet the needs of an aging population. The findings also highlight the diversity of residential care communities across different sizes. Corresponding state estimates and their standard errors for the national figures in this data brief can be found on the NSLTCP website. These national and state estimates establish a baseline for monitoring trends among residents living in residential care.
Definitions
Any therapeutic services: Includes physical, occupational, or speech therapy.
Chain affiliation: Having more than one residential care community under common ownership or management. This may include communities in the same state or across multiple states. If communities were owned by a chain, group, or multicenter system, they were coded as chain-affiliated.
Cognitive impairment screening: Before or upon admission, the residential care community uses a standardized tool to conduct a formal assessment of its residents to identify anyone with a cognitive impairment.
Community bed size: Based on the number of licensed, registered, or certified residential care beds (both occupied and unoccupied) in a residential care community: 4–25, 26–50, and more than 50 beds.
Depression screening: Refers to whether, as part of the admission process, the residential care community screens residents for depression with a standardized tool, such as the Geriatric Depression Scale, Beck Depression Inventory, or the Center for Epidemiological Studies-Depression scale.
Disease-specific programs: Programs that target residents with a specific diagnosis and may include one or more of the following services: medication management, educational, physical activity, diet or nutrition, and weight management programs.
Mental health services: Services that target residents’ mental, emotional, psychological, or psychiatric well-being and include diagnosing, describing, evaluating, and treating mental conditions.
Ownership type: Categorization of residential care communities into two ownership types: private for profit, and nonprofit. The private for-profit category includes publicly traded communities and limited liability communities. Nonprofit includes private nonprofit, as well as federal, state, county, and local government ownership.
Provision of services: Refers to whether residential care communities provided therapeutic, hospice, mental health, skilled nursing, and dental services. These services could be provided by residential care community employees, by others through arrangement, or by both.
Residential care communities: Includes assisted living and other residential care communities (e.g., personal care homes, adult care homes, board care homes, and adult foster care) that meet the study eligibility criteria; see “Data source and methods.”
Residential care bed: Refers to licensed, registered, or certified residential care beds.
Skilled nursing services: Services that must be performed by a registered nurse or a licensed practical nurse and are medical in nature.
Data source and methods
These analyses used data from the residential care community component of the 2012 NSLTCP, which is conducted by the Centers for Disease Control and Prevention’s National Center for Health Statistics (NCHS). NCHS intends to conduct NSLTCP every 2 years.
To be eligible for the study, a residential care community must have:
- Been licensed, registered, listed, certified, or otherwise regulated by the state to:
- Provide room and board with at least two meals a day and around-the-clock, onsite supervision
- Help with personal care such as bathing and dressing or health-related services such as medication management
- Had four or more licensed, certified, or registered beds
- Had at least one resident currently living in the community
- Served a predominantly adult population
Residential care communities licensed to exclusively serve individuals with severe mental illness or intellectual or developmental disabilities were excluded. Nursing homes were also excluded.
The 2012 NSLTCP used a combination of probability sampling and census-taking. Probability samples were selected in the states that had sufficient numbers of residential care communities to enable state-level, sample-based estimation. A census was taken of residential care communities in the states that did not have sufficient numbers of communities or where the number of communities needed for a sample was very close to the total number of communities. From 39,779 communities in the sampling frame, 11,690 residential care communities were sampled and stratified by state and facility bed size. Data were collected through three modes: self-administered, hard-copy questionnaires; self-administered Web questionnaires; and computer-assisted telephone interviews conducted by interviewers. The questionnaire was completed for 4,694 communities, for a weighted response rate (for differential probabilities of selection) of 55.4%. State-level response rates ranged from 40.4% in Michigan to 84.0% in Wyoming.
Differences among subgroups were evaluated using chi-square and t tests. If chi-square tests were statistically significant, a post hoc t test procedure was used to make pairwise comparisons of different facility sizes. Significant results from the post hoc procedure are reported here. A weighted least-squares regression method was used to test the significance of trends. All significance tests were two-sided using p < 0.05 as the level of significance. The difference between any two estimates is mentioned in the text only if it is statistically significant. Data analyses were performed using SAS version 9.3; SAS-callable SUDAAN version 11.0.0 statistical package (RTI International, 2012); and STATA/SE 12.1 (STATACorp LLP, 2013). Cases with missing data were excluded from the analyses on a variable-by-variable basis. The percent missing ranged from 0.2% for chain affiliation to 6.4% for depression screening. Because estimates were rounded, individual estimates may not sum to totals.
The estimate of the number of residential care communities varied between the 2010 National Survey of Residential Care Facilities and the 2012 NSLTCP (2). For more details, see Chapter 5 of “Long-Term Care Services in the United States: 2013 Overview” pdf icon[PDF – 3.49MB].
About the authors
Christine Caffrey, Lauren Harris-Kojetin, Vincent Rome, and Manisha Sengupta are with CDC’s National Center for Health Statistics, Division of Health Care Statistics.
References
- Harris-Kojetin L, Sengupta M, Park-Lee E, Valverde, R. Long-term care services in the United States: 2013 overview. National health care statistics reports; no 1. Hyattsville, MD: National Center for Health Statistics. 2013.
- Park-Lee E, Caffrey C, Sengupta M, Moss AJ, Rosenoff E, Harris-Kojetin LD. Residential care facilities: A key sector in the spectrum of long-term care providers in the United States. NCHS data brief, no 78. Hyattsville, MD: National Center for Health Statistics. 2011.
Suggested citation
Caffrey C, Harris-Kojetin L, Rome V, Sengupta M. Operating characteristics of residential care communities, by community bed size: United States, 2012. NCHS data brief, no 170. Hyattsville, MD: National Center for Health Statistics. 2014.
Copyright information
All material appearing in this report is in the public domain and may be reproduced or copied without permission; citation as to source, however, is appreciated.
National Center for Health Statistics
Charles J. Rothwell, M.S., M.B.A., Director
Jennifer H. Madans, Ph.D., Associate Director for Science
Division of Health Care Statistics
Clarice Brown, M.S., Director