Rural and Urban Hospitals' Role in Providing Inpatient Care, 2010
- Key findings
- What share of inpatient hospital care was delivered in rural compared with urban hospitals?
- How did rural hospital inpatients differ from urban hospital inpatients in 2010?
- How did patients' first-listed diagnoses differ in rural and urban hospitals?
- Were rural and urban inpatients equally likely to have nonsurgical and surgical procedures while in the hospital?
- Were rural and urban hospital patients discharged to different locations?
- Summary
- Definitions
- Data source and methods
- About the authors
- References
- Suggested citation
NCHS Data Brief No. 147, April 2014
PDF Versionpdf icon (555 KB)
Margaret Jean Hall, Ph.D., and Maria Owings, Ph.D.
Key findings
Data from the National Hospital Discharge Survey, 2010
- In 2010, 12% of the 35 million U.S. hospitalizations were in rural hospitals.
- A higher percentage of inpatients in rural hospitals were aged 65 and over (51%) compared with inpatients in urban hospitals (37%).
- The average number of diagnoses for rural and urban inpatients was similar, as was the average length of stay.
- Sixty-four percent of rural hospital inpatients, compared with 38% of urban hospital inpatients, had no procedures performed while in the hospital.
- Following their hospitalization, a higher percentage of rural inpatients (7%) than urban inpatients (3%) were transferred to other short-term hospitals, and a higher percentage of rural (14%) than urban (11%) inpatients were discharged to long-term care institutions.
In 2010, 17% of the U.S. population lived in rural (nonmetropolitan) areas (1). Disparities in health care access between rural and urban areas have been documented (2–4). Rural hospitals not only provide inpatient care, but also emergency department, outpatient department, long-term care, and health care coordination (4,5). Rural hospitals may have difficulty remaining financially viable (5,6). Medicare payment policies help keep the low-volume hospitals solvent so that vulnerable populations have access to health care without traveling to urban areas (4–7). This data brief provides national data on patients served, and inpatient care provided, by rural hospitals in the health care system in 2010.
Keywords: National Hospital Discharge Survey, inpatient hospital utilization
What share of inpatient hospital care was delivered in rural compared with urban hospitals?
- In 2010, 17% of the U.S. population lived in rural areas Figure 1).
- Twelve percent of all hospitalizations (35 million) were in rural hospitals.
- Eleven percent of the total hospital days of care (168 million) were in rural hospitals.
- Six percent of the nonsurgical and surgical inpatient procedures (51 million) performed nationally were in rural hospitals.
Figure 1. Population and inpatient care in rural and urban areas: United States, 2010
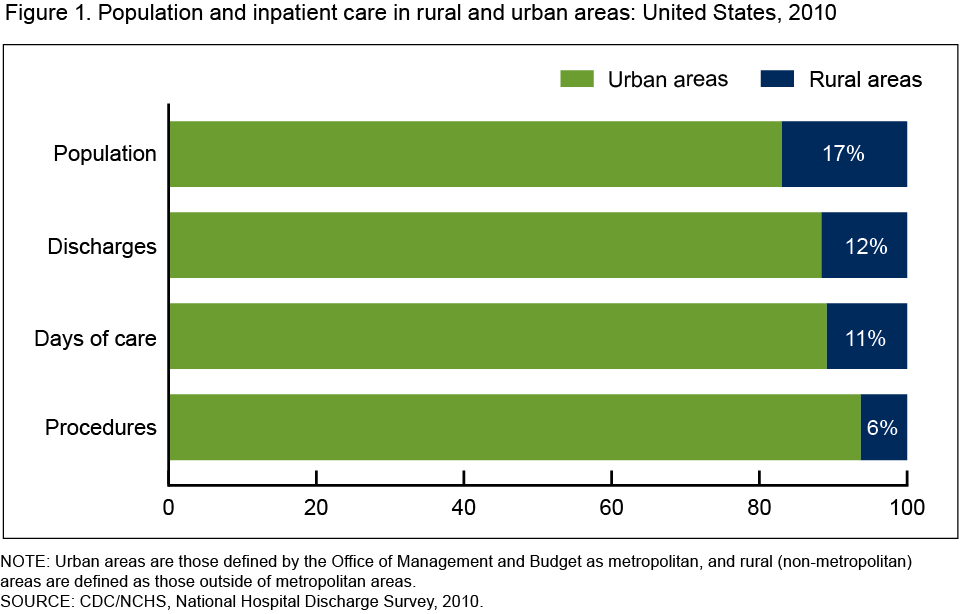
NOTE: Urban areas are those defined by the Office of Management and Budget as metropolitan, and rural (nonmetropolitan) areas are defined as those outside of metropolitan areas.
SOURCE: CDC/NCHS, National Hospital Discharge Survey, 2010.
How did rural hospital inpatients differ from urban hospital inpatients in 2010?
- One-half of the rural hospital inpatients were aged 65 and over, compared with 37% of urban hospital patients (Table).
- A larger percentage of rural hospital inpatients (52%) had Medicare as their principal expected source of payment than did urban hospital inpatients (41%).
- The average number of diagnoses did not differ significantly between rural hospital inpatients (7.9) and urban hospital inpatients (7.4), nor did the average length of stay for rural hospital inpatients (4.5 days) differ significantly from that of urban hospital inpatients (4.8 days).
Table. Characteristics of rural and urban hospital inpatients, 2010
| Rural hospital inpatients | Urban hospital inpatients | |
|---|---|---|
| Total number | 4.1 million | 31.0 million |
| Age 65 and over1 (percent) | 51 | 37 |
| Medicare1 (percent) | 52 | 41 |
| Medicaid (percent) | 15 | 18 |
| Average number of diagnoses | 7.9 | 7.4 |
| Average length of stay | 4.5 days | 4.8 days |
1Difference is statistically significant at the 0.05 level.
SOURCE: CDC/NCHS, National Hospital Discharge Survey, 2010.
How did patients’ first-listed diagnoses differ in rural and urban hospitals?
- Childbirth, cancer, and poisoning are examples of first-listed diagnoses that were relatively more frequent among urban hospital, compared with rural hospital, inpatients (Figure 2).
- Some first-listed diagnoses, including dehydration, bronchitis, and pneumonia, were relatively more frequent among rural hospital inpatients compared with urban hospital inpatients. No significant differences were observed in the relative frequency of rural and urban hospital inpatients with first-listed diagnoses such as septicemia, congestive heart failure, and heart attack.
Figure 2. Comparison of selected first-listed diagnoses in rural and urban hospitals: United States, 2010

1Difference between rural and urban hospitals is statistically significant at the 0.05 level.
NOTE: CHF is congestive heart failure.
SOURCE: CDC/NCHS, National Hospital Discharge Survey, 2010.
Were rural and urban inpatients equally likely to have nonsurgical and surgical procedures while in the hospital?
- Sixty-four percent of inpatients at rural hospitals compared with 38% of inpatients at urban hospitals had no surgical or nonsurgical procedures performed during their hospital stay (Figure 3).
- Urban hospital inpatients were more than twice as likely to have three or more procedures performed than rural hospital inpatients.
Figure 3. Inpatient procedures in rural and urban hospitals, 2010
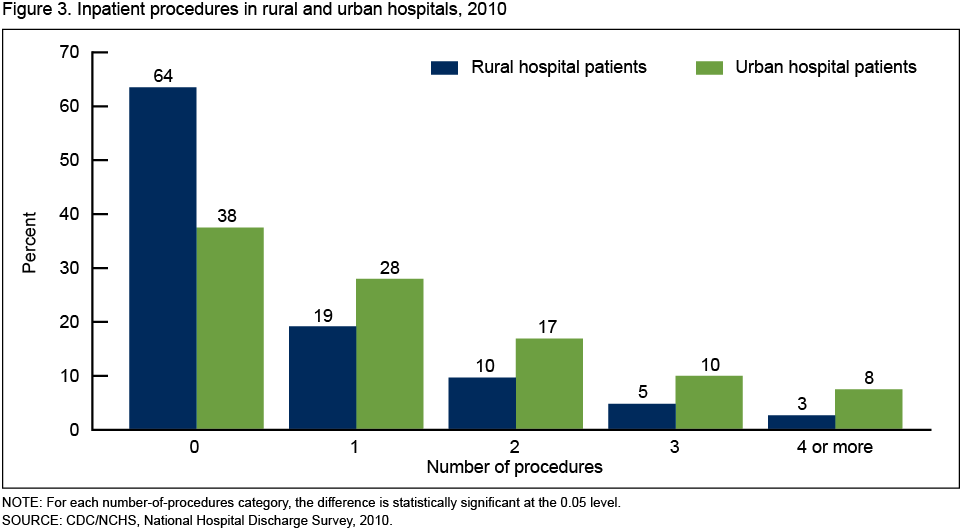
NOTE: For each number-of-procedures category, the difference is statistically significant at the 0.05 level.
SOURCE: CDC/NCHS, National Hospital Discharge Survey, 2010.
Were rural and urban hospital patients discharged to different locations?
- A majority of hospital inpatients, both rural (65%) and urban (78%), were discharged home (Figure 4).
- Rural hospital inpatients (7%) were more likely than urban hospital inpatients (3%) to be transferred to another short-term hospital following their hospital stay.
- A higher percentage of rural (14%) than urban (11%) hospital inpatients were discharged to long-term care institutions.
- The percentage of inpatients who died in the hospital was small—2% for both rural and urban hospital inpatients.
Figure 4. Discharge status following rural and urban hospitalization, 2010
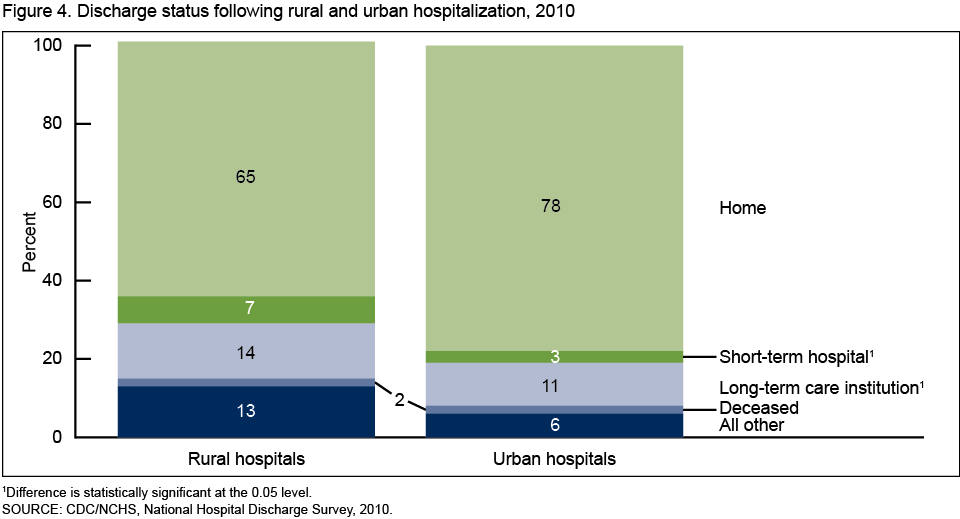
1Difference is statistically significant at the 0.05 level.
SOURCE: CDC/NCHS, National Hospital Discharge Survey, 2010.
Summary
Similarities were found between rural and urban hospital patients in the average number of diagnoses, average lengths of stay, proportions of inpatients with Medicaid, and percentage of those who died while in the hospital. Among differences, a higher percentage of rural hospital inpatients were over age 65 and on Medicare compared with urban hospital inpatients, and rural hospital inpatients were more likely than their urban counterparts to be discharged to other short-term hospitals and to long-term care institutions. Some diagnoses were relatively more common in either rural or urban hospitals, while other diagnoses were equally common in both rural and urban settings.
Although 17% of the U.S. population lived in rural areas in 2010 (1), only 12% of total hospitalizations, 11% of the days of care, and 6% of the inpatient procedures were provided in rural hospitals. The data in this report show that patients hospitalized in urban hospitals were more likely to have procedures performed during their hospitalization, and to have a greater number of procedures performed, than those hospitalized in rural hospitals. This could be due to the shortage of specialty physicians in rural areas, the lack of other staff skilled in surgery, or the absence of costly equipment needed for many surgical and nonsurgical procedures in rural hospitals (6,8). Because of economies of scale, rural hospitals may forego offering many procedures and instead choose to focus on patients needing basic inpatient surgical care (9), and on patients needing medical, rather than surgical, treatment (10).
Definitions
First-listed diagnoses: The principal diagnosis considered to be the main cause or reason for the hospitalization. Diagnoses are coded according to the International Classification of Diseases, 9th Revision, Clinical Modification (ICD–9–CM) coding system (11). ICD–9–CM codes for the first-listed diagnoses noted in this report (Figure 2), in order, are:
Childbirth (females with deliveries)—ICD–9–CM code V27
Cancer (malignant neoplasms)—ICD–9–CM codes 140–209.36, 209.70–209.75, 209.79, 230–234
Poisoning—ICD–9–CM codes 960–989
Dehydration (volume depletion)—ICD–9–CM code 276.5
Bronchitis (acute and chronic)—ICD–9–CM codes 466, 491
Pneumonia—ICD–9–CM codes 480–486
Septicemia—ICD–9–CM code 038
Congestive heart failure—ICD–9–CM codes 428.0, 428.2–428.4
Heart attack (acute myocardial infarction)—ICD–9–CM code 410
These categories were selected primarily because of their frequency in both rural and urban hospitals and the considerable interest in them. Figure 2 shows examples of first-listed diagnoses relatively more frequent in rural hospitals, those relatively more frequent in urban hospitals, and those with similar relative frequencies in both rural and urban hospitals.
Insurance coverage: Patients were considered covered by Medicare, Medicaid, or private insurance based upon the principal expected source of payment noted in their medical record.
Urban and rural hospitals: Urban or rural designation is based on the county in which hospitals were located. Counties were classified by the Office of Management and Budget (OMB) according to their metropolitan status using standards originally applied to U.S. Census 2000 data and updated in 2005 (12,13). Counties identified by OMB as metropolitan were considered to be urban, and all other counties (nonmetropolitan) were considered to be rural. Metropolitan counties include large central cities, the fringes of large cities (suburbs), medium cities, and small cities. Nonmetropolitan counties include micropolitan statistical areas and noncore areas, and include open countryside, rural towns (with population less than 2,500 people), and areas with populations of 2,500–49,999 that are not part of larger labor-market areas (metropolitan areas).
Several other ways of defining rural and urban areas are used, but according to the U.S. Agriculture Department’s Economic Research Service (14), metropolitan status is used to determine eligibility for a range of public programs and by researchers and others who analyze conditions in “rural” America. While the categories within urban and rural are very broad using this definition, analysis of more refined categories would not be supported by the sample size in this national survey. Research by National Center for Health Statistics analysts has confirmed that these categories are meaningful for analyzing health data (15).
Data source and methods
Data are from the National Hospital Discharge Survey (NHDS), a national probability sample survey of discharges from nonfederal, noninstitutional short-stay hospitals or general hospitals in the United States, conducted annually from 1965 through 2010 by the Centers for Disease Control and Prevention’s (CDC) National Center for Health Statistics (NCHS), Division of Health Care Statistics. Survey data on hospital discharges were obtained from the hospitals’ administrative data. Note that if a person is admitted to the hospital multiple times during the survey year, that person is counted more than once in NHDS.
Because of the complex multistage design of NHDS, the survey data must be inflated or weighted to produce national estimates. Estimates of inpatient care presented in this report exclude newborns. More details about the design of NHDS have been published elsewhere (16).
Differences between rural and urban hospital inpatients were evaluated using unrounded numbers with two-tailed t tests using a p value of 0.05 as the level of significance. Calculation of percentages, average length of stay, and average number of diagnoses were computed using unrounded numbers, so the results may differ from what would be obtained using the rounded figures in the text, figures, and tables.
Differences in first-listed diagnoses between rural and urban hospital inpatients reported in Figure 2 were calculated based on the relative frequency of these diagnoses. The relative frequency was obtained by dividing the number of rural or urban inpatients with each selected first-listed diagnosis by the total number of either rural or urban inpatients. This gave the proportion (percentage) of inpatients with each of these diagnoses in rural and in urban hospitals. The t test was used to determine whether the relative frequency of each of these diagnoses was significantly different in rural and urban hospitals.
Data analyses were performed using SAS version 9.3 (SAS Institute, Cary, N.C.) and SUDAAN version 11.0 (RTI International, Research Triangle Park, N.C.).
About the authors
Margaret Jean Hall and Maria F. Owings are with CDC/NCHS, Division of Health Care Statistics.
References
- Health Resources and Services Administration, Department of Health and Human Services. Area resource file (ARF). 2012.
- Lipsky MS, Glasser M. Critical access hospitals and the challenges to quality care. Editorial. JAMA 306(1):96–7. July 6, 2011.
- Gamm L, Castillo G, Pittman S. Access to quality health services in rural areas—Primary care: A literature review. Rural Health People 2010: A companion document to Healthy People 2010. Volume 2. College Station, TX: The Texas A&M University System Health Science Center, School of Rural Public Health, Southwest Rural Health Research Center. 2003.
- Escarce JJ, Kapur K. Do patients bypass rural hospitals? Determinants of inpatient hospital choice in rural California. J Health Care Poor Underserved 20(3):625–44. 2009.
- Moscovice I, Stensland J. Rural hospitals: Trends, challenges, and a future research and policy analysis agenda. J Rural Health 18(Suppl):197–210. 2002.
- Center for Health Reform & Modernization, UnitedHealth. Modernizing rural health care: Coverage, quality and innovation. Working paper 6. July 2011.
- Rosko MD, Mutter RL. Inefficiency differences between critical access hospitals and prospectively paid rural hospitals. J Health Polit Policy Law 35(1):95–126. 2010.
- MEDPAC. Report to Congress: Medicare in rural America. Washington, DC: 2001.
- Gadzinski AJ, Dimick JB, Ye Z, Miller DC. Utilization and outcomes of inpatient surgical care at critical access hospitals in the United States. JAMA Surg, 148(7):589-96. 2013.
- Holmes GM, Karim SA, Pink GH. Trends in the provision of surgery by rural hospitals. North Carolina Rural Health Research & Policy Analysis Center, Cecil G. Sheps Center for Health Services Research, UNC–Chapel Hill. Findings brief. 2011.
- Centers for Medicare & Medicaid Services. International classification of diseases, ninth revision, clinical modification, 6th ed. DHHS Pub No. (PHS) 06–1260. 2006. Available from: https://www.cdc.gov/nchs/icd/icd9cm.htm.
- Office of Management and Budget. Standards for defining metropolitan and micropolitan statistical areas; noticepdf iconexternal icon. Fed Regist 65(249):82227–38. December 27, 2000.
- Office of Management and Budget. Update of statistical area definitions and guidance on their usespdf iconexternal icon. OMB Bulletin no 06–01. Washington, DC. 2005.
- Economic Research Service, U.S. Department of Agriculture. Rural classifications: Overviewexternal icon. Updated May 10, 2013.
- Ingram DD, Franco SJ. NCHS urban-rural classification scheme for counties. National Center for Health Statistics. Vital Health Stat 2(154)pdf icon. 2012.
- Hall MJ, DeFrances CJ, Williams SN, et al. National Hospital Discharge Survey: 2007 summary. National health statistics reports; no 29pdf icon. Hyattsville, MD: National Center for Health Statistics. 2010.
Suggested citation
Hall MJ, Owings M. Rural and urban hospitals’ role in providing inpatient care, 2010. NCHS data brief, no 147. Hyattsville, MD: National Center for Health Statistics. 2014.
Copyright information
All material appearing in this report is in the public domain and may be reproduced or copied without permission; citation as to source, however, is appreciated.
National Center for Health Statistics
Charles J. Rothwell, M.S., M.B.A., Director
Jennifer H. Madans, Ph.D., Associate Director for Science
Division of Health Care Statistics
Clarice Brown, M.S., Director