Physical Activity in U.S. Youth Aged 12–15 Years, 2012
- Key findings
- What percentage of youth engaged in moderate-to-vigorous physical activity for at least 60 minutes each day?
- Outside of school-based PE and gym classes, what were the most common types of activities reported by boys?
- Outside of school-based PE and gym classes, what were the most common types of activities reported by girls?
- Did engaging in moderate-to-vigorous physical activity among youth differ by weight status?
- Summary
- Definitions
- Data source and methods
- About the authors
- References
- Suggested citation
NCHS Data Brief No. 141, January 2014
PDF Versionpdf icon (1.36 MB)
Tala H.I. Fakhouri, Ph.D., M.P.H.; Jeffery P. Hughes, M.P.H.; Vicki L. Burt, Sc.M., R.N.; MinKyoung Song, Ph.D., R.N.; Janet E. Fulton, Ph.D.; and Cynthia L. Ogden Ph.D., M.R.P.
Key findings
Data from the combined National Health and Nutrition Examination Survey (NHANES) and the NHANES National Youth Fitness Survey, 2012
- In 2012, about one-quarter of U.S. youth aged 12–15 years engaged in moderate-to-vigorous physical activity for at least 60 minutes daily.
- Basketball was the most common activity reported among active boys, followed by running, football, bike riding, and walking.
- Running was the most common activity among active girls, followed by walking, basketball, dancing, and bike riding.
- The percentage of male youth who were physically active for at least 60 minutes daily decreased as weight status increased.
The 2008 Physical Activity Guidelines for Americans, which have been adopted by the First Lady’s Let’s Move! initiative and the American Academy of Pediatrics, recommend that youth participate in daily moderate-to-vigorous physical activity for at least 60 minutes (1–5). This report presents the most recent national data from 2012 on self-reported physical activity among youth aged 12–15 years, by sex and weight status. This report also describes the most common types of physical activities—outside of school-based physical education (PE) or gym classes—in which youth engage.
Keywords: National Health and Nutrition Examination Survey, NHANES National Youth Fitness Survey
What percentage of youth engaged in moderate-to-vigorous physical activity for at least 60 minutes each day?
About one-quarter (24.8%) of youth engaged in moderate-to-vigorous physical activity, including activities both in school and outside of school, for at least 60 minutes daily (data not shown in figure). Only 7.6% did not engage in moderate-to-vigorous physical activity for 60 minutes on any day of the week (data not shown in figure). Among boys, 27.0% engaged in moderate-to-vigorous physical activity for at least 60 minutes daily compared with 22.5% of girls (Figure 1). More than one-half (60.2%) of boys surveyed and about one-half (49.4%) of girls engaged in moderate-to-vigorous physical activity for at least 60 minutes on 5 days or more each week. Among boys, 6.4% did not engage in moderate-to-vigorous physical activity on any day of the week compared with 8.7% of girls. Differences between boys and girls were not statistically significant.
Figure 1. Percentage of youth who were physically active, by number of days per week and sex: United States, 2012
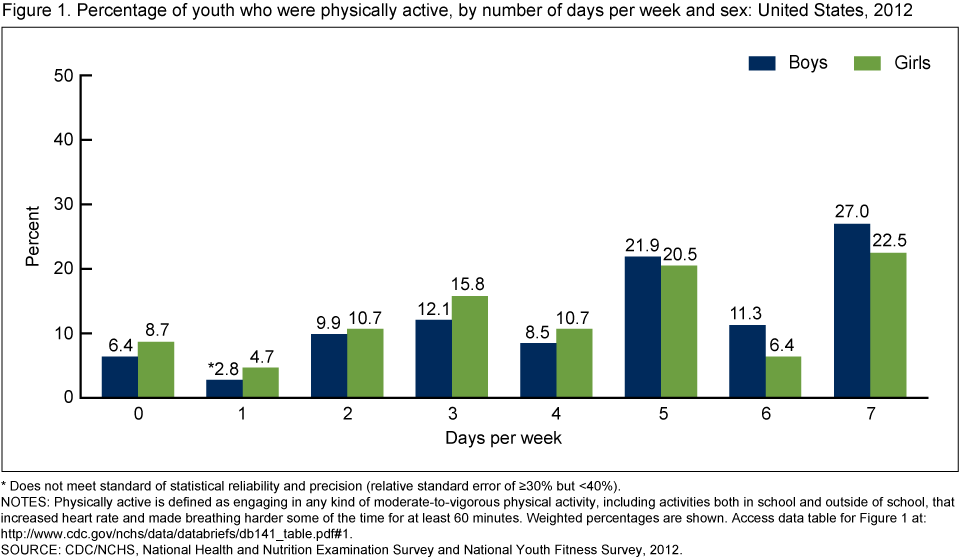
* Does not meet standard of statistical reliability and precision (relative standard error of ≥30% but <40%).
NOTES: Physically active is defined as engaging in any kind of moderate-to-vigorous physical activity, including activities both in school and outside of school, that increased heart rate and made breathing harder some of the time for at least 60 minutes. Weighted percentages are shown. Access data table for Figure 1 pdf icon[PDF – 510 KB].
SOURCE: CDC/NCHS, National Health and Nutrition Examination Survey and National Youth Fitness Survey, 2012.
Outside of school-based PE and gym classes, what were the most common types of activities reported by boys?
Among boys who reported physical activity of any intensity in the past week, the most common activity was basketball, with about one-half (48.0%) of all active boys reporting that they played basketball (Figure 2). The second most common activity among physically active boys was running (33.5%), followed by football (27.4%).
Figure 2. The top five activities outside of school-based physical education and gym classes reported among boys aged 12–15 years: United States, 2012
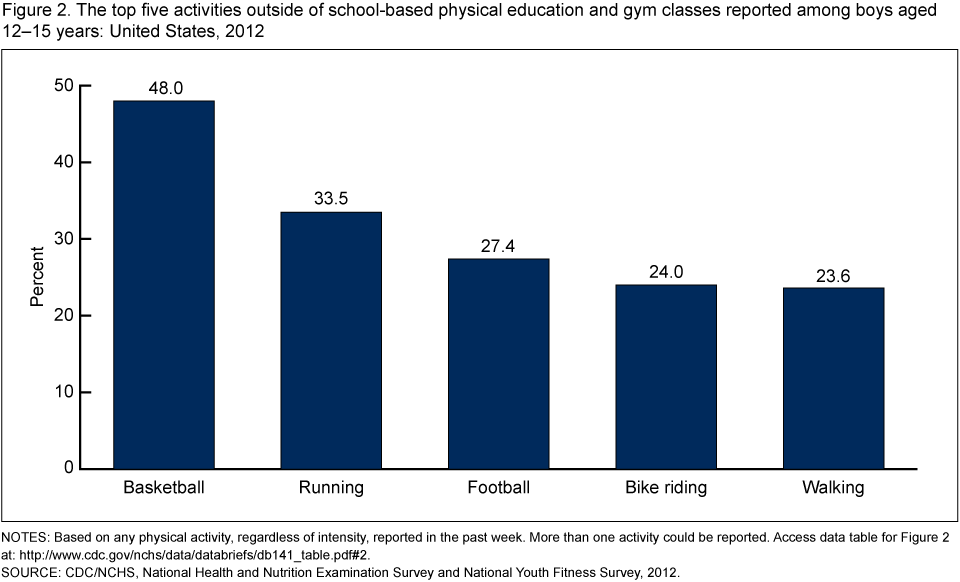
NOTES: Based on any physical activity, regardless of intensity, reported in the past week. More than one activity could be reported. Access data table for Figure 2 pdf icon[PDF – 510 KB].
SOURCE: CDC/NCHS, National Health and Nutrition Examination Survey and National Youth Fitness Survey, 2012.
Outside of school-based PE and gym classes, what were the most common types of activities reported by girls?
Among girls who reported physical activity of any intensity in the past week, the most common activity was running, with about one-third (34.9%) reporting that they ran (Figure 3). The second most common activity reported by girls was walking, with 27.6% reporting that they walked, and the third most common activity was playing basketball (21.4%).
Figure 3. The top five activities outside of school-based physical education and gym classes reported among girls aged 12–15 years: United States, 2012
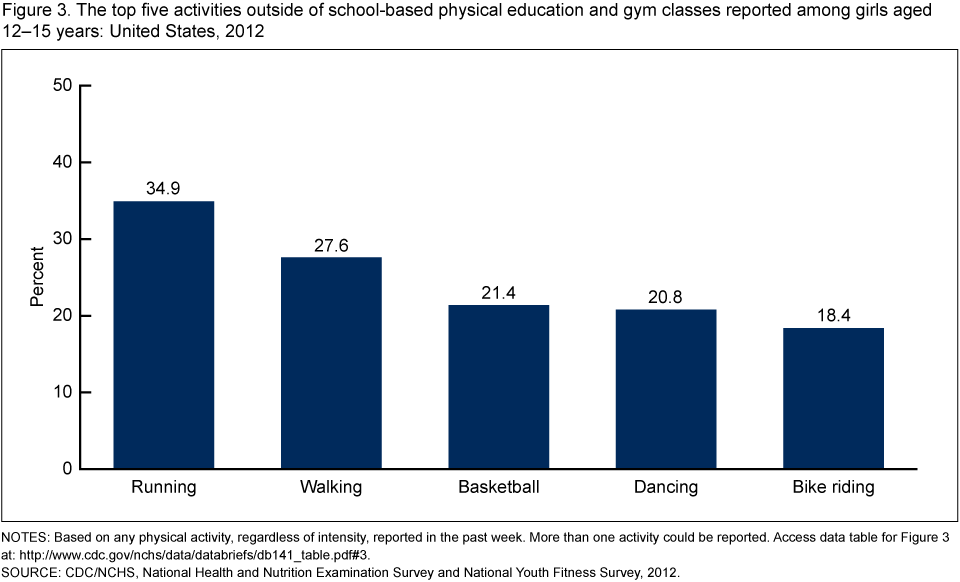
NOTES: Based on any physical activity, regardless of intensity, reported in the past week. More than one activity could be reported. Access data table for Figure 3 pdf icon[PDF – 510 KB]
SOURCE: CDC/NCHS, National Health and Nutrition Examination Survey and National Youth Fitness Survey, 2012.
Did engaging in moderate-to-vigorous physical activity among youth differ by weight status?
Among boys, 29.5% of normal-weight and 29.5% of overweight individuals engaged in moderate-to-vigorous physical activity on every day of the week for at least 60 minutes compared with 18.0% of obese boys (Figure 4). A similar pattern was observed for girls; however, the differences were not significant. Among girls, 24.1% of normal-weight, 20.1% of overweight, and 19.6% of obese individuals engaged in moderate-to-vigorous physical activity on every day of the week for at least 60 minutes.
Figure 4. The percentage of youth who were physically active daily, by weight status and sex: United States, 2012
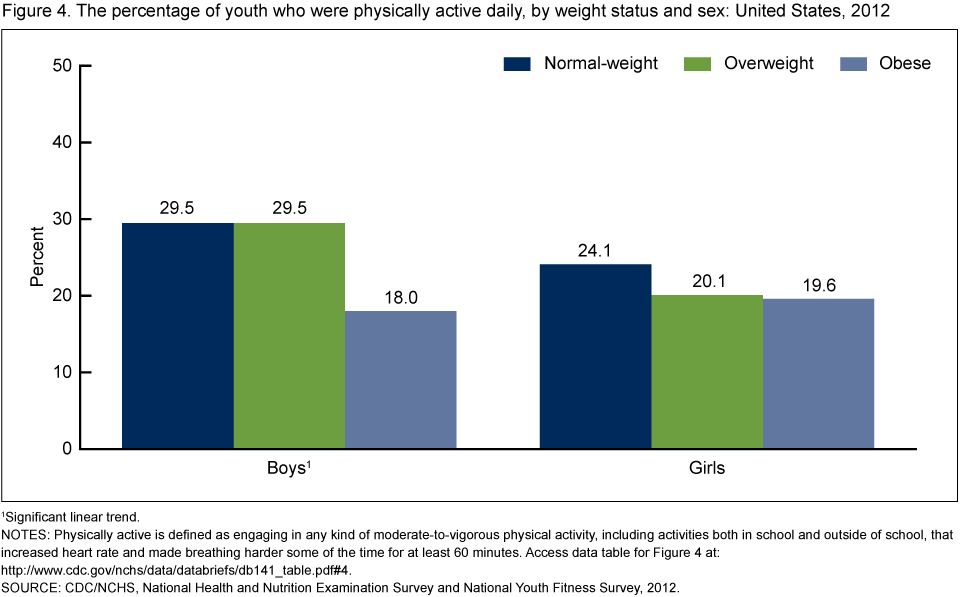
1Significant linear trend.
NOTES: Physically active is defined as engaging in any kind of moderate-to-vigorous physical activity, including activities both in school and outside of school, that increased heart rate and made breathing harder some of the time for at least 60 minutes. Access data table for Figure 4 pdf icon[PDF – 510 KB]
SOURCE: CDC/NCHS, National Health and Nutrition Examination Survey and National Youth Fitness Survey, 2012.
Summary
Regular physical activity among youth promotes physical and psychological health and improves some aspects of academic performance (1,6). In 2012, about one-quarter of U.S. youth aged 12–15 years met federal physical activity guidelines of at least 60 minutes of daily moderate-to-vigorous physical activity based on self-reports of the number of days on which they engaged in 60 minutes of activities that increased their heart rate and made them breathe hard some of the time. U.S. youth engaged in a wide range of physical activities outside of school-based PE and gym classes, including basketball, football, running, and dancing. In fact, almost one-half of all U.S. boys aged 12–15 years who reported activities outside of gym classes reported playing basketball during the previous week.
Although not a statistically significant difference, 27.0% of boys and 22.5% of girls engaged in moderate-to-vigorous physical activity for 60 minutes or more on every day of the week in 2012. Most studies of physical activity in children and adolescents find boys to be more physically active than girls (7–11).
Compared with normal-weight boys, a smaller percentage of obese boys were active on every day of the week for at least 60 minutes per day. Similarly, a smaller percentage of obese girls, compared with normal-weight girls, were active on every day of the week for at least 60 minutes per day; however, this difference was not statistically significant. Our findings are consistent with those from other nationally representative samples of school-aged children (7). The association between obesity and physical activity is complex. For example, childhood obesity has been partially attributed to physical inactivity (12), although some studies suggest that physical inactivity may be the result of obesity (13).
Physical activity behaviors track from childhood into young adulthood (14–17). Given that physical inactivity in adulthood is a modifiable risk factor for many diseases, such as cardiovascular disease and cancer (1), tracking the prevalence of physical activity among U.S. youth may help inform public health interventions.
Definitions
Physical activity: Moderate-to-vigorous physical activity was assessed by asking youth the following question: “During the past 7 days, on how many days were you physically active for a total of at least 60 minutes per day? Add up all the time you spent in any kind of physical activity that increased your heart rate and made you breathe hard some of the time.” Responses ranged from 0 to 7 days.
For the type of physical activity, regardless of intensity, respondents were first asked to report whether they participated in any physical activity in the past week other than PE or gym class. Specifically, respondents were asked, “For the next questions, think about the sports, lessons, or physical activities you may have done during the past 7 days. (Please do not include things you did during the school day like PE or gym class.) Did you do any physical activities during the past 7 days?” Respondents who answered “yes” to the question were then asked, using an open-ended question, to report the types of activities in which they participated.
Weight status: Categories were based on the Centers for Disease Control and Prevention’s (CDC) sex-specific 2000 body mass index (BMI)-for-age growth charts for the United States (18). The three categories were underweight or normal-weight (a BMI-for-age less than the 85th percentile), overweight (a BMI-for-age ranging from the 85th to less than the 95th percentile), and obese (a BMI-for-age greater than or equal to the 95th percentile).
Data source and methods
These analyses used data from the combined 2012 National Health and Nutrition Examination Survey (NHANES) and the 2012 NHANES National Youth Fitness Survey (NNYFS). CDC’s National Center for Health Statistics conducted NHANES and NNYFS in 2012. NHANES assesses the health and nutritional status of the entire civilian noninstitutionalized U.S. population. The 2012 NNYFS assessed the physical activity and fitness levels in children and adolescents aged 3–15 years to examine their health and fitness. The surveys included an in-home interview followed by a standardized physical examination in a mobile examination center. Both surveys collected physical activity data via questionnaire in children and adolescents aged 3–15 years. Our analysis was restricted to youth aged 12–15 years for two reasons. First, physical activity guidelines for children aged 3–5 years are not well defined (19). Second, the surveys assessed physical activity differently for elementary school-aged children (aged 6–11 years).
Both NHANES and NNYFS used a complex, multistage probability sampling design to select participants. The NHANES sample design included oversampling to obtain reliable estimates of health and nutritional measures for population subgroups, but the NNYFS did not. Data were analyzed using special sample weights for the combined surveys to account for differential probabilities of selection, nonresponse, and noncoverage. The standard errors of the percentages were estimated using Taylor series linearization, a method that incorporates the sample design. Differences between groups were evaluated using a t statistic at the p < 0.05 significance level with the appropriate degrees of freedom. All differences reported are statistically significant unless otherwise indicated. To test for linear trends between weight groups, the null hypothesis of a nonlinear trend was examined using orthogonal polynomials. Statistical analyses were conducted using the SAS System for Windows (release 9.3; SAS Institute, Inc., Cary, N.C.) and SUDAAN (release 11.0; RTI International, Research Triangle Park, N.C.).
About the authors
Tala H.I. Fakhouri, Jeffery P. Hughes, Vicki L. Burt, and Cynthia L. Ogden are with CDC’s National Center for Health Statistics, Division of Health and Nutrition Examination Surveys. MinKyoung Song and Janet E. Fulton are with CDC’s National Center for Chronic Disease Prevention and Health Promotion, Division of Nutrition, Physical Activity, and Obesity.
References
- Physical Activity Guidelines Advisory Committee. Physical Activity Guidelines Advisory Committee report, 2008 pdf icon[PDF – 4.6 MB]external icon. Washington, DC: U.S. Department of Health and Human Services. 2008.
- Let’s Move!external icon
- Expert Panel on Integrated Guidelines for Cardiovascular Health and Risk Reduction in Children and Adolescents. Expert Panel on Integrated Guidelines for Cardiovascular Health and Risk Reduction in Children and Adolescents: Summary report. Pediatrics 128(Suppl 5):S213–56. 2011.
- Expert Panel on Integrated Pediatric Guideline for Cardiovascular Health and Risk Reduction. Pediatrics 129(4):e1111. 2012.
- Barlow SE. Expert committee recommendations regarding the prevention, assessment, and treatment of child and adolescent overweight and obesity: Summary report. Pediatrics 120(Suppl 4):S164–92. 2007.
- Rasberry CN, Lee SM, Robin L, Laris BA, Russell LA, Coyle KK, Nihiser AJ. The association between school-based physical activity, including physical education, and academic performance: A systematic review of the literature. Prev Med 52(Suppl 1):S10–20. 2011.
- Fakhouri TH, Hughes JP, Brody DJ, Kit BK, Ogden CL. Physical activity and screen-time viewing among elementary school-aged children in the United States from 2009 to 2010. JAMA Pediatr 167(3):223–9. 2013.
- Sallis JF, Prochaska JJ, Taylor WC. A review of correlates of physical activity of children and adolescents. Med Sci Sports Exerc 32(5):963–75. 2000.
- Anderson SE, Economos CD, Must A. Active play and screen time in U.S. children aged 4 to 11 years in relation to sociodemographic and weight status characteristics: A nationally representative cross-sectional analysis. BMC Public Health 8:366. 2008.
- Troiano RP, Berrigan D, Dodd KW, Masse LC, Tilert T, McDowell M. Physical activity in the United States measured by accelerometer. Med Sci Sports Exerc 40(1):181–8. 2008.
- Chung AE, Skinner AC, Steiner MJ, Perrin EM. Physical activity and BMI in a nationally representative sample of children and adolescents. Clin Pediatr Phila 51(2):122–9. 2012.
- Wareham NJ, van Sluijs EM, Ekelund U. Physical activity and obesity prevention: A review of the current evidence. Proc Nutr Soc 64(2):229–47. 2005.
- Metcalf BS, Hosking J, Jeffery AN, Voss LD, Henley W, Wilkin TJ. Fatness leads to inactivity, but inactivity does not lead to fatness: A longitudinal study in children (EarlyBird 45). Arch Dis Child 96(10):942–7. 2011.
- Telama R, Yang X, Viikari J, Valimaki I, Wanne O, Raitakari O. Physical activity from childhood to adulthood: A 21-year tracking study. Am J Prev Med 28(3):267–73. 2005.
- Telama R. Tracking of physical activity from childhood to adulthood: A review. Obes Facts 2(3):187–95. 2009.
- Raitakari OT, Porkka KV, Taimela S, Telama R, Rasanen L, Viikari JS. Effects of persistent physical activity and inactivity on coronary risk factors in children and young adults. The Cardiovascular Risk in Young Finns Study. Am J Epidemiol 140(3):195–205. 1994.
- Biddle SJ, Pearson N, Ross GM, Braithwaite R. Tracking of sedentary behaviours of young people: A systematic review. Prev Med 51(5):345–51. 2010.
- Ogden CL, Flegal KM. Changes in terminology for childhood overweight and obesity. National health statistics reports; no 25. Hyattsville, MD: National Center for Health Statistics. 2010.
- Beets MW, Bornstein D, Dowda M, Pate RR. Compliance with national guidelines for physical activity in U.S. preschoolers: Measurement and interpretation. Pediatrics 127(4):658–64. 2011.
Suggested citation
Fakhouri THI, Hughes JP, Burt VL, et al. Physical activity in U.S. youth aged 12–15 years, 2012. NCHS data brief, no 141. Hyattsville, MD: National Center for Health Statistics. 2014.
Copyright information
All material appearing in this report is in the public domain and may be reproduced or copied without permission; citation as to source, however, is appreciated.
National Center for Health Statistics
Charles J. Rothwell, M.S., M.B.A., Director
Jennifer H. Madans, Ph.D., Associate Director for Science
Division of Health and Nutrition Examination Surveys
Kathryn S. Porter, M.D., M.S., Director