Consumption of Diet Drinks in the United States, 2009‒2010
- Key findings
- What percentage of the U.S. population consumed diet drinks?
- How many ounces of diet drinks did people consume?
- Were racial or ethnic differences observed in the percentage of diet drink consumers?
- Were income differences found in the percentage of diet drink consumers?
- Did the percentage of diet drink consumers increase between 1999 and 2010?
- Summary
- Definitions
- Data source and methods
- About the authors
- References
- Suggested citation
NCHS Data Brief No. 109, October 2012
PDF Versionpdf icon (592 KB)
Tala H.I. Fakhouri, Ph.D., M.P.H.; Brian K. Kit, M.D., M.P.H.; and Cynthia L. Ogden, Ph.D., M.R.P.
Key findings
Data from the National Health and Nutrition Examination Survey, 2009‒2010
- About one-fifth of the U.S. population consumed diet drinks on a given day.
- The percentage consuming diet drinks was similar for females and males at all ages except among 12- to 19-year-olds, where a higher percentage of females than males consumed diet drinks.
- A higher percentage of non-Hispanic white persons consumed diet drinks compared with non-Hispanic black and Hispanic persons.
- From 1999‒2000 through 2009‒2010, the percentage of persons consuming diet beverages increased.
Sugar drinks are a major source of added sugars in the diets of Americans (1). Several recent studies have described factors associated with sugar-drink consumption (2,3); however, the consumption of diet drinks among the U.S. population has not been as well-characterized. This report describes the consumption of diet beverages among the U.S. population during 2009‒2010 by sex, age, race and ethnicity, and income, and details trends in diet drink consumption from 1999‒2000 through 2009‒2010.
Keywords: National Health and Nutrition Examination Survey, beverages
What percentage of the U.S. population consumed diet drinks?
About 20% of the U.S. population aged 2 years and over consumed diet drinks on a given day during 2009‒2010. The percentage consuming diet drinks was similar for females and males at all ages except among adolescents aged 12‒19. The percentage consuming diet drinks increased with age for both males and females (Figure 1).
Figure 1. Percentage of population aged 2 years and over who consumed diet drinks on a given day: United States, 2009‒2010
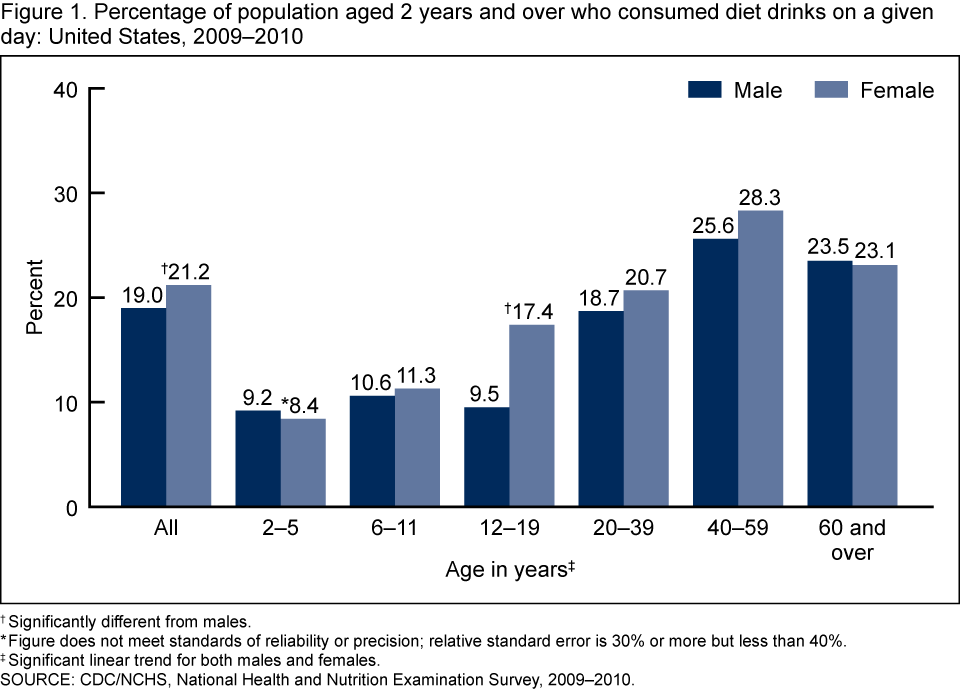
†Significantly different from males.
* Figure does not meet standards of reliability or precision; relative standard error is 30% or more but less than 40%.
‡ Significant linear trend for both males and females.
SOURCE: CDC/NCHS, National Health and Nutrition Examination Survey, 2009‒2010.
How many ounces of diet drinks did people consume?
About 80% of people consumed no diet beverages. On a given day, about 3% consumed some but no more than 8 fluid ounces (fl oz) of diet drinks, and 11% consumed 16 fl oz or more (Figure 2).
Figure 2. Percentage of population aged 2 years and over who consumed diet drinks on a given day, by amount: United States, 2009‒2010
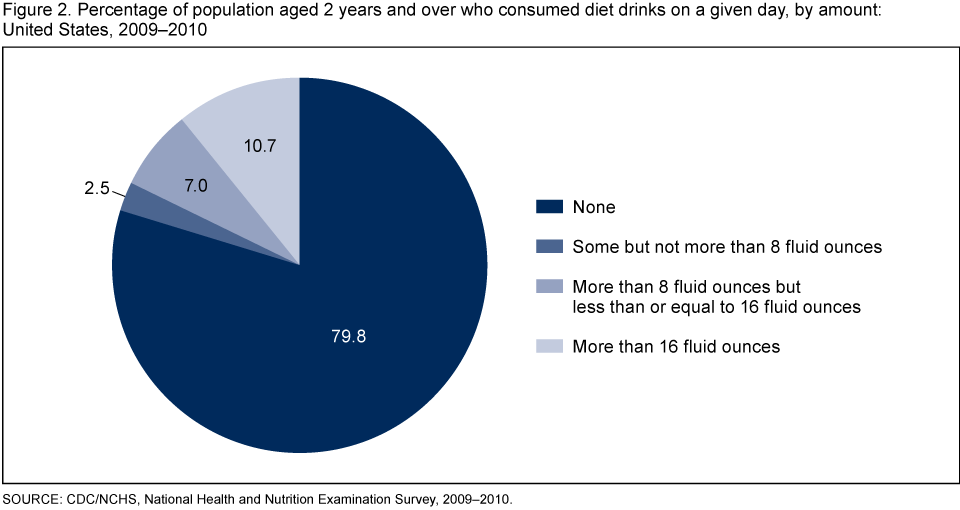
SOURCE: CDC/NCHS, National Health and Nutrition Examination Survey, 2009‒2010.
Were racial or ethnic differences observed in the percentage of diet drink consumers?
Diet drink consumption differed by race and ethnicity. Although 15.3% of non-Hispanic white children and adolescents consumed diet drinks, only 6.8% of non-Hispanic black and 7.5% of Hispanic children and adolescents consumed any diet drink on a given day during 2009‒2010. Similarly, 27.9% of non-Hispanic white adults consumed any diet drink on a given day compared with 10.1% of non-Hispanic black and 14.1% of Hispanic adults (Figure 3).
Figure 3. Percentage of population aged 2 years and over who consumed diet drinks on a given day, by race and ethnicity: United States, 2009‒2010
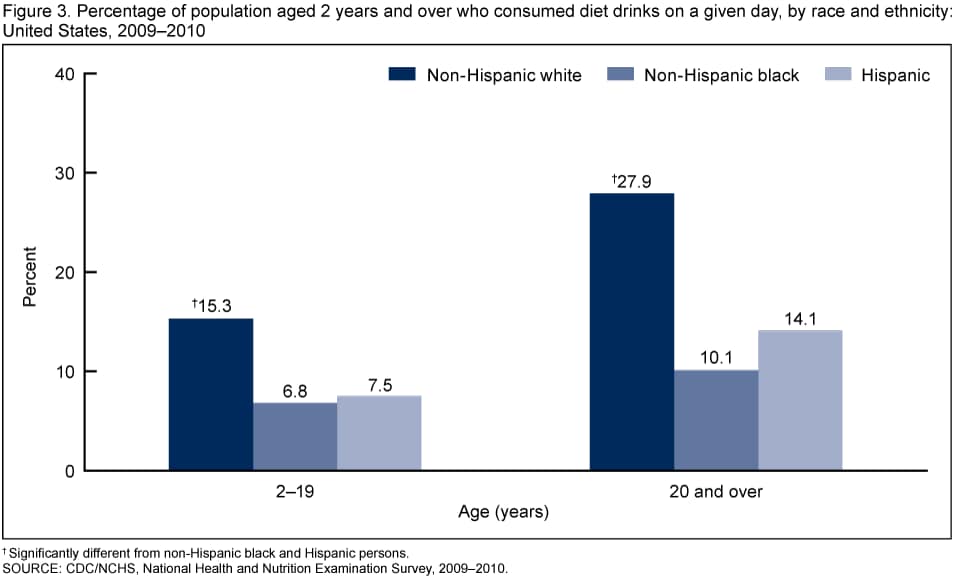
† Significantly different from non-Hispanic black and Hispanic persons.
SOURCE: CDC/NCHS, National Health and Nutrition Examination Survey, 2009‒2010.
Were income differences found in the percentage of diet drink consumers?
The percentage of higher-income persons who consumed diet drinks on a given day was greater than that of lower-income persons. A total of 18.3% of children and adolescents living in households with income at or above 350% of the poverty line consumed diet drinks, compared with 11.5% of those living between 130% and 350% of the poverty line, and 8.0% of those living below 130% of the poverty line. A similar pattern was observed for adults: Although 32.6% of adults living at or above 350% of the poverty line consumed diet drinks, only 20.1% of those living between 130% and 350% of the poverty line, and 12.2% of those living below 130% of the poverty line, consumed diet drinks (Figure 4).
Figure 4. Percentage of population aged 2 years and over who consumed diet drinks on a given day, by poverty income ratio: United States, 2009‒2010
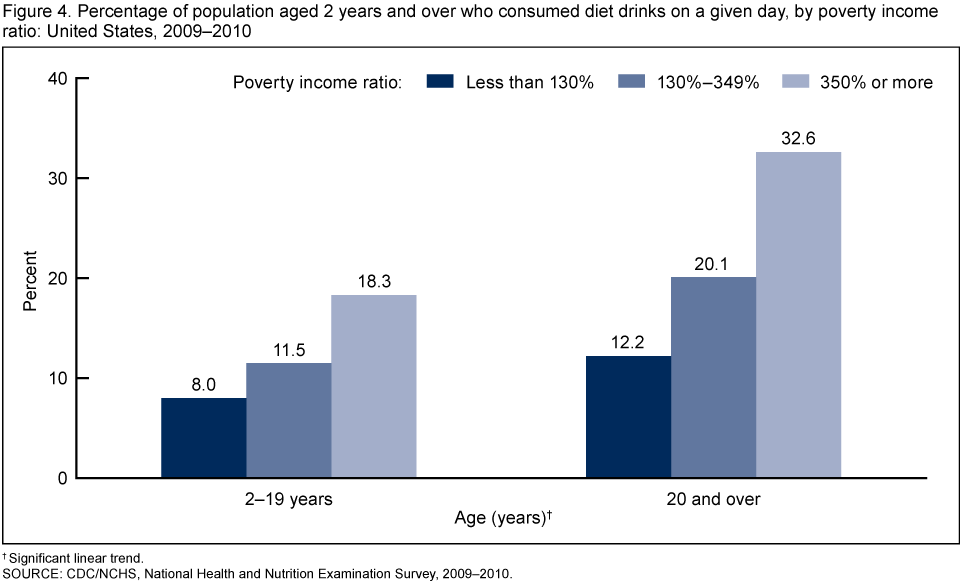
† Significant linear trend.
SOURCE: CDC/NCHS, National Health and Nutrition Examination Survey, 2009‒2010.
Did the percentage of diet drink consumers increase between 1999 and 2010?
A linear increase was observed in the percentage of females and males who consumed diet drinks on a given day over the 12 years studied (Figure 5). From 1999‒2000 through 2009‒2010, the percentage consuming diet drinks increased from 17.8% to 21.2% for females, and from 13.9% to 19.0% for males.
Figure 5. Trends in percentage of population aged 2 years and over who consumed diet drinks on a given day, by sex: United States, 1999‒2010

†Significant linear trend.
SOURCE: CDC/NCHS, National Health and Nutrition Examination Survey, 1999‒2010.
Summary
About one-fifth of the U.S. population consumed diet drinks on a given day in 2009‒2010, and 11% consumed 16 fl oz of diet drinks or more. Overall, the percentage consuming diet drinks was higher among females compared with males. Diet drink consumption differed by age, race and ethnicity, and income. For example, the percentage of non-Hispanic white children and adults who consumed diet drinks was higher than those for non-Hispanic black and Hispanic children and adults, and the percentage of higher-income persons who consumed diet drinks was higher than that for lower-income persons.
The percentage of females and males who consumed diet drinks increased between 1999 and 2010 and was mirrored by a decrease in consumption of added sugar calories in regular soda over a similar time period (3). These results suggest that sugar drinks may have been replaced with diet drinks during that time. Although substituting sugar drinks with diet drinks may promote weight loss in the short term (4), it is unclear if long-term consumption leads to weight loss, weight maintenance, or even weight gain (5).
Definitions
Fluid ounce (fl oz): A unit of volume equal to 29.6 mL. The reference amount customarily consumed (RACC) for beverages is 240 mL, or about 8 fl oz (6). Consumption of diet drinks was calculated as mean fluid ounces consumed per person on a given day, specifically the 24-hour period prior to the dietary recall interview (midnight to midnight).
Diet drinks: Include calorie-free and low-calorie versions of sodas, fruit drinks, energy drinks, sports drinks, and carbonated water, consistent with definitions reported by the National Cancer Institute (7) and U.S. Food and Drug Administration food labeling guidelines (6). Diet drinks do not include 100% fruit juice or unsweetened teas or coffees.
Consumers of diet drinks: Persons who reported consumption of more than 0 fluid ounces of any diet drink as defined above on a given day, specifically the 24-hour period prior to the dietary recall interview (midnight to midnight).
Sugar drinks: Include sodas, fruit drinks, energy drinks, sports drinks, and sweetened bottled waters, consistent with definitions reported by the National Cancer Institute (7). Sugar drinks do not include 100% fruit juice, sweetened teas, or flavored milks.
Poverty income ratio (PIR): An index representing the ratio of family income to poverty. The U.S. Department of Health and Human Services’ (HHS) poverty guidelines were used as the poverty measure to calculate this index (8). Income eligibility for participation in the Supplemental Nutrition Assistance Program (formerly known as the Food Stamp Program) is 130% of the poverty level (less than 130% PIR) (9). This cut-point was used in analyses for this report.
Data source and methods
National Health and Nutrition Examination Survey (NHANES) data were used for these analyses. NHANES is a survey conducted by the Centers for Disease Control and Prevention’s (CDC) National Center for Health Statistics (NCHS) to assess the health and nutritional status of the civilian noninstitutionalized U.S. population. The survey combines both an in-home interview and a standardized physical examination at a mobile examination center. The data for this report were collected from an in-person 24-hour dietary recall interview in the mobile examination center. Dietary recalls cover intake for any given day, specifically the 24-hour period prior to the dietary recall interview (midnight to midnight). In 2009‒2010, the response rate to the examination portion of the survey was 77.3 (10).
The sample design includes oversampling to obtain reliable estimates of health and nutritional measures for population subgroups. In 2009‒2010, non-Hispanic black and Hispanic persons were oversampled. Data were analyzed using sample weights to account for differential probabilities of selection, nonresponse, and noncoverage. The standard errors of the percentages were estimated using Taylor series linearization, a method that incorporates the sample weights and sample design.
Mean estimates for adults were age adjusted to the 2000 U.S. standard population using three age groups: 20–39, 40–59, and 60 and over. Differences between groups were evaluated using a t statistic at the p < 0.05 significance level with the appropriate degrees of freedom. All differences reported are statistically significant. To test for linear trends between age groups and income groups, the null hypothesis of nonlinear trend was examined using orthogonal polynomials. Statistical analyses were conducted using SAS System for Windows version 9.2 (SAS Institute Inc., Cary, N.C.) and SUDAAN version 10.0 (RTI International, Research Triangle Park, N.C.).
About the authors
Tala H.I. Fakhouri is with the Epidemic Intelligence Service, Office of Surveillance, Epidemiology, and Laboratory Services, and the Analysis Branch, Division of Health and Nutrition Examination Surveys (DHANES), NCHS, CDC. Brian K. Kit and Cynthia L. Ogden are with NCHS’ DHANES.
References
- U.S. Department of Agriculture, U.S. Department of Health and Human Services. Dietary guidelines for Americans, 2010. 7th ed. Washington, DC: U.S. Government Printing Office. 2010.
- Ogden CL, Kit BK, Carroll MD, Park S. Consumption of sugar drinks in the United States, 2005–2008. NCHS data brief, no 71. Hyattsville, MD: National Center for Health Statistics. 2011.
- Welsh JA, Sharma AJ, Grellinger L, Vos MB. Consumption of added sugars is decreasing in the United States. Am J Clin Nutr 94(3):726–34. 2011.
- Tate DF, Turner-McGrievy G, Lyons E, Stevens J, Erickson K, Polzien K, et al. Replacing caloric beverages with water or diet beverages for weight loss in adults: Main results of the Choose Healthy Options Consciously Everyday (CHOICE) randomized clinical trial. Am J Clin Nutr 95(3):555–63. 2012.
- Bellisle F, Drewnowski A. Intense sweeteners, energy intake and the control of body weight. Eur J Clin Nutr 61(6):691–700. 2007.
- U.S. Food and Drug Administration. Guidance for industry: A food labeling guide. Center for Food Safety and Applied Nutrition, Office of Nutrition, Labeling, and Dietary Supplements. 2009.
- U.S. National Institutes of Health, National Cancer Institute. Sources of beverage intakes among the US population, 2005–06external icon. Applied Research Program, Risk Factor Monitoring and Methods Branch. 2010. [Accessed September 8, 2011].
- U.S. Department of Health and Human Services, Assistant Secretary for Planning and Evaluation. Poverty guidelines, research, and measurementexternal icon. 2011. [Accessed July 25, 2012].
- U.S. Department of Agriculture, Food and Nutrition Service. Supplemental nutrition assistance program, eligibilityexternal icon. 2012. [Accessed July 25, 2012].
- National Health and Nutrition Examination Survey. NHANES response rates and CPS totals, 2009–2010 response rates. [Accessed July 25, 2012].
Suggested citation
Fakhouri THI, Kit BK, Ogden CL. Consumption of diet drinks in the United States, 2009‒2010. NCHS data brief, no 109. Hyattsville, MD: National Center for Health Statistics. 2012.
Copyright information
All material appearing in this report is in the public domain and may be reproduced or copied without permission; citation as to source, however, is appreciated.
National Center for Health Statistics
Edward J. Sondik, Ph.D., Director
Jennifer H. Madans, Ph.D., Associate Director for Science
Division of Health Care Statistics
Clifford L. Johnson, M.S.P.H., Director