Hospitalization for Congestive Heart Failure: United States, 2000–2010
- Key findings
- Did the number and age distribution of patients hospitalized for CHF change from 2000 to 2010?
- Did the rate of hospitalization for CHF change from 2000 to 2010?
- Table. Rates for congestive heart failure hospitalization, by age in years: United States, 2000 and 2010
- Did trends in congestive heart failure hospitalization rates differ for males and females from 2000 to 2010?
- Were the changes in the rate of congestive heart failure hospitalization the same for males and females under and over age 65?
- Was there a change in discharge status of congestive heart failure patients from 2000 to 2010?
- Summary
- Definitions
- Data source and methods
- About the authors
- References
- Suggested citation
NCHS Data Brief No. 108, October 2012
PDF Versionpdf icon (657 KB)
Margaret Jean Hall, Ph.D.; Shaleah Levant, M.P.H.; and Carol J. DeFrances, Ph.D.
Key findings
Data from the National Hospital Discharge Survey, 2000–2010
- There were 1 million hospitalizations for congestive heart failure (CHF) in 2000 and in 2010.
- Most CHF hospitalizations were for those aged 65 and over, but the proportion under age 65 increased significantly from 23% in 2000 to 29% in 2010.
- The overall rate of CHF hospitalization per 10,000 population did not change significantly from 2000 to 2010 (35.5 compared with 32.8), but the trends were different for those under and over age 65.
- From 2000 to 2010, the rate of CHF hospitalization for males under age 65 increased significantly while the rate for females aged 65 and over decreased significantly.
- In both 2000 and in 2010, a greater share of inpatients under age 65, compared with those aged 65 and over, were discharged to their homes.
Congestive heart failure (CHF) is a serious medical condition in which the heart cannot pump enough blood to meet the body’s needs. CHF is often caused by hypertension, diabetes, or coronary heart disease. It is estimated that 5.8 million people in the United States have CHF (1). CHF is one of the most common reasons those aged 65 and over are hospitalized (2). This report presents National Hospital Discharge Survey (NHDS) data from 2000 through 2010 on hospitalizations for CHF.
Keywords: inpatient care, health care utilization, National Hospital Discharge Survey
Did the number and age distribution of patients hospitalized for CHF change from 2000 to 2010?
- In 2000 and in 2010, there were an estimated 1 million hospitalizations for CHF. While most of these hospitalizations were for those aged 65 and over, the share of CHF hospitalizations for those under age 65 increased from 23% to 29% over this time period (Figure 1).
Figure 1. Percent distribution of hospitalizations for congestive heart failure, by age in years: United States, 2000 and 2010
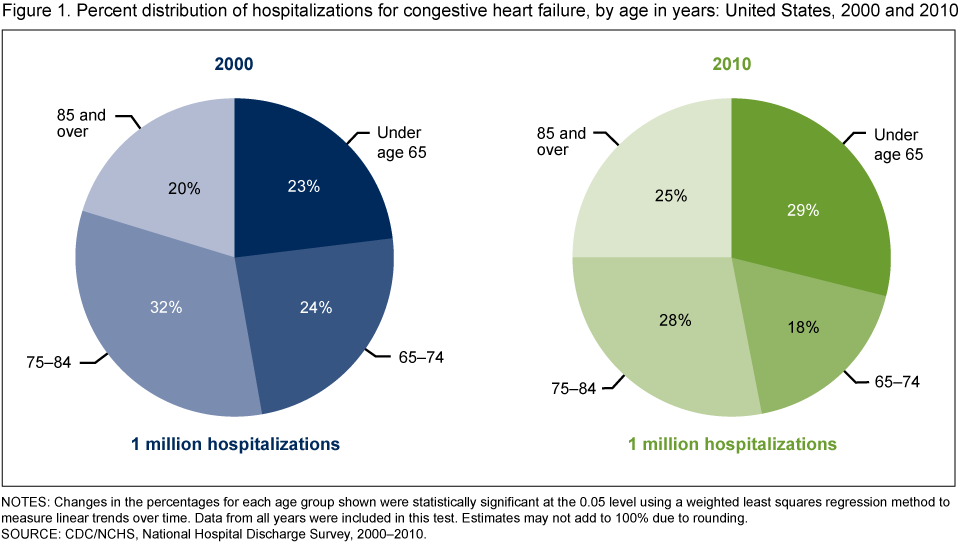
NOTES: Changes in the percentages for each age group shown were statistically significant at the 0.05 level using a weighted least squares regression method to measure linear trends over time. Data from all years were included in this test. Estimates may not add to 100% due to rounding.
SOURCE: CDC/NCHS, National Hospital Discharge Survey, 2000–2010.
- The share of CHF hospitalizations also increased for those aged 85 and over from 2000 to 2010; the percentage of those aged 65–74 and 75–84 decreased.
Did the rate of hospitalization for CHF change from 2000 to 2010?
- The overall rate of CHF hospitalization per 10,000 population did not change significantly from 2000 to 2010 (35.5 compared with 32.8), but the trends were different for those under age 65 compared with those aged 65 and over (see Table).
- For those under age 65, the rate of CHF hospitalization was low in both 2000 and 2010 compared with older patients, but it increased by 15% over this time period—from 9.4 to 10.8 per 10,000 population.
- For those aged 65 and over, the rate of CHF hospitalization was much higher than the rate for those under age 65 but the rate decreased by 19% from 2000 to 2010—from 218.6 to 177.7 per 10,000 population.
- The rate of CHF hospitalization per 10,000 population increased with advancing age in both 2000 and 2010.
Table. Rates for congestive heart failure hospitalization, by age in years: United States, 2000 and 2010
| 2000 | 2010 | |
|---|---|---|
| Rate per 10,000 population | ||
| Total | 35.5 | 32.8 |
| Under age 65† | 9.4 | 10.8 |
| 65 and over† | 218.6 | 177.7 |
| 65–74† | 130.3 | 85.7 |
| 75–84 | 260.2 | 214.6 |
| 85 and over† | 475.9 | 430.7 |
† Change from 2000 to 2010 was statistically significant at the 0.05 level using a weighted least squares regression method, including all years of data, to measure linear trends over time.
SOURCE: CDC/NCHS, National Hospital Discharge Survey, 2000–2010.
Did trends in congestive heart failure hospitalization rates differ for males and females from 2000 to 2010?
- In 2000, the rate of CHF hospitalization among females was one-third higher than the rate among males (40.5 compared with 30.4 per 10,000 population), but male and female rates converged over time, and by 2010 the male and female rates were similar (32.5 and 33.0 per 10,000 population, respectively) (Figure 2).
- In 2000, approximately 42% of CHF hospitalizations were for males, compared with 58% for females, but by 2010 there were equal proportions of males and females (data not shown).
Figure 2. Congestive heart failure hospitalization rates for males and females: United States, 2000–2010
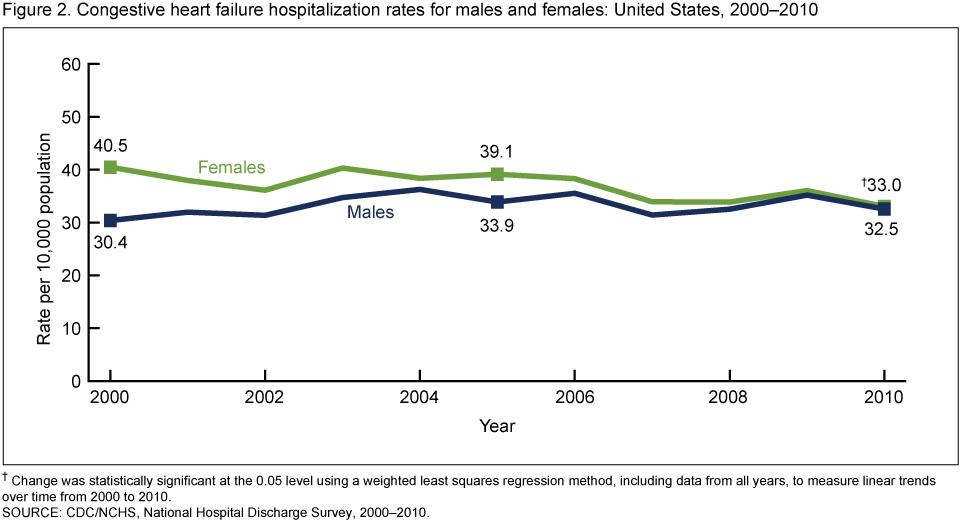
† Change was statistically significant at the 0.05 level using a weighted least squares regression method, including data from all years, to measure linear trends over time from 2000 to 2010.
SOURCE: CDC/NCHS, National Hospital Discharge Survey, 2000–2010.
Were the changes in the rate of congestive heart failure hospitalization the same for males and females under and over age 65?
- The CHF hospitalization rate for males under age 65 increased by 21% from 2000 to 2010, but rates did not change significantly for males aged 65–74, 75–84, or 85 and over (Figure 3).
- The CHF hospitalization rate for females under age 65 did not change significantly from 2000 to 2010; however, rates for females decreased by 44% for those aged 65–74, 27% for those aged 75–84, and 17% for those aged 85 and over.
Figure 3. Percent change in congestive heart failure hospitalization rates, by sex and age: United States, 2000 to 2010
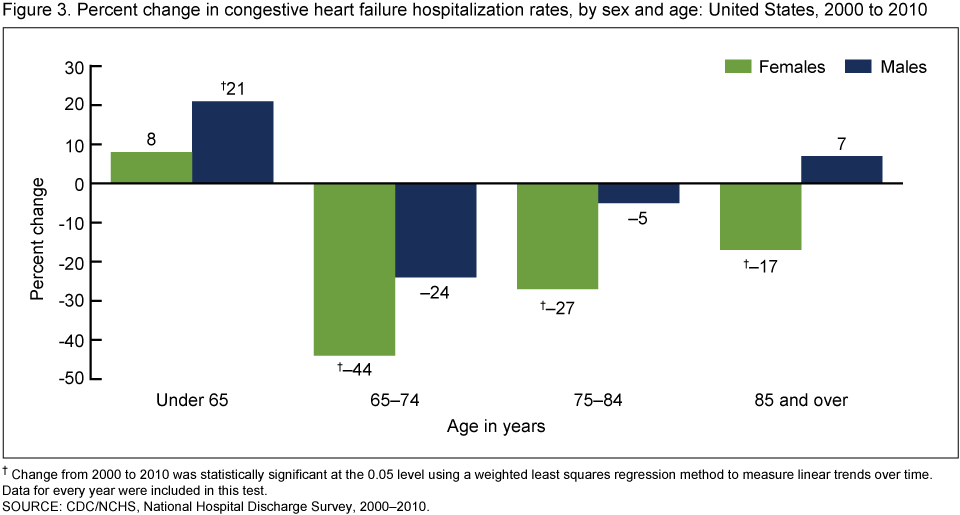
† Change from 2000 to 2010 was statistically significant at the 0.05 level using a weighted least squares regression method to measure linear trends over time. Data for every year were included in this test.
SOURCE: CDC/NCHS, National Hospital Discharge Survey, 2000–2010.
Was there a change in discharge status of congestive heart failure patients from 2000 to 2010?
- The discharge dispositions for those under age 65 hospitalized for CHF were similar in 2000 and 2010 (Figure 4).
- In both 2000 and 2010, those under age 65 who were hospitalized for CHF were more likely to have a routine discharge and less likely to be discharged to a long-term care institution, compared with the 65 and over age group.
- Between 2000 and 2010, those aged 65 and over who were hospitalized for CHF experienced a significant increase in the proportion discharged to long-term care institutions, but a significant decrease in the proportion who died in the hospital.
Figure 4. Discharge disposition of inpatients hospitalized for congestive heart failure, by age: United States, 2000 and 2010
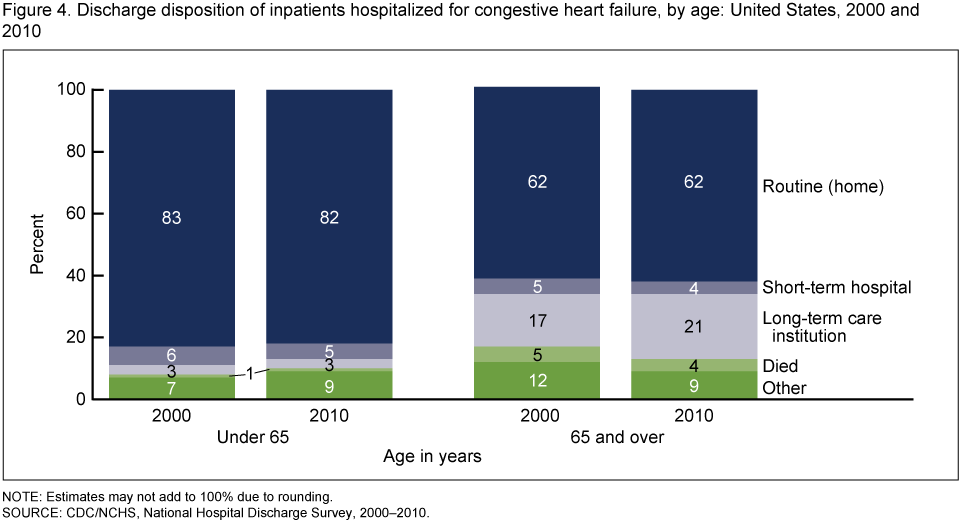
NOTE: Estimates may not add to 100% due to rounding.
SOURCE: CDC/NCHS, National Hospital Discharge Survey, 2000–2010.
Summary
Researchers have long considered CHF to be an ambulatory care sensitive condition (ACSC). Hospitalizations of patients with ACSCs could often be avoided if these patients received timely and appropriate medical care in outpatient settings (3–6). Numerous disease management, coordination of care, and other programs have been in place to decrease preventable or avoidable hospitalizations by improving access to care and the quality of this care (7–9). One measure of the success of these efforts would be if CHF hospitalization rates declined from 2000 to 2010.
This study, using nationally representative data, found that the overall CHF hospitalization rate did not change significantly from 2000 to 2010, and in both years there were approximately 1 million CHF hospitalizations. Although the number and rate of hospitalizations for CHF were the same in 2000 and in 2010, the proportion of hospitalizations for those under age 65 and for males increased. These increases were a result of the decline in rates among females aged 65 and over and the increase in rates among males under age 65.
Males’ higher health risk factors and lower utilization of health care services, including preventive care (10), could mean that conditions known to cause CHF—such as diabetes, hypertension, and coronary artery disease (1)—were more often left undiagnosed and untreated for males compared with females. These conditions may have then progressed to the point where the CHF was serious enough to warrant hospitalization, even to a small but increasing extent, before age 65.
Definitions
Congestive heart failure: A serious medical condition in which the heart cannot pump enough blood to meet the body’s needs. This inability may result in fluid retention, which causes swelling, for example, in the legs, feet, or abdomen (1).
Hospitalization for congestive heart failure: A hospitalization with CHF as the principal or first-listed diagnosis. That is, CHF is the main cause or reason for the hospitalization and is recorded using the International Classification of Diseases, 9th Revision, Clinical Modification (ICD–9–CM) codes 428.0 and 428.2–428.4 (11).
Rate: The number of hospitalizations per unit of population (i.e., per 10,000 population). Using rates removes the influence of different population sizes (e.g., for males and females in 1 year or for different population sizes over multiple years) so that data can be compared across these groups. For 2000–2010, rates were calculated using U.S. Census Bureau 2000-based postcensal civilian population estimates.
Data source and methods
Data for this report are from NHDS, a national probability sample survey of discharges from nonfederal, short-stay hospitals or general hospitals in the United States conducted annually by the Centers for Disease Control and Prevention’s (CDC) National Center for Health Statistics (NCHS), Division of Health Care Statistics. NHDS uses a modified three-stage design. Units selected at the first stage consist of either hospitals or geographic areas, such as counties, groups of counties, or metropolitan statistical areas. Within a sampled geographic area, hospitals are selected. Finally at the last stage, systematic random sampling is used to select discharges within sampled hospitals. Survey data on hospital discharges were obtained from the hospitals’ administrative data. Note that if an individual is admitted to the hospital multiple times during the survey year, that individual will be counted more than once in NHDS.
Because of the complex multistage design of NHDS, the survey data must be inflated or weighted to produce national estimates. Estimates of inpatient care presented in this report exclude newborns. More details about the design of NHDS have been published elsewhere (2).
A weighted least squares regression method (12), based on all 11 years of NHDS data from 2000 to 2010, was used to test for linear trends in the table and all figures. This is the case even if the data shown are for 2000 and 2010. A p value of < 0.05 indicated statistical significance.
Differences among subgroups were evaluated with two-tailed t tests using p < 0.05 as the level of significance. Terms that express differences such as “higher,” “lower,” “largest,” “smallest,” “leading,” “increased,” or “decreased,” were used only when the differences were statistically significant. When a comparison is described as “similar,” it means no statistically significant difference was found. All comparisons reported in the text were statistically significant unless otherwise indicated. Data analyses were performed using the statistical packages SAS version 9.2 (SAS Institute, Cary, N.C.) and SUDAAN version 10.0 (RTI International, Research Triangle Park, N.C.).
About the authors
Margaret Jean Hall, Shaleah Levant, and Carol J. DeFrances are with CDC’s NCHS, Division of Health Care Statistics.
References
- National Heart Lung and Blood Institute. People Science Health. What is heart failureexternal icon? [Accessed February 2012].
- Hall MJ, DeFrances CJ, Williams SN, et al. National Hospital Discharge Survey: 2007 summary pdf icon[PDF – 403 KB]. National health statistics reports; no 29. Hyattsville, MD: National Center for Health Statistics. 2010.
- Bindman AB, Grumbach K, Osmond D, Komaromy M, Vranizan K, Lurie N, et al. Preventable hospitalizations and access to health care. JAMA 274(4):305–11. 1995.
- Billings J, Anderson GM, Newman LS. Recent findings on preventable hospitalizations. Health Aff 15(3):239–49. 1996.
- Blustein J, Hanson K, Shea S. Preventable hospitalizations and socioeconomic status. Health Aff 17(2):177–89. 1998.
- Culler SD, Parchman ML, Przybylski M. Factors related to potentially preventable hospitalizations among the elderly. Med Care 36(6):804–17. 1998.
- Mattke S, Seid M, Ma S. Evidence for the effect of disease management: Is $1 billion a year a good investment? Am J Manag Care 13(12):670–6. 2007.
- Lipson DJ, Simon S. Trends in health care quality. Quality’s new frontier: Reducing hospitalizations and improving transitions in long-term care. Issue Brief; no 7. Mathematica Policy Research, Inc. 2010.
- McAllister FA, Stewart S, Ferrua S, McMurray JJ. Multidisciplinary strategies for the management of heart failure patients at high risk for admission: A systematic review of randomized trials. J Amer Coll Cardiol 44(4):810–9. 2004.
- Pinkhasov RM, Wong J, Kashanian ML, Lee M, Samadi DB, Pinkhasov MM, Shabsigh R. Are men shortchanged on health? Perspective on health care utilization and health risk behavior in men and women in the United States. Int J Clin Pract 64(4):475–87. 2010.
- Centers for Disease Control and Prevention and Centers for Medicare & Medicaid Services. International Classification of Diseases, Ninth Revision, Clinical Modification. 6th ed. DHHS Pub No. (PHS) 06–1260. 2006.
- Gillum BS, Graves EJ, Kozak LJ. Trends in hospital utilization: United States, 1988–92 pdf icon[PDF – 578 KB]. National Center for Health Statistics. Vital Health Stat 13(124). 1996.
Suggested citation
Hall MJ, Levant S, DeFrances CJ. Hospitalization for congestive heart failure: United States, 2000–2010. NCHS data brief, no 108. Hyattsville, MD: National Center for Health Statistics. 2012.
Copyright information
All material appearing in this report is in the public domain and may be reproduced or copied without permission; citation as to source, however, is appreciated.
National Center for Health Statistics
Edward J. Sondik, Ph.D., Director
Jennifer H. Madans, Ph.D., Associate Director for Science
Division of Health Care Statistics
Clarice Brown, M.S., Director