A Program for Early Release of selected estimates from the National Health Interview Survey
PDF versionpdf icon (1.2 MB)
The Early Release Program
Through its Early Release program, the Centers for Disease Control and Prevention’s (CDC) National Center for Health Statistics (NCHS) publishes selected estimates from the National Health Interview Survey (NHIS) on an expedited schedule. Early Release of Selected Estimates Based on Data from the National Health Interview Survey provides timely information on 15 key health indicators. A second report, Health Insurance Coverage: Early Release of Estimates from the National Health Interview Survey, provides detailed estimates of health insurance coverage, and a third report, Wireless Substitution: Early Release of Estimates from the National Health Interview Survey, looks at 13 key indicators by household telephone status and includes updated estimates of the size of the wireless-only and wireless-mostly population. These reports provide policymakers, researchers, public health practitioners, educators, journalists, and members of the public with access to the most current information on the health of the United States population.
The NHIS, a health survey conducted continuously by NCHS since 1957, is the primary source of information on the health of the civilian, noninstitutionalized population of the United States. Trained interviewers collect this information during an in-person household survey of about 87,500 individuals of all ages from approximately 35,000 households. Information collected on the NHIS includes health status, health conditions, health behaviors, health care access and utilization, health insurance coverage, demographics, and socioeconomic status.
Providing timely, relevant, and useful health information
Current
The Early Release (ER) program provides estimates of important health indicators 6 months after the collection of new NHIS data. This enables public health practitioners, researchers, and policymakers to make decisions that meet the changing health needs of the U.S. population based on the most up-to-date information. A defining characteristic of the ER program is that it provides estimates based on partial year and full-year data. For the report on key health indicators and the detailed health insurance report, ER estimates are updated four times a year, after the end of every 3 months of data collection. For the wireless substitution report, ER estimates are updated twice a year, after the end of every 6 months of data collection.
Responsive
ER health measures reflect issues of current public health concern, monitor the current health status of the U.S. population, and measure progress toward achieving national public health objectives. ER measures of wireless substitution monitor the rapid changes in household telephone service, which are a growing concern for public health researchers who collect data using telephones.
Informative
ER serves as a source of information for individuals who want to learn about conditions that affect the public’s health and about the effects of type of household telephone service on random-digit-dial public health surveys. The ER reports provide important information to users in many diverse fields: science, communications media, policy, education, and others.
Measures presented in each ER report on key health indicators
- Health insurance coverage1
- Usual place to go for medical care1
- Obtaining needed medical care
- Receipt of influenza vaccination1
- Receipt of pneumococcal vaccination1
- Obesity1
- Leisure-time physical activity1
- Current smoking1
- Alcohol consumption
- HIV testing
- General health status
- Personal care needs
- Serious psychological distress
- Diagnosed diabetes
- Asthma episodes and current asthma
For each of the 15 health measures, the following information is available:
- Graphs and tables showing trends from 1997 through the most recent available quarter of data
- Graphs and tables of the most current estimates by age group and sex and by race/ethnicity
- Highlights and key findings
Measures presented in each ER report on detailed estimates of health insurance coverage
- Lack of health insurance coverage
- at time of interview
- for at least part of the past year
- for more than a year
- Type of health insurance coverage
- public health plan coverage
- private health insurance coverage
- Noncoverage for selected sociodemographic measures
- High-deductible health plans, consumer-directed health plans, and flexible spending accounts
- Annual state-level estimates for large states
Selected highlights and graphs, detailed results, and data tables are presented for the health insurance measures in this report.
Measures presented in each ER report on wireless substitution
NCHS conducts both in-person and telephone surveys. Most major survey research organizations, including NCHS, do not include wireless telephone numbers when conducting random-digit-dial (RDD) telephone surveys. Therefore, the inability to reach households with only cell phones (or with no telephone service) has potential implications for health surveys and other surveys conducted using RDD telephone methods. The magnitude of bias for RDD health surveys depends on the size of the population that cannot by contacted by landline telephones and on the health differences between persons with and without landline telephones. As an in-person survey, NHIS covers households irrespective of their telephone usage and can thus provide the most up-to-date estimates available from the federal government concerning the size, demographic characteristics, and health of adults and children living in:
- Wireless-only households (households with at least one cell phone but without a landline telephone)
- Wireless-mostly households (households that receive all or almost all calls on cell phones, despite having a landline telephone)
- Phoneless households (households without wireless or landline service)
Examples from the ER report on key health indicators
Figure 1. Prevalence of current smoking among adults aged 18 years and over: United States, 1997–2007
 image icon
- The annual prevalence of current smoking among U.S. adults declined from 24.7% in 1997 to 19.7% in 2007.
Figure 2. Prevalence of current smoking among adults aged 18 years and over, by age group and sex: United States, 2007
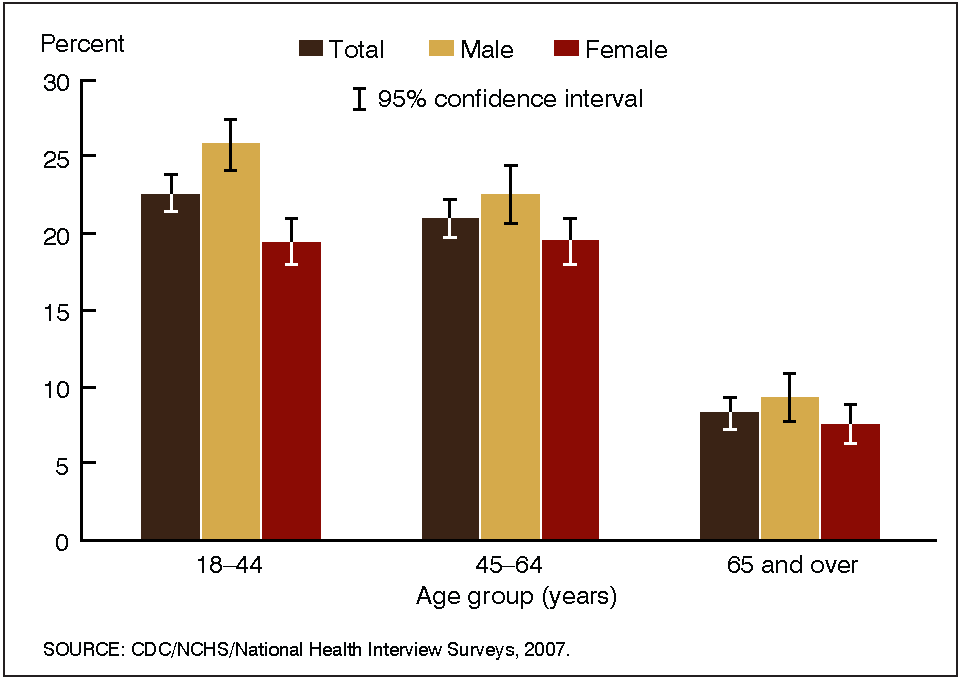 image icon
- For both sexes combined, the percentage of adults who were current smokers was lower among adults aged 65 years and over (8.3%) than among adults aged 18–44 years (22.6%) and 45–64 years (21.0%). This pattern in current smoking by age group was seen in both men and women.
Examples from the ER report on detailed estimates of health insurance coverage
Figure 3. Percentage of persons without health insurance, by three measurements and age group; and percentage of persons with health insurance, by coverage type and age group: United States, 2007
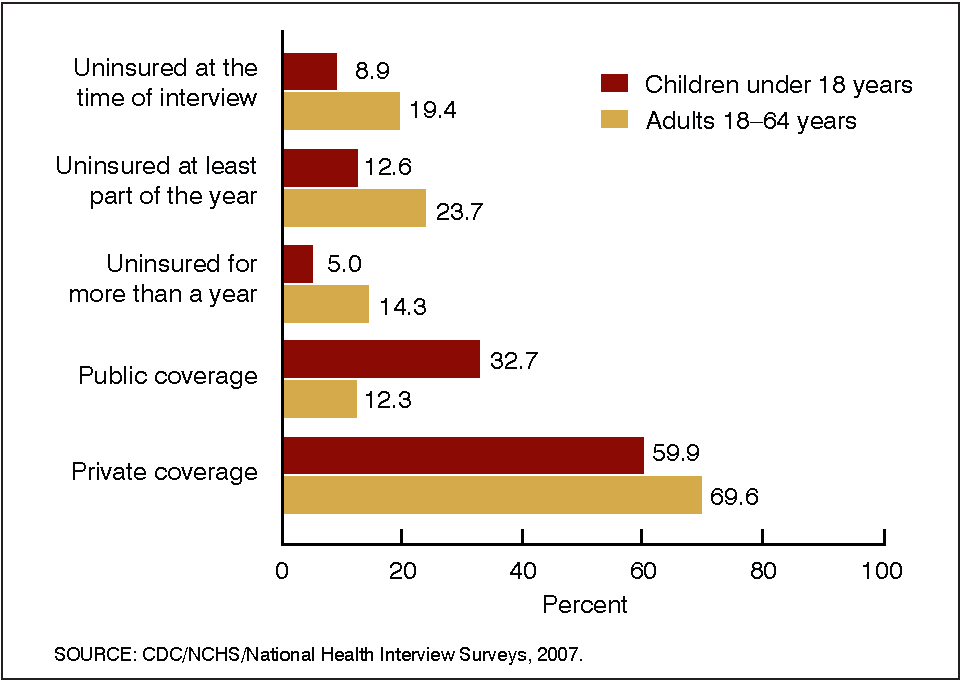 image icon
- In 2007, children were less likely than adults aged 18–64 years to be uninsured for more than a year.
- 69.6% of adults under age 65 years were covered by a private plan, compared with 59.9% of children under age 18 years.
Figure 4. Percentage with health insurance, by coverage type; and percentage uninsured at time of interview, for near poor children under 18 years of age: United States, 1997–2007

- For near poor children under age 18 years, the estimates of public coverage increased since 1998.
Examples from the ER report on wireless substitution
Figure 5. Percentage of adults and percentage of children living in households with only wireless telephone service or no telephone service: United States, 2004–2007
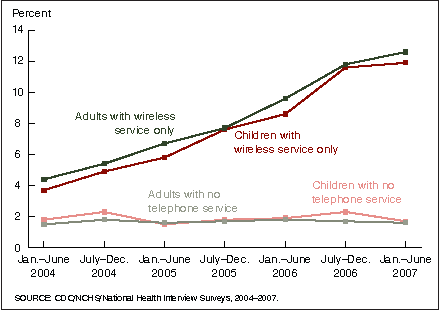
- The percentage of adults and the percentage of children living in wireless-only households have been increasing.
- The percentage of adults and the percentage of children living without any telephone service have remained relatively unchanged.
Figure 6. Prevalence rates for selected measures of health behaviors and health care access for adults 18 years of age and over, by type of household telephone service: United States, July–December 2007
| Household telephone service | ||
|---|---|---|
| Landline household | Wireless-only household | |
| Percent | ||
| Five or more alcoholic drinks in 1 day at least once in past year | 17.7 | 37.3 |
| Current smoker | 18.0 | 30.6 |
| Currently without health insurance | 13.7 | 28.7 |
- The prevalence of binge drinking among wireless-only adults was twice as high as the prevalence among adults living in landline households.
- Wireless-only adults were also more likely to be current smokers and to be uninsured.
Where to find Early Release
ER reports are produced and posted on the Internet approximately every 3 months, in March, June, September, and December (key health indicator report and detailed health insurance report) and every 6 months, in May and December (wireless substitution report).
For the most recent ER and previous ER reports, or for more information about the National Health Interview Survey, please visit the NHIS website
Early Release Program
Division of Health Interview Statistics
National Center for Health Statistics
Centers for Disease Control and Prevention
3311 Toledo Road
Hyattsville, MD 20782
1(800) 232–4636
1 A leading health indicator of the Department of Health and Human Services’ Healthy People 2010 program.