Key Graphics from 2012 U.S. TB Surveillance Data
Images and graphics highlighting major findings of the report are available for download. These high-resolution, public domain images are ready to print in your publication.
These images are in the public domain and are thus free of any copyright restrictions. As a matter of courtesy, we request that the content provider be credited and notified of any public or private usage of an image.
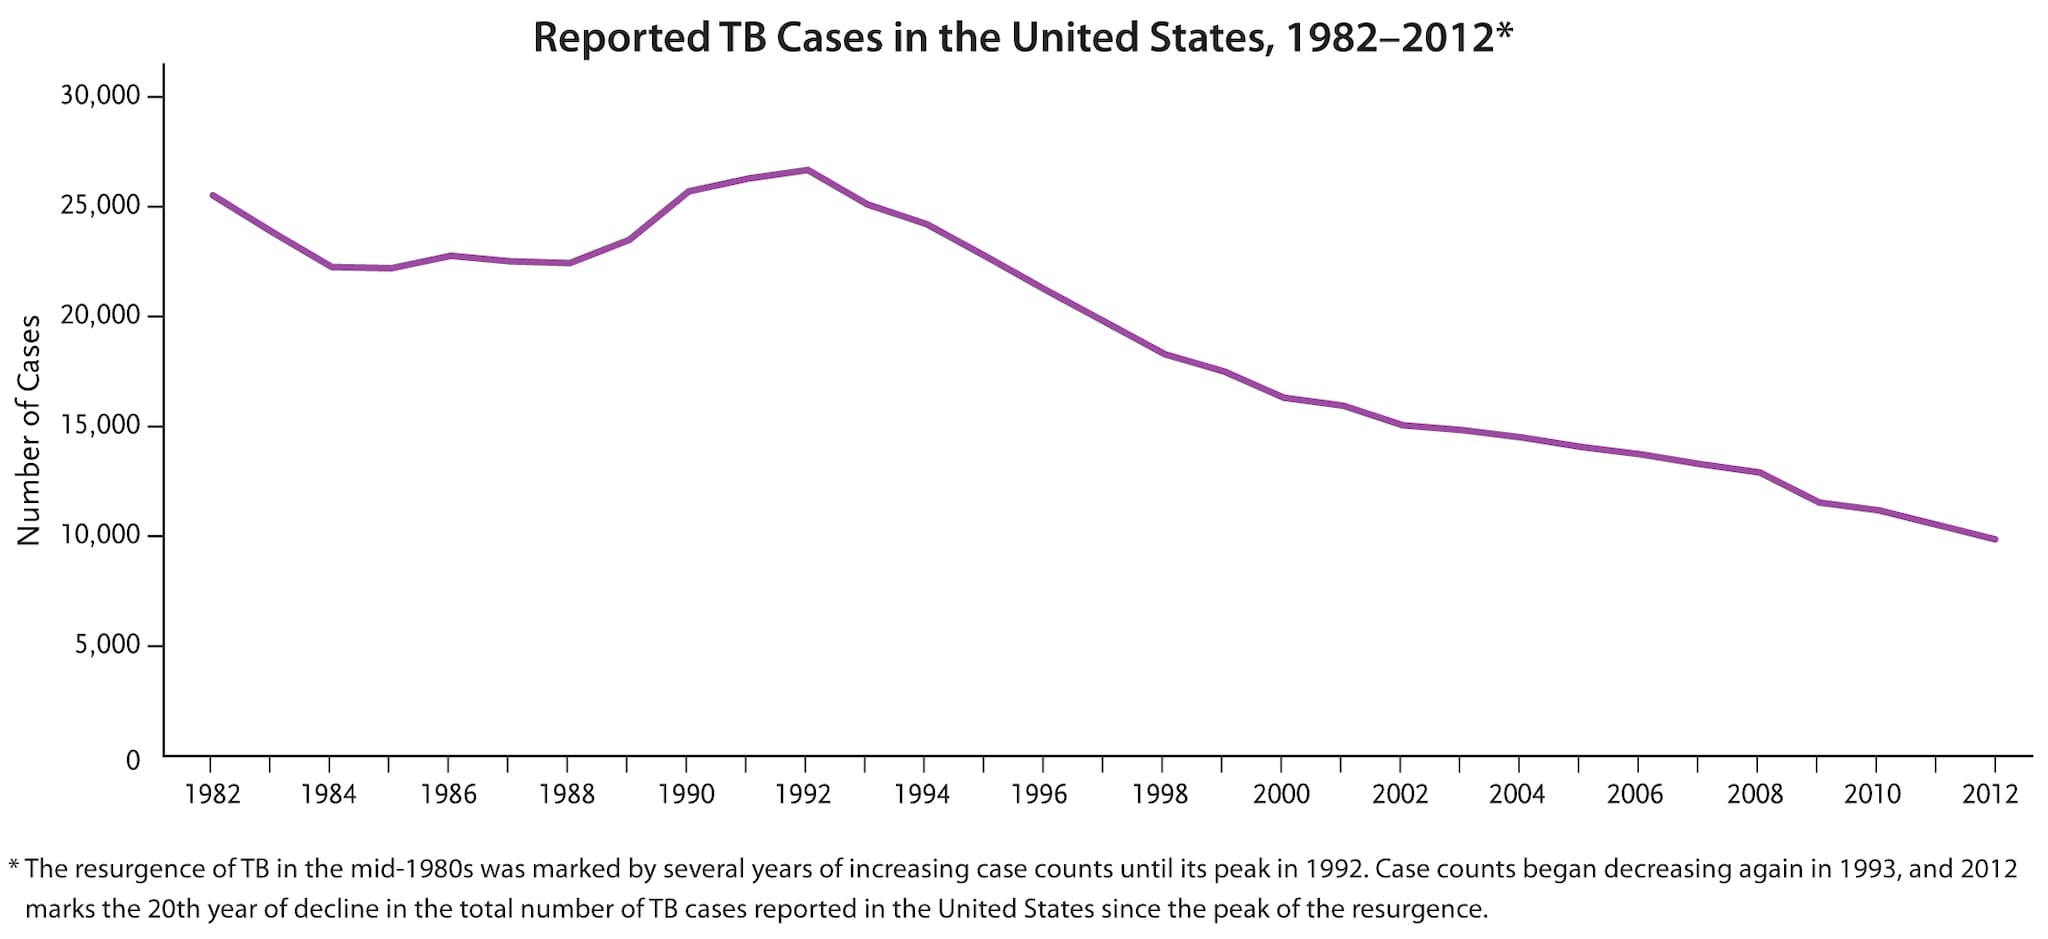

The resurgence of TB in the mid-1980s was marked by several years of increasing case counts until its peak in 1992. Case counts began decreasing again in 1993, and 2012 marks the 20th year of decline in the total number of TB cases reported in the United States since the peak of the resurgence.

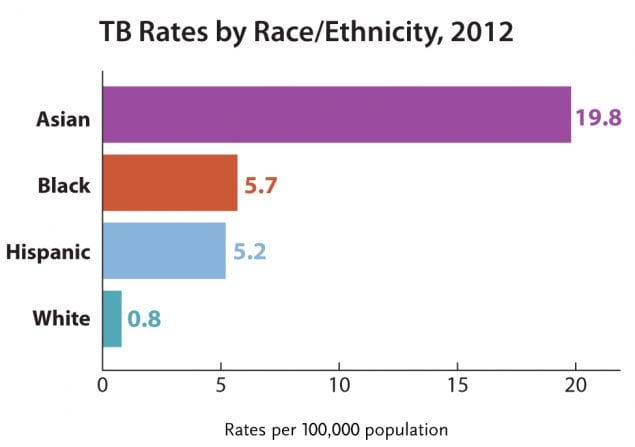
Although TB rates declined among all racial/ethnic groups, TB rates among racial/ethnic minorities are much higher than those of whites. Rates for Asians (19.8/100,000), blacks (5.7), and Hispanics (5.2) were 25, seven, and seven times higher than among whites (0.8), respectively.
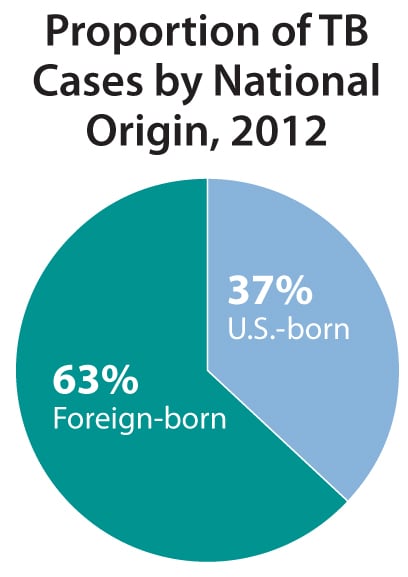
Despite declines in the rates of TB among both foreign- and U.S.-born individuals, the TB rate among foreign-born persons was 12 times higher than among U.S.-born persons.