30th Commemoration of HIV/AIDS
Current picture of the U.S. HIV epidemic
This page offers a look at the current state of HIV in the U.S., using two important pieces of data: numbers of new HIV infections per year (also called HIV incidence) and the number of people living with HIV at a given point in time (also called HIV prevalence). (The most current year for which both of these data sets are available is 2006. For more information on each, please see our fact sheet outlining the 2006 HIV incidence estimatepdf icon and our fact sheet outlining the 2006 HIV prevalence estimatepdf icon.)
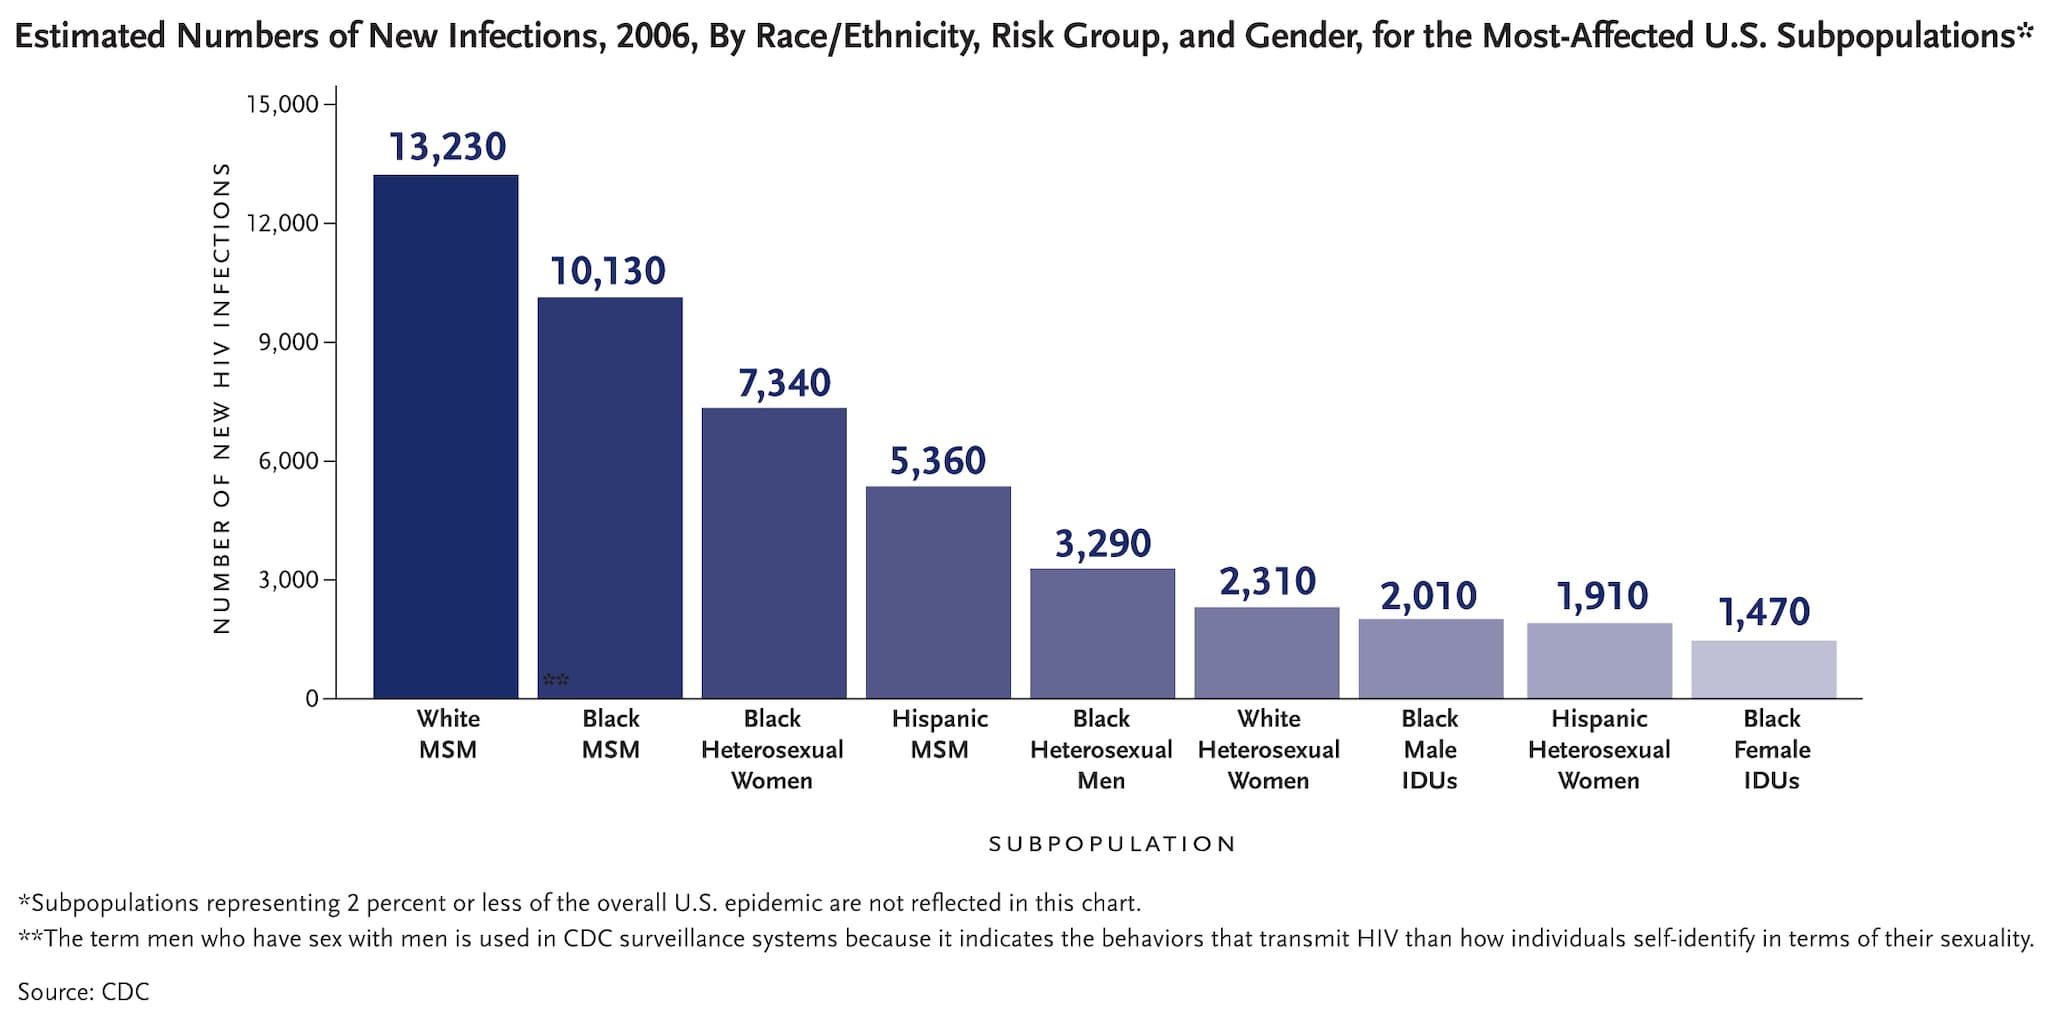
In the U.S. in 2006, gay and bisexual men of all races and black heterosexuals accounted for the greatest number of new infections.
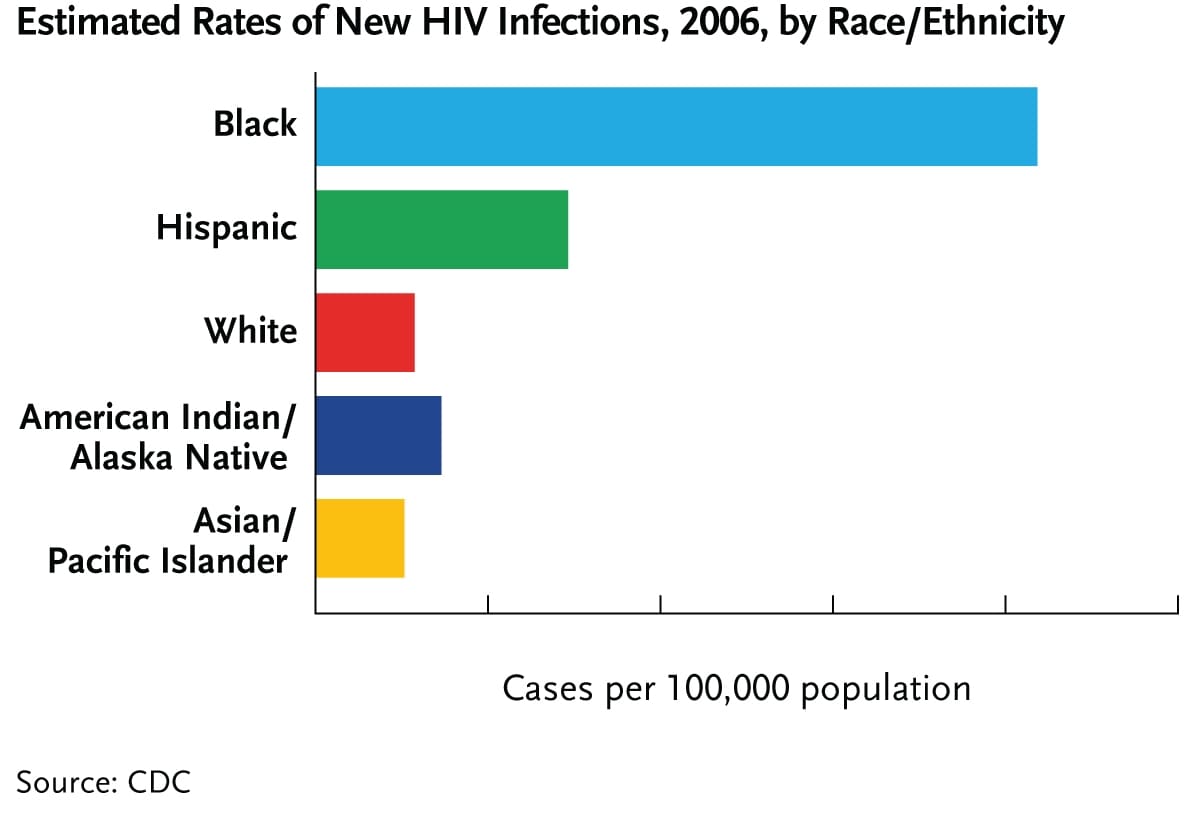
In the U.S. in 2006, the rate of new HIV infections among non-Hispanic blacks was seven times as high as that among whites (83.7 versus 11.5 new infections per 100,000 population) and, the rate of new HIV infections among Hispanics in 2006 was three times as high as that among whites (29.3 versus 11.5 per 100,000 population).
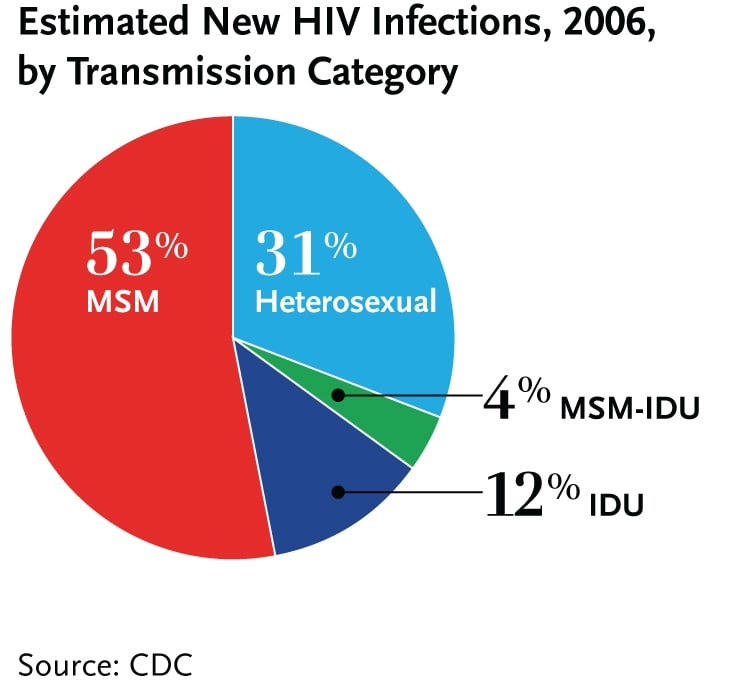
In the U.S. in 2006, men who have sex with men accounted for 53 percent of estimated new HIV infections, followed by heterosexuals (31%) and IDUs (12%).
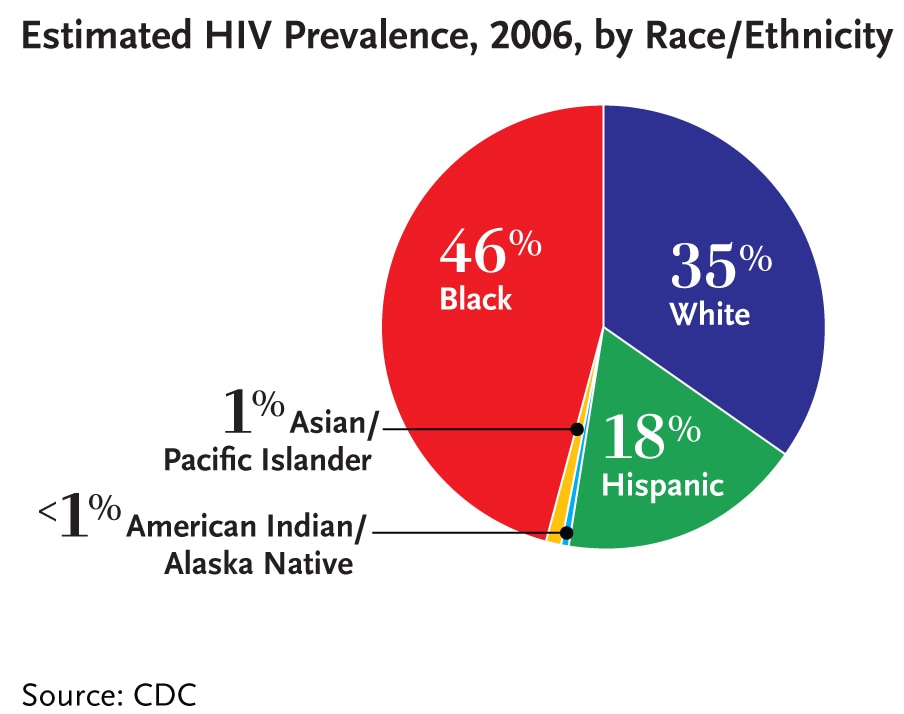
In the U.S. in 2006, blacks represented nearly half of all people living with HIV (46%, or 510,100 total persons). Hispanics accounted for 18 percent of people living with HIV (194,000 total persons). Whites made up more than one-third of all people living with HIV (35%, or 382,600 total persons). Asian/Pacific Islanders made up approximately 1 percent of all persons living with HIV, while American Indian/Alaska Natives made up less than 1 percent.
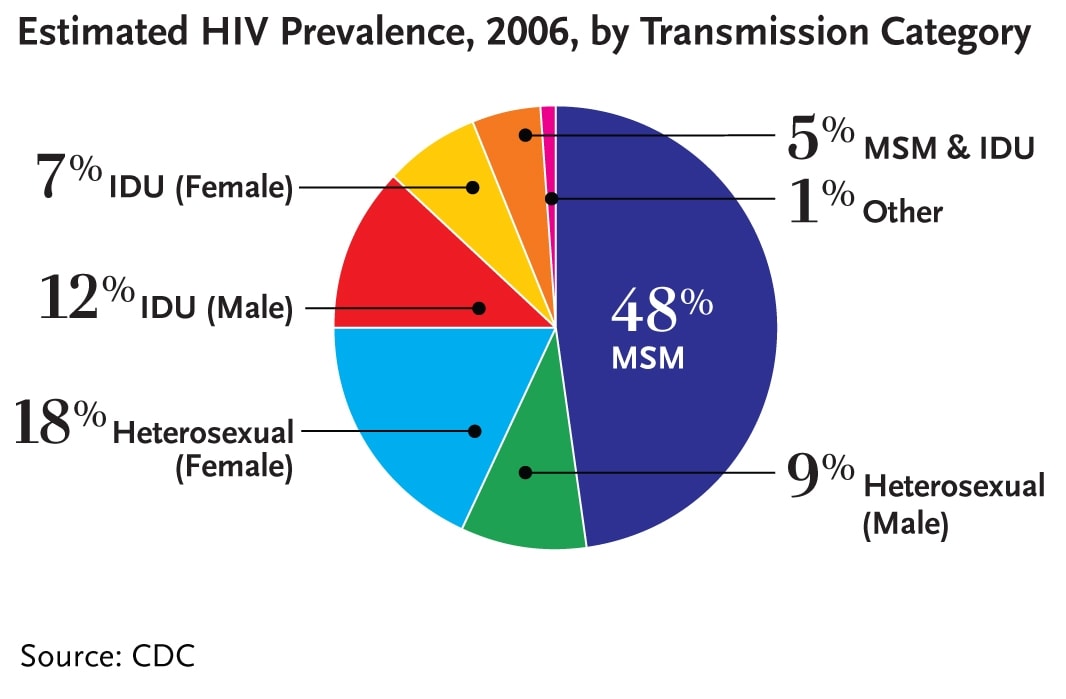
In the U.S. in 2006, nearly half of all people living with HIV (48%, or 532,000 total persons) were men who have sex with men. People infected through heterosexual contact accounted for more than one-quarter of all people living with HIV (28% or 305,700 persons) and people infected through injection drug use accounted for 19 percent of all people living with HIV (204,600 persons).