|
TABLE I. Provisional cases of selected* infrequently reported notifiable diseases (<1,000 cases reported during the preceding year) — United States, week ending September 3, 2016 (35th week)† (Export data) |
|||||||||
|
Disease |
Current week |
Cum 2016 |
5-year weekly average§ |
Total cases reported for previous years |
States reporting cases during current week (No.) |
||||
|
2015 |
2014 |
2013 |
2012 |
2011 |
|||||
|
Anthrax |
— |
— |
0 |
— |
— |
— |
— |
1 |
|
|
Arboviral diseases¶,**: |
|||||||||
|
Chikungunya virus†† |
— |
69 |
4 |
896 |
NN |
NN |
NN |
NN |
|
|
Eastern equine encephalitis virus |
— |
1 |
1 |
6 |
8 |
8 |
15 |
4 |
|
|
Jamestown Canyon virus§§ |
— |
2 |
0 |
11 |
11 |
22 |
2 |
3 |
|
|
La Crosse virus§§ |
— |
6 |
2 |
55 |
80 |
85 |
78 |
130 |
|
|
Powassan virus |
— |
4 |
0 |
7 |
8 |
12 |
7 |
16 |
|
|
St. Louis encephalitis virus |
— |
2 |
0 |
23 |
10 |
1 |
3 |
6 |
|
|
Western equine encephalitis virus |
— |
— |
— |
— |
— |
— |
— |
— |
|
|
Botulism, total |
— |
116 |
3 |
195 |
161 |
152 |
168 |
153 |
|
|
foodborne |
— |
26 |
0 |
37 |
15 |
4 |
27 |
24 |
|
|
infant |
— |
76 |
2 |
138 |
127 |
136 |
123 |
97 |
|
|
other (wound and unspecified) |
— |
14 |
0 |
20 |
19 |
12 |
18 |
32 |
|
|
Brucellosis |
— |
76 |
3 |
126 |
92 |
99 |
114 |
79 |
|
|
Chancroid |
1 |
9 |
0 |
11 |
— |
— |
15 |
8 |
CA (1) |
|
Cholera |
— |
— |
0 |
2 |
5 |
14 |
17 |
40 |
|
|
Cyclosporiasis** |
2 |
321 |
11 |
645 |
388 |
784 |
123 |
151 |
OH (1), TX (1) |
|
Diphtheria |
— |
— |
— |
— |
1 |
— |
1 |
— |
|
|
Haemophilus influenzae invasive disease (age <5 yrs)¶¶: |
|||||||||
|
serotype b |
— |
11 |
1 |
29 |
40 |
31 |
30 |
14 |
|
|
nontypeable serotype |
— |
96 |
2 |
175 |
128 |
141 |
115 |
93 |
|
|
other serotype |
— |
79 |
1 |
135 |
266 |
233 |
263 |
230 |
|
|
unknown serotype |
2 |
139 |
3 |
167 |
39 |
34 |
37 |
48 |
VA (1), GA (1) |
|
Hansen’s disease** |
— |
29 |
1 |
89 |
88 |
81 |
82 |
82 |
|
|
Hantavirus infections**: |
|||||||||
|
Hantavirus infection (non-HPS)†† |
— |
2 |
0 |
1 |
NN |
NN |
NN |
NN |
|
|
Hantavirus Pulmonary Syndrome (HPS) |
— |
10 |
0 |
17 |
32 |
21 |
30 |
23 |
|
|
Hemolytic uremic syndrome, postdiarrheal** |
4 |
141 |
8 |
274 |
250 |
329 |
274 |
290 |
MI (1), NE (1), OR (1), CA (1) |
|
Hepatitis B, virus infection perinatal |
1 |
17 |
1 |
37 |
47 |
48 |
40 |
NP |
PA (1) |
|
Influenza-associated pediatric mortality**,*** |
— |
79 |
1 |
130 |
141 |
160 |
52 |
118 |
|
|
Leptospirosis** |
1 |
24 |
1 |
40 |
38 |
NN |
NN |
NN |
FL (1) |
|
Listeriosis |
14 |
391 |
24 |
766 |
769 |
735 |
727 |
870 |
NYC (1), PA (3), OH (3), MI (1), VA (2), SC (1), FL (3) |
|
Measles††† |
— |
51 |
3 |
188 |
667 |
187 |
55 |
220 |
|
|
Meningococcal disease, invasive§§§: |
|||||||||
|
serogroup ACWY |
— |
60 |
2 |
120 |
123 |
142 |
161 |
257 |
|
|
serogroup B |
1 |
49 |
1 |
111 |
89 |
99 |
110 |
159 |
NY (1) |
|
other serogroup |
— |
12 |
0 |
21 |
25 |
17 |
20 |
20 |
|
|
unknown serogroup |
3 |
129 |
3 |
120 |
196 |
298 |
260 |
323 |
FL (1), OR (2) |
|
Novel influenza A virus infections¶¶¶ |
— |
21 |
6 |
6 |
3 |
21 |
313 |
14 |
|
|
Plague |
— |
— |
0 |
13 |
10 |
4 |
4 |
3 |
|
|
Poliomyelitis, paralytic |
— |
— |
— |
— |
— |
1 |
— |
— |
|
|
Polio virus infection, nonparalytic** |
— |
— |
— |
— |
— |
— |
— |
— |
|
|
Psittacosis** |
— |
3 |
0 |
4 |
8 |
6 |
2 |
2 |
|
|
Q fever, total** |
— |
74 |
3 |
156 |
168 |
170 |
135 |
134 |
|
|
acute |
— |
60 |
3 |
122 |
132 |
137 |
113 |
110 |
|
|
chronic |
— |
14 |
1 |
34 |
36 |
33 |
22 |
24 |
|
|
Rabies, human |
— |
— |
0 |
1 |
1 |
2 |
1 |
6 |
|
|
SARS-CoV |
— |
— |
— |
— |
— |
— |
— |
— |
|
|
Smallpox |
— |
— |
— |
— |
— |
— |
— |
— |
|
|
Streptococcal toxic shock syndrome** |
— |
170 |
3 |
335 |
259 |
224 |
194 |
168 |
|
|
Syphilis, congenital**** |
— |
244 |
7 |
492 |
458 |
348 |
322 |
360 |
|
|
Toxic shock syndrome (staphylococcal)** |
— |
19 |
1 |
64 |
59 |
71 |
65 |
78 |
|
|
Trichinellosis** |
— |
8 |
0 |
11 |
14 |
22 |
18 |
15 |
|
|
Tularemia |
1 |
122 |
5 |
314 |
180 |
203 |
149 |
166 |
WY (1) |
|
Typhoid fever |
4 |
195 |
10 |
367 |
349 |
338 |
354 |
390 |
MA (1), NYC (3) |
|
Vancomycin-intermediate Staphylococcus aureus** |
1 |
67 |
3 |
183 |
212 |
248 |
134 |
82 |
OH (1) |
|
Vancomycin-resistant Staphylococcus aureus** |
— |
— |
— |
1 |
— |
— |
2 |
— |
|
Table I Provisional cases of selected infrequently reported notifiable diseases (<1,000 cases reported during the preceding year) — United States, week ending September 3, 2016 (35th week)†
Figure I Selected notifiable disease reports, United States, comparison of provisional 4-week totals September 3, 2016, with historical data
Table II Provisional cases of selected notifiable diseases (≥1,000 cases reported during the preceding year), and selected low frequency diseases, United States and U.S. territories, weeks ending September 3, 2016, and September 5, 2015 (35th week)†
Table III Deaths in 122 U.S. cities, week ending September 3, 2016 (35th week)
|
TABLE I. (Continued) Provisional cases of selected* infrequently reported notifiable diseases (<1,000 cases reported during the preceding year) — United States, week ending September 3, 2016 (35th week)† (Export data) |
|||||||||
|
Disease |
Current week |
Cum 2016 |
5-year weekly average§ |
Total cases reported for previous years |
States reporting cases during current week (No.) |
||||
|
2015 |
2014 |
2013 |
2012 |
2011 |
|||||
|
Viral hemorrhagic fevers††††: |
|||||||||
|
Crimean-Congo hemorrhagic fever |
— |
— |
— |
— |
NP |
NP |
NP |
NP |
|
|
Ebola hemorrhagic fever |
— |
— |
— |
— |
4 |
NP |
NP |
NP |
|
|
Guanarito hemorrhagic fever |
— |
— |
— |
— |
NP |
NP |
NP |
NP |
|
|
Junin hemorrhagic fever |
— |
— |
— |
— |
NP |
NP |
NP |
NP |
|
|
Lassa fever |
— |
— |
— |
— |
1 |
NP |
NP |
NP |
|
|
Lujo virus |
— |
— |
— |
— |
NP |
NP |
NP |
NP |
|
|
Machupo hemorrhagic fever |
— |
— |
— |
— |
NP |
NP |
NP |
NP |
|
|
Marburg fever |
— |
— |
— |
— |
NP |
NP |
NP |
NP |
|
|
Sabia-associated hemorrhagic fever |
— |
— |
— |
— |
NP |
NP |
NP |
NP |
|
|
Yellow fever |
— |
— |
— |
— |
— |
— |
— |
— |
|
|
Zika virus††,§§§§ |
|||||||||
|
Zika virus congenital infection |
NA |
NA |
NA |
NN |
NN |
NN |
NN |
NN |
|
|
Zika virus disease, non-congenital infection |
4 |
2,900 |
— |
NN |
NN |
NN |
NN |
NN |
NYC (1), VA (1), MS (1), TX (1) |
|
—: No reported cases. N: Not reportable. NA: Not available. NN: Not Nationally Notifiable. NP: Nationally notifiable but not published. Cum: Cumulative year-to-date counts. * Case counts for reporting years 2015 and 2016 are provisional and subject to change. Data for years 2011 through 2014 are finalized. For further information on interpretation of these data, see http://wwwn.cdc.gov/nndss/document/ProvisionalNationaNotifiableDiseasesSurveillanceData20100927.pdf. † This table does not include cases from the U.S. territories. Three low incidence conditions, rubella, rubella congenital, and tetanus, are in Table II to facilitate case count verification with reporting jurisdictions. § Calculated by summing the incidence counts for the current week, the 2 weeks preceding the current week, and the 2 weeks following the current week, for a total of 5 preceding years. Additional information is available at http://wwwn.cdc.gov/nndss/document/5yearweeklyaverage.pdf. ¶ Includes both neuroinvasive and nonneuroinvasive. Updated weekly reports from the Division of Vector-Borne Diseases, National Center for Emerging and Zoonotic Infectious Diseases (ArboNET Surveillance). Data for West Nile virus are available in Table II. ** Not reportable in all reporting jurisdictions. Data from states where the condition is not reportable are excluded from this table, except for the arboviral diseases and influenza-associated pediatric mortality. Reporting exceptions are available at http://wwwn.cdc.gov/nndss/downloads.html. †† Office of Management and Budget approval of the NNDSS Revision #0920-0728 on January 21, 2016, authorized CDC to receive data for these conditions. CDC is in the process of soliciting data for these conditions (except Zika virus, congenital infection). CDC and the U.S. states are still modifying the technical infrastructure needed to collect and transmit data for Zika virus congenital infections. §§ Jamestown Canyon virus and Lacrosse virus have replaced California serogroup diseases. ¶¶ Data for Haemophilus influenzae (all ages, all serotypes) are available in Table II. *** Updated weekly from the Influenza Division, National Center for Immunization and Respiratory Diseases. Since October 4, 2015, 85 influenza-associated pediatric deaths occurring during the 2015-16 influenza season have been reported. ††† No measles cases were reported for the current week. §§§ Data for meningococcal disease (all serogroups) are available in Table II. ¶¶¶ All cases of novel influenza A virus infection reported to CDC since 2011 have been variant viruses. Influenza viruses that circulate in swine are called swine influenza viruses when isolated from swine, but are called variant viruses when isolated from humans. Variant influenza viruses are different from the influenza A (H1N1)pdm09 virus. Total case counts are provided by the Influenza Division, National Center for Immunization and Respiratory Diseases (NCIRD). **** Updated weekly from reports to the Division of STD Prevention, National Center for HIV/AIDS, Viral Hepatitis, STD, and TB Prevention. †††† Prior to 2015, CDC’s National Notifiable Diseases Surveillance System (NNDSS) did not receive electronic data about incident cases of specific viral hemorrhagic fevers; instead data were collected in aggregate as “viral hemorrhagic fevers”. Beginning in 2015, NNDSS has been updated to receive data for each of the viral hemorrhagic fevers listed below. In addition to the four cases of Ebola diagnosed in the United States to date in 2014, six residents of the United States have been medically evacuated to the United States for care after developing Ebola in West Africa. Ten of the 11 Viral Hemorrhagic Fever cases reported for 2014 are confirmed as Ebola and one as Lassa fever. §§§§ All cases reported have occurred in travelers returning from affected areas, with their sexual contacts, or infants infected in utero. |
|||||||||
FIGURE I. Selected notifiable disease reports, United States, comparison of provisional 4-week totals September 3, 2016, with historical data
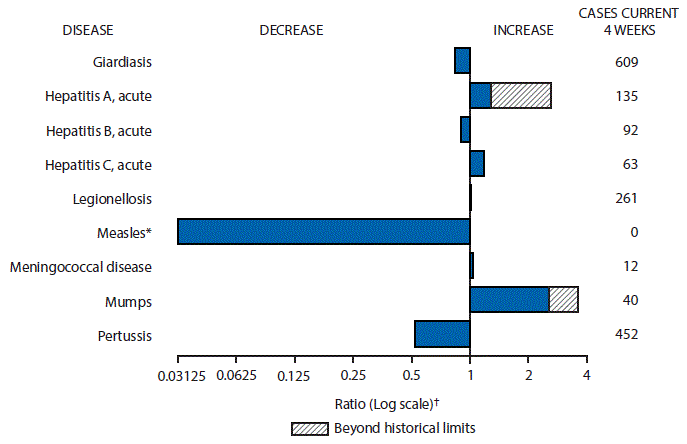
* No measles cases were reported for the current 4-week period yielding a ratio for week 35 of zero (0).
† Ratio of current 4-week total to mean of 15 4-week totals (from previous, comparable, and subsequent 4-week periods for the past 5 years). The point where the hatched area begins is based on the mean and two standard deviations of these 4-week totals.
|
TABLE II. Provisional cases of selected notifiable diseases (≥1,000 cases reported during the preceding year), and selected* low frequency diseases, United States and U.S. territories, weeks ending September 3, 2016, and September 5, 2015 (35th week)† (Export data) |
||||||||||
|
Reporting area |
Babesiosis |
Campylobacteriosis |
||||||||
|
Current week |
Previous 52 weeks |
Cum 2016 |
Cum 2015 |
Current week |
Previous 52 weeks |
Cum 2016 |
Cum 2015 |
|||
|
Med |
Max |
Med |
Max |
|||||||
|
United States |
6 |
16 |
121 |
925 |
1,588 |
473 |
971 |
3,038 |
32,629 |
36,386 |
|
New England |
3 |
8 |
68 |
548 |
896 |
34 |
53 |
91 |
1,848 |
2,143 |
|
Connecticut |
— |
1 |
7 |
47 |
297 |
— |
11 |
33 |
362 |
561 |
|
Maine |
2 |
0 |
11 |
65 |
36 |
4 |
5 |
11 |
165 |
142 |
|
Massachusetts |
— |
3 |
44 |
349 |
380 |
27 |
28 |
44 |
929 |
977 |
|
New Hampshire |
— |
0 |
2 |
9 |
40 |
2 |
4 |
12 |
128 |
184 |
|
Rhode Island |
1 |
1 |
21 |
72 |
137 |
— |
4 |
18 |
131 |
159 |
|
Vermont |
— |
0 |
4 |
6 |
6 |
1 |
4 |
9 |
133 |
120 |
|
Mid. Atlantic |
3 |
7 |
109 |
335 |
573 |
51 |
139 |
213 |
4,627 |
5,412 |
|
New Jersey |
— |
1 |
14 |
99 |
271 |
— |
33 |
56 |
1,007 |
1,276 |
|
New York (Upstate) |
— |
4 |
109 |
191 |
240 |
— |
32 |
89 |
1,040 |
1,273 |
|
New York City |
3 |
0 |
11 |
45 |
62 |
28 |
33 |
54 |
1,129 |
1,153 |
|
Pennsylvania |
N |
0 |
0 |
N |
N |
23 |
40 |
81 |
1,451 |
1,710 |
|
E.N. Central |
— |
0 |
5 |
31 |
58 |
74 |
121 |
215 |
4,835 |
3,791 |
|
Illinois |
— |
0 |
1 |
1 |
3 |
1 |
25 |
63 |
1,125 |
— |
|
Indiana |
— |
0 |
0 |
— |
— |
1 |
15 |
24 |
461 |
645 |
|
Michigan |
— |
0 |
0 |
— |
3 |
13 |
23 |
42 |
885 |
957 |
|
Ohio |
— |
0 |
0 |
— |
2 |
50 |
34 |
63 |
1,345 |
1,204 |
|
Wisconsin |
— |
0 |
5 |
30 |
50 |
9 |
27 |
58 |
1,019 |
985 |
|
W.N. Central |
— |
0 |
3 |
2 |
44 |
21 |
70 |
131 |
1,908 |
3,565 |
|
Iowa |
N |
0 |
0 |
N |
N |
11 |
17 |
44 |
725 |
510 |
|
Kansas |
N |
0 |
0 |
N |
N |
— |
11 |
27 |
406 |
491 |
|
Minnesota |
— |
0 |
3 |
— |
42 |
— |
0 |
37 |
1 |
963 |
|
Missouri |
N |
0 |
0 |
N |
N |
— |
0 |
32 |
16 |
857 |
|
Nebraska |
— |
0 |
1 |
1 |
— |
10 |
8 |
26 |
396 |
373 |
|
North Dakota |
— |
0 |
1 |
1 |
2 |
— |
2 |
9 |
79 |
129 |
|
South Dakota |
— |
0 |
0 |
— |
— |
— |
7 |
24 |
285 |
242 |
|
S. Atlantic |
— |
0 |
1 |
5 |
5 |
79 |
146 |
285 |
4,542 |
6,218 |
|
Delaware |
— |
0 |
1 |
1 |
1 |
— |
2 |
7 |
84 |
104 |
|
District of Columbia |
N |
0 |
0 |
N |
N |
N |
0 |
0 |
N |
N |
|
Florida |
N |
0 |
0 |
N |
N |
42 |
48 |
83 |
1,383 |
2,514 |
|
Georgia |
N |
0 |
0 |
N |
N |
11 |
18 |
32 |
611 |
771 |
|
Maryland |
— |
0 |
1 |
3 |
2 |
15 |
14 |
32 |
550 |
563 |
|
North Carolina |
N |
0 |
0 |
N |
N |
— |
24 |
82 |
624 |
783 |
|
South Carolina |
— |
0 |
1 |
1 |
2 |
1 |
6 |
16 |
168 |
224 |
|
Virginia |
N |
0 |
0 |
N |
N |
10 |
26 |
81 |
973 |
1,044 |
|
West Virginia |
— |
0 |
0 |
— |
— |
— |
5 |
13 |
149 |
215 |
|
E.S. Central |
— |
0 |
0 |
— |
3 |
10 |
43 |
80 |
1,451 |
1,615 |
|
Alabama |
— |
0 |
0 |
— |
2 |
— |
13 |
25 |
413 |
400 |
|
Kentucky |
— |
0 |
0 |
— |
— |
2 |
13 |
35 |
427 |
551 |
|
Mississippi |
N |
0 |
0 |
N |
N |
— |
4 |
13 |
132 |
127 |
|
Tennessee |
— |
0 |
0 |
— |
1 |
8 |
13 |
28 |
479 |
537 |
|
W.S. Central |
— |
0 |
1 |
1 |
2 |
67 |
106 |
261 |
3,691 |
3,934 |
|
Arkansas |
— |
0 |
0 |
— |
— |
12 |
9 |
29 |
360 |
295 |
|
Louisiana |
— |
0 |
1 |
1 |
1 |
— |
7 |
21 |
252 |
370 |
|
Oklahoma |
N |
0 |
0 |
N |
N |
26 |
19 |
45 |
716 |
568 |
|
Texas |
— |
0 |
0 |
— |
1 |
29 |
70 |
202 |
2,363 |
2,701 |
|
Mountain |
— |
0 |
1 |
1 |
— |
17 |
68 |
106 |
2,086 |
2,992 |
|
Arizona |
— |
0 |
0 |
— |
— |
6 |
22 |
49 |
783 |
1,002 |
|
Colorado |
N |
0 |
0 |
N |
N |
— |
0 |
25 |
1 |
637 |
|
Idaho |
N |
0 |
0 |
N |
N |
9 |
8 |
20 |
306 |
265 |
|
Montana |
— |
0 |
1 |
1 |
— |
2 |
6 |
14 |
251 |
236 |
|
Nevada |
N |
0 |
0 |
N |
N |
— |
2 |
8 |
61 |
118 |
|
New Mexico |
N |
0 |
0 |
N |
N |
— |
8 |
18 |
265 |
326 |
|
Utah |
— |
0 |
0 |
— |
— |
— |
9 |
25 |
313 |
305 |
|
Wyoming |
— |
0 |
0 |
— |
— |
— |
3 |
8 |
106 |
103 |
|
Pacific |
— |
0 |
2 |
2 |
7 |
120 |
200 |
1,992 |
7,641 |
6,716 |
|
Alaska |
N |
0 |
0 |
N |
N |
6 |
2 |
5 |
73 |
54 |
|
California |
— |
0 |
1 |
1 |
5 |
88 |
159 |
239 |
5,537 |
5,625 |
|
Hawaii |
N |
0 |
0 |
N |
N |
— |
10 |
25 |
360 |
397 |
|
Oregon |
— |
0 |
1 |
1 |
2 |
17 |
16 |
35 |
673 |
640 |
|
Washington |
— |
0 |
2 |
— |
— |
9 |
14 |
1,841 |
998 |
— |
|
Territories |
||||||||||
|
American Samoa |
U |
0 |
0 |
U |
U |
— |
0 |
0 |
— |
— |
|
C.N.M.I. |
— |
— |
— |
— |
— |
— |
— |
— |
— |
— |
|
Guam |
— |
0 |
0 |
— |
— |
— |
0 |
1 |
— |
2 |
|
Puerto Rico |
N |
0 |
0 |
N |
N |
— |
0 |
3 |
20 |
22 |
|
U.S. Virgin Islands |
N |
0 |
0 |
N |
N |
— |
0 |
0 |
— |
— |
|
C.N.M.I.: Commonwealth of Northern Mariana Islands. U: Unavailable. —: No reported cases. N: Not reportable. NN: Not Nationally Notifiable. NP: Nationally notifiable but not published. Cum: Cumulative year-to-date counts. Med: Median. Max: Maximum. * Three low incidence conditions, rubella, rubella congenital, and tetanus, are in Table II to facilitate case count verification with reporting jurisdictions. † Case counts for reporting year 2015 and 2016 are provisional and subject to change. For further information on interpretation of these data, see http://wwwn.cdc.gov/nndss/document/ProvisionalNationaNotifiableDiseasesSurveillanceData20100927.pdf. Data for TB are displayed in Table IV, which appears quarterly. |
||||||||||
|
TABLE II. (Continued) Provisional cases of selected notifiable diseases (≥1,000 cases reported during the preceding year), and selected* low frequency diseases, United States and U.S. territories, weeks ending September 3, 2016, and September 5, 2015 (35th week)† (Export data) |
||||||||||
|
Reporting area |
Chlamydia trachomatis infection |
Coccidioidomycosis |
||||||||
|
Current week |
Previous 52 weeks |
Cum 2016 |
Cum 2015 |
Current week |
Previous 52 weeks |
Cum 2016 |
Cum 2015 |
|||
|
Med |
Max |
Med |
Max |
|||||||
|
United States |
15,552 |
29,508 |
32,854 |
967,986 |
1,014,753 |
88 |
188 |
369 |
5,967 |
6,568 |
|
New England |
579 |
1,036 |
1,285 |
32,584 |
32,669 |
— |
0 |
1 |
2 |
— |
|
Connecticut |
5 |
240 |
484 |
5,319 |
8,544 |
N |
0 |
0 |
N |
N |
|
Maine |
113 |
76 |
134 |
2,759 |
2,675 |
N |
0 |
0 |
N |
N |
|
Massachusetts |
342 |
496 |
588 |
17,234 |
15,972 |
N |
0 |
0 |
N |
N |
|
New Hampshire |
33 |
118 |
225 |
3,879 |
1,107 |
— |
0 |
1 |
2 |
— |
|
Rhode Island |
86 |
71 |
227 |
2,488 |
3,102 |
— |
0 |
0 |
— |
— |
|
Vermont |
— |
31 |
58 |
905 |
1,269 |
N |
0 |
0 |
N |
N |
|
Mid. Atlantic |
2,334 |
3,819 |
4,287 |
131,175 |
125,763 |
— |
0 |
0 |
— |
— |
|
New Jersey |
201 |
629 |
1,129 |
22,674 |
21,614 |
N |
0 |
0 |
N |
N |
|
New York (Upstate) |
828 |
801 |
1,499 |
26,791 |
26,615 |
N |
0 |
0 |
N |
N |
|
New York City |
455 |
1,280 |
1,406 |
43,477 |
41,997 |
N |
0 |
0 |
N |
N |
|
Pennsylvania |
850 |
1,097 |
1,381 |
38,233 |
35,537 |
N |
0 |
0 |
N |
N |
|
E.N. Central |
903 |
4,270 |
5,133 |
137,093 |
150,100 |
— |
1 |
6 |
39 |
27 |
|
Illinois |
75 |
1,056 |
1,558 |
32,811 |
46,931 |
N |
0 |
0 |
N |
N |
|
Indiana |
207 |
598 |
1,223 |
20,289 |
18,640 |
N |
0 |
0 |
N |
N |
|
Michigan |
308 |
921 |
1,182 |
29,867 |
30,530 |
— |
0 |
3 |
25 |
15 |
|
Ohio |
— |
1,158 |
1,355 |
36,819 |
37,882 |
— |
0 |
4 |
13 |
6 |
|
Wisconsin |
313 |
503 |
609 |
17,307 |
16,117 |
— |
0 |
1 |
1 |
6 |
|
W.N. Central |
382 |
1,762 |
1,980 |
57,627 |
59,777 |
— |
1 |
7 |
60 |
81 |
|
Iowa |
69 |
249 |
282 |
8,170 |
8,059 |
N |
0 |
0 |
N |
N |
|
Kansas |
— |
225 |
297 |
7,578 |
7,753 |
N |
0 |
0 |
N |
N |
|
Minnesota |
— |
419 |
526 |
12,468 |
14,219 |
— |
1 |
4 |
50 |
61 |
|
Missouri |
227 |
581 |
693 |
19,971 |
19,664 |
— |
0 |
1 |
— |
7 |
|
Nebraska |
86 |
153 |
246 |
5,323 |
5,319 |
— |
0 |
1 |
4 |
7 |
|
North Dakota |
— |
61 |
91 |
2,089 |
2,131 |
— |
0 |
1 |
2 |
6 |
|
South Dakota |
— |
79 |
119 |
2,028 |
2,632 |
— |
0 |
1 |
4 |
— |
|
S. Atlantic |
3,152 |
5,978 |
7,463 |
191,281 |
213,335 |
— |
0 |
1 |
4 |
5 |
|
Delaware |
100 |
92 |
150 |
3,298 |
2,929 |
— |
0 |
1 |
1 |
— |
|
District of Columbia |
77 |
152 |
282 |
5,302 |
5,736 |
— |
0 |
0 |
— |
— |
|
Florida |
911 |
1,847 |
2,249 |
61,520 |
60,187 |
N |
0 |
0 |
N |
N |
|
Georgia |
390 |
931 |
1,288 |
29,945 |
39,360 |
N |
0 |
0 |
N |
N |
|
Maryland |
534 |
604 |
1,033 |
18,207 |
16,056 |
— |
0 |
1 |
3 |
5 |
|
North Carolina |
3 |
1,062 |
2,097 |
23,238 |
42,646 |
N |
0 |
0 |
N |
N |
|
South Carolina |
403 |
591 |
789 |
19,331 |
18,446 |
N |
0 |
0 |
N |
N |
|
Virginia |
682 |
729 |
1,358 |
27,350 |
24,608 |
N |
0 |
0 |
N |
N |
|
West Virginia |
52 |
90 |
186 |
3,090 |
3,367 |
N |
0 |
0 |
N |
N |
|
E.S. Central |
696 |
1,790 |
2,491 |
54,972 |
59,349 |
— |
0 |
0 |
— |
— |
|
Alabama |
— |
529 |
739 |
15,671 |
18,717 |
N |
0 |
0 |
N |
N |
|
Kentucky |
451 |
315 |
1,462 |
10,297 |
9,211 |
— |
0 |
0 |
— |
— |
|
Mississippi |
— |
376 |
655 |
10,940 |
9,663 |
N |
0 |
0 |
N |
N |
|
Tennessee |
245 |
586 |
791 |
18,064 |
21,758 |
N |
0 |
0 |
N |
N |
|
W.S. Central |
4,142 |
4,000 |
5,964 |
136,437 |
137,518 |
— |
0 |
2 |
8 |
4 |
|
Arkansas |
334 |
361 |
684 |
10,091 |
8,649 |
— |
0 |
2 |
1 |
2 |
|
Louisiana |
958 |
572 |
3,041 |
19,982 |
19,378 |
— |
0 |
1 |
7 |
2 |
|
Oklahoma |
64 |
305 |
483 |
9,526 |
14,202 |
N |
0 |
0 |
N |
N |
|
Texas |
2,786 |
2,779 |
4,611 |
96,838 |
95,289 |
N |
0 |
0 |
N |
N |
|
Mountain |
849 |
1,973 |
2,473 |
66,439 |
68,676 |
87 |
126 |
284 |
4,120 |
4,647 |
|
Arizona |
523 |
621 |
874 |
21,442 |
21,403 |
87 |
125 |
282 |
4,083 |
4,502 |
|
Colorado |
— |
463 |
826 |
16,025 |
16,429 |
N |
0 |
0 |
N |
N |
|
Idaho |
98 |
111 |
212 |
4,008 |
3,724 |
N |
0 |
0 |
N |
N |
|
Montana |
80 |
82 |
114 |
2,894 |
2,754 |
— |
0 |
1 |
7 |
8 |
|
Nevada |
— |
206 |
319 |
6,291 |
8,621 |
— |
0 |
7 |
7 |
62 |
|
New Mexico |
7 |
239 |
337 |
8,177 |
8,698 |
— |
0 |
2 |
11 |
25 |
|
Utah |
118 |
183 |
220 |
6,290 |
5,696 |
— |
0 |
2 |
11 |
40 |
|
Wyoming |
23 |
38 |
73 |
1,312 |
1,351 |
— |
0 |
1 |
1 |
10 |
|
Pacific |
2,515 |
4,837 |
5,293 |
160,378 |
167,566 |
1 |
60 |
99 |
1,734 |
1,804 |
|
Alaska |
— |
104 |
189 |
2,987 |
3,578 |
N |
0 |
0 |
N |
N |
|
California |
1,711 |
3,724 |
4,233 |
127,026 |
129,228 |
1 |
60 |
99 |
1,729 |
1,797 |
|
Hawaii |
— |
133 |
162 |
4,029 |
4,844 |
N |
0 |
0 |
N |
N |
|
Oregon |
348 |
328 |
432 |
11,132 |
10,902 |
— |
0 |
2 |
5 |
7 |
|
Washington |
456 |
472 |
744 |
15,204 |
19,014 |
N |
0 |
0 |
N |
N |
|
Territories |
||||||||||
|
American Samoa |
— |
0 |
0 |
— |
— |
N |
0 |
0 |
N |
N |
|
C.N.M.I. |
— |
— |
— |
— |
— |
— |
— |
— |
— |
— |
|
Guam |
— |
0 |
0 |
— |
— |
— |
0 |
0 |
— |
— |
|
Puerto Rico |
122 |
106 |
481 |
5,157 |
3,705 |
N |
0 |
0 |
N |
N |
|
U.S. Virgin Islands |
— |
11 |
28 |
331 |
532 |
— |
0 |
0 |
— |
— |
|
C.N.M.I.: Commonwealth of Northern Mariana Islands. U: Unavailable. —: No reported cases. N: Not reportable. NN: Not Nationally Notifiable. NP: Nationally notifiable but not published. Cum: Cumulative year-to-date counts. Med: Median. Max: Maximum. * Three low incidence conditions, rubella, rubella congenital, and tetanus, are in Table II to facilitate case count verification with reporting jurisdictions. † Case counts for reporting years 2015 and 2016 are provisional and subject to change. For further information on interpretation of these data, see http://wwwn.cdc.gov/nndss/document/ProvisionalNationaNotifiableDiseasesSurveillanceData20100927.pdf. Data for TB are displayed in Table IV, which appears quarterly. |
||||||||||
|
TABLE II. (Continued) Provisional cases of selected notifiable diseases (≥1,000 cases reported during the preceding year), and selected* low frequency diseases, United States and U.S. territories, weeks ending September 3, 2016, and September 5, 2015 (35th week)† (Export data) |
|||||||||||||||
|
Reporting area |
Cryptosporidiosis |
Dengue Virus Infection |
|||||||||||||
|
Dengue§ |
Severe Dengue |
||||||||||||||
|
Current week |
Previous 52 weeks |
Cum 2016 |
Cum 2015 |
Current week |
Previous 52 weeks |
Cum 2016 |
Cum 2015 |
Current week |
Previous 52 weeks |
Cum 2016 |
Cum 2015 |
||||
|
Med |
Max |
Med |
Max |
Med |
Max |
||||||||||
|
United States |
391 |
148 |
516 |
6,282 |
5,745 |
2 |
14 |
47 |
434 |
408 |
— |
0 |
1 |
3 |
4 |
|
New England |
10 |
8 |
26 |
251 |
273 |
— |
0 |
2 |
7 |
16 |
— |
0 |
0 |
— |
— |
|
Connecticut |
— |
1 |
3 |
23 |
53 |
— |
0 |
2 |
3 |
3 |
— |
0 |
0 |
— |
— |
|
Maine |
— |
1 |
4 |
31 |
21 |
— |
0 |
1 |
— |
1 |
— |
0 |
0 |
— |
— |
|
Massachusetts |
8 |
4 |
13 |
134 |
127 |
— |
0 |
1 |
— |
5 |
— |
0 |
0 |
— |
— |
|
New Hampshire |
— |
0 |
4 |
28 |
26 |
— |
0 |
0 |
— |
1 |
— |
0 |
0 |
— |
— |
|
Rhode Island |
2 |
0 |
4 |
9 |
11 |
— |
0 |
1 |
2 |
3 |
— |
0 |
0 |
— |
— |
|
Vermont |
— |
1 |
7 |
26 |
35 |
— |
0 |
1 |
2 |
3 |
— |
0 |
0 |
— |
— |
|
Mid. Atlantic |
21 |
14 |
40 |
546 |
492 |
— |
3 |
11 |
78 |
99 |
— |
0 |
1 |
— |
1 |
|
New Jersey |
— |
1 |
7 |
42 |
49 |
— |
1 |
4 |
39 |
33 |
— |
0 |
0 |
— |
— |
|
New York (Upstate) |
— |
5 |
16 |
164 |
143 |
— |
0 |
5 |
25 |
18 |
— |
0 |
0 |
— |
— |
|
New York City |
10 |
2 |
10 |
96 |
78 |
— |
0 |
5 |
— |
36 |
— |
0 |
1 |
— |
1 |
|
Pennsylvania |
11 |
6 |
19 |
244 |
222 |
— |
0 |
3 |
14 |
12 |
— |
0 |
0 |
— |
— |
|
E.N. Central |
229 |
30 |
225 |
1,871 |
1,025 |
— |
1 |
4 |
38 |
36 |
— |
0 |
1 |
1 |
— |
|
Illinois |
— |
3 |
60 |
138 |
106 |
— |
0 |
2 |
12 |
19 |
— |
0 |
0 |
— |
— |
|
Indiana |
— |
3 |
8 |
104 |
128 |
— |
0 |
2 |
6 |
— |
— |
0 |
1 |
1 |
— |
|
Michigan |
5 |
5 |
19 |
241 |
149 |
— |
0 |
3 |
10 |
8 |
— |
0 |
0 |
— |
— |
|
Ohio |
208 |
8 |
189 |
933 |
261 |
— |
0 |
1 |
4 |
6 |
— |
0 |
0 |
— |
— |
|
Wisconsin |
16 |
11 |
44 |
455 |
381 |
— |
0 |
2 |
6 |
3 |
— |
0 |
0 |
— |
— |
|
W.N. Central |
11 |
23 |
98 |
666 |
1,032 |
— |
0 |
3 |
18 |
22 |
— |
0 |
0 |
— |
1 |
|
Iowa |
1 |
9 |
25 |
348 |
243 |
— |
0 |
1 |
4 |
3 |
— |
0 |
0 |
— |
— |
|
Kansas |
— |
2 |
11 |
60 |
122 |
— |
0 |
1 |
4 |
3 |
— |
0 |
0 |
— |
— |
|
Minnesota |
— |
0 |
18 |
— |
195 |
— |
0 |
3 |
3 |
11 |
— |
0 |
0 |
— |
1 |
|
Missouri |
— |
0 |
30 |
5 |
211 |
— |
0 |
2 |
6 |
2 |
— |
0 |
0 |
— |
— |
|
Nebraska |
10 |
3 |
21 |
133 |
134 |
— |
0 |
1 |
— |
1 |
— |
0 |
0 |
— |
— |
|
North Dakota |
— |
0 |
4 |
22 |
12 |
— |
0 |
0 |
— |
1 |
— |
0 |
0 |
— |
— |
|
South Dakota |
— |
4 |
19 |
98 |
115 |
— |
0 |
1 |
1 |
1 |
— |
0 |
0 |
— |
— |
|
S. Atlantic |
28 |
28 |
75 |
893 |
1,132 |
1 |
3 |
9 |
81 |
79 |
— |
0 |
1 |
1 |
— |
|
Delaware |
— |
0 |
2 |
11 |
9 |
— |
0 |
1 |
2 |
1 |
— |
0 |
0 |
— |
— |
|
District of Columbia |
— |
0 |
0 |
— |
— |
— |
0 |
1 |
2 |
8 |
— |
0 |
1 |
— |
— |
|
Florida |
16 |
12 |
40 |
331 |
553 |
— |
1 |
6 |
36 |
34 |
— |
0 |
0 |
— |
— |
|
Georgia |
7 |
6 |
23 |
218 |
218 |
1 |
0 |
2 |
14 |
4 |
— |
0 |
0 |
— |
— |
|
Maryland |
2 |
2 |
7 |
49 |
48 |
— |
0 |
2 |
13 |
7 |
— |
0 |
1 |
— |
— |
|
North Carolina |
— |
4 |
25 |
101 |
128 |
— |
0 |
1 |
3 |
5 |
— |
0 |
0 |
— |
— |
|
South Carolina |
— |
1 |
5 |
39 |
47 |
— |
0 |
2 |
3 |
3 |
— |
0 |
1 |
1 |
— |
|
Virginia |
3 |
4 |
46 |
133 |
117 |
— |
0 |
2 |
8 |
16 |
— |
0 |
0 |
— |
— |
|
West Virginia |
— |
0 |
2 |
11 |
12 |
— |
0 |
0 |
— |
1 |
— |
0 |
0 |
— |
— |
|
E.S. Central |
5 |
10 |
33 |
366 |
450 |
1 |
0 |
2 |
6 |
13 |
— |
0 |
0 |
— |
— |
|
Alabama |
2 |
4 |
21 |
162 |
181 |
— |
0 |
1 |
1 |
3 |
— |
0 |
0 |
— |
— |
|
Kentucky |
1 |
2 |
6 |
78 |
66 |
— |
0 |
0 |
— |
1 |
— |
0 |
0 |
— |
— |
|
Mississippi |
— |
1 |
3 |
24 |
25 |
— |
0 |
1 |
— |
1 |
— |
0 |
0 |
— |
— |
|
Tennessee |
2 |
4 |
17 |
102 |
178 |
1 |
0 |
1 |
5 |
8 |
— |
0 |
0 |
— |
— |
|
W.S. Central |
17 |
18 |
78 |
581 |
585 |
— |
1 |
4 |
24 |
20 |
— |
0 |
0 |
— |
2 |
|
Arkansas |
1 |
1 |
8 |
47 |
40 |
— |
0 |
1 |
1 |
— |
— |
0 |
0 |
— |
— |
|
Louisiana |
— |
1 |
6 |
50 |
99 |
— |
0 |
1 |
1 |
2 |
— |
0 |
0 |
— |
— |
|
Oklahoma |
6 |
3 |
36 |
121 |
50 |
— |
0 |
1 |
1 |
2 |
— |
0 |
0 |
— |
— |
|
Texas |
10 |
11 |
34 |
363 |
396 |
— |
1 |
3 |
21 |
16 |
— |
0 |
0 |
— |
2 |
|
Mountain |
67 |
10 |
90 |
632 |
376 |
— |
1 |
4 |
27 |
16 |
— |
0 |
0 |
— |
— |
|
Arizona |
56 |
1 |
87 |
353 |
40 |
— |
0 |
4 |
11 |
9 |
— |
0 |
0 |
— |
— |
|
Colorado |
— |
0 |
10 |
1 |
71 |
— |
0 |
2 |
8 |
3 |
— |
0 |
0 |
— |
— |
|
Idaho |
2 |
2 |
10 |
75 |
60 |
— |
0 |
1 |
3 |
1 |
— |
0 |
0 |
— |
— |
|
Montana |
2 |
1 |
5 |
44 |
28 |
— |
0 |
2 |
1 |
1 |
— |
0 |
0 |
— |
— |
|
Nevada |
— |
0 |
3 |
7 |
5 |
— |
0 |
2 |
3 |
1 |
— |
0 |
0 |
— |
— |
|
New Mexico |
— |
1 |
4 |
36 |
35 |
— |
0 |
1 |
— |
— |
— |
0 |
0 |
— |
— |
|
Utah |
7 |
3 |
7 |
106 |
115 |
— |
0 |
1 |
1 |
1 |
— |
0 |
0 |
— |
— |
|
Wyoming |
— |
0 |
2 |
10 |
22 |
— |
0 |
0 |
— |
— |
— |
0 |
0 |
— |
— |
|
Pacific |
3 |
14 |
128 |
476 |
380 |
— |
4 |
30 |
154 |
107 |
— |
0 |
1 |
1 |
— |
|
Alaska |
— |
0 |
2 |
6 |
4 |
— |
0 |
1 |
2 |
— |
— |
0 |
0 |
— |
— |
|
California |
3 |
7 |
12 |
234 |
236 |
— |
2 |
15 |
82 |
87 |
— |
0 |
0 |
— |
— |
|
Hawaii |
— |
0 |
3 |
— |
15 |
— |
1 |
25 |
54 |
9 |
— |
0 |
0 |
— |
— |
|
Oregon |
— |
6 |
11 |
181 |
125 |
— |
0 |
1 |
4 |
3 |
— |
0 |
0 |
— |
— |
|
Washington |
— |
0 |
110 |
55 |
— |
— |
0 |
3 |
12 |
8 |
— |
0 |
1 |
1 |
— |
|
Territories |
|||||||||||||||
|
American Samoa |
N |
0 |
0 |
N |
N |
— |
0 |
0 |
— |
— |
— |
0 |
0 |
— |
— |
|
C.N.M.I. |
— |
— |
— |
— |
— |
— |
— |
— |
— |
— |
— |
— |
— |
— |
— |
|
Guam |
— |
0 |
0 |
— |
— |
— |
0 |
0 |
— |
— |
— |
0 |
0 |
— |
— |
|
Puerto Rico |
— |
0 |
0 |
— |
— |
— |
3 |
27 |
163 |
30 |
— |
0 |
0 |
— |
— |
|
U.S. Virgin Islands |
— |
0 |
0 |
— |
— |
— |
0 |
5 |
34 |
3 |
— |
0 |
0 |
— |
— |
|
C.N.M.I.: Commonwealth of Northern Mariana Islands. U: Unavailable. —: No reported cases. N: Not reportable. NN: Not Nationally Notifiable. NP: Nationally notifiable but not published. Cum: Cumulative year-to-date counts. Med: Median. Max: Maximum. * Three low incidence conditions, rubella, rubella congenital, and tetanus, are in Table II to facilitate case count verification with reporting jurisdictions. † Case counts for reporting year 2015 and 2016 are provisional and subject to change. For further information on interpretation of these data, see http://wwwn.cdc.gov/nndss/document/ProvisionalNationaNotifiableDiseasesSurveillanceData20100927.pdf. Data for TB are displayed in Table IV, which appears quarterly. § Includes data for dengue and dengue-like illness. Office of Management and Budget approval of the NNDSS Revision #0920-0728 on January 21, 2016, authorized CDC to receive data for these conditions. CDC is in the process of soliciting data for these conditions. |
|||||||||||||||
|
TABLE II. (Continued) Provisional cases of selected notifiable diseases (≥1,000 cases reported during the preceding year), and selected* low frequency diseases, United States and U.S. territories, weeks ending September 3, 2016, and September 5, 2015 (35th week)† (Export data) |
|||||||||||||||
|
Reporting area |
Ehrlichiosis/Anaplasmosis§ |
||||||||||||||
|
Ehrlichia chaffeensis |
Anaplasma phagocytophilum |
Undetermined |
|||||||||||||
|
Current week |
Previous 52 weeks |
Cum 2016 |
Cum 2015 |
Current week |
Previous 52 weeks |
Cum 2016 |
Cum 2015 |
Current week |
Previous 52 weeks |
Cum 2016 |
Cum 2015 |
||||
|
Med |
Max |
Med |
Max |
Med |
Max |
||||||||||
|
United States |
8 |
14 |
107 |
798 |
967 |
8 |
49 |
150 |
1,693 |
2,730 |
1 |
1 |
6 |
62 |
149 |
|
New England |
1 |
1 |
8 |
34 |
49 |
7 |
17 |
70 |
761 |
1,063 |
1 |
0 |
1 |
5 |
3 |
|
Connecticut |
— |
0 |
0 |
— |
— |
— |
0 |
4 |
9 |
106 |
— |
0 |
0 |
— |
— |
|
Maine |
1 |
0 |
1 |
3 |
4 |
7 |
2 |
31 |
256 |
116 |
1 |
0 |
1 |
4 |
1 |
|
Massachusetts |
— |
0 |
2 |
7 |
7 |
— |
7 |
46 |
303 |
601 |
— |
0 |
0 |
— |
— |
|
New Hampshire |
— |
0 |
1 |
4 |
10 |
— |
1 |
6 |
38 |
71 |
— |
0 |
0 |
— |
— |
|
Rhode Island |
— |
0 |
6 |
18 |
25 |
— |
0 |
13 |
41 |
74 |
— |
0 |
0 |
— |
— |
|
Vermont |
— |
0 |
1 |
2 |
3 |
— |
2 |
21 |
114 |
95 |
— |
0 |
1 |
1 |
2 |
|
Mid. Atlantic |
— |
2 |
37 |
120 |
111 |
— |
14 |
56 |
573 |
630 |
— |
0 |
3 |
13 |
18 |
|
New Jersey |
— |
0 |
7 |
45 |
54 |
— |
1 |
11 |
60 |
113 |
— |
0 |
1 |
4 |
5 |
|
New York (Upstate) |
— |
2 |
36 |
64 |
48 |
— |
12 |
53 |
475 |
449 |
— |
0 |
3 |
5 |
5 |
|
New York City |
— |
0 |
3 |
11 |
6 |
— |
1 |
6 |
37 |
48 |
— |
0 |
1 |
3 |
— |
|
Pennsylvania |
— |
0 |
1 |
— |
3 |
— |
0 |
2 |
1 |
20 |
— |
0 |
2 |
1 |
8 |
|
E.N. Central |
— |
1 |
6 |
42 |
66 |
— |
5 |
33 |
272 |
456 |
— |
0 |
5 |
18 |
69 |
|
Illinois |
— |
0 |
4 |
26 |
27 |
— |
0 |
2 |
6 |
9 |
— |
0 |
0 |
— |
1 |
|
Indiana |
— |
0 |
0 |
— |
— |
— |
0 |
0 |
— |
— |
— |
0 |
2 |
9 |
19 |
|
Michigan |
— |
0 |
1 |
1 |
3 |
— |
0 |
1 |
2 |
6 |
— |
0 |
0 |
— |
— |
|
Ohio |
— |
0 |
1 |
6 |
15 |
— |
0 |
2 |
4 |
1 |
— |
0 |
0 |
— |
1 |
|
Wisconsin |
— |
0 |
2 |
9 |
21 |
— |
5 |
33 |
260 |
440 |
— |
0 |
5 |
9 |
48 |
|
W.N. Central |
2 |
2 |
21 |
196 |
249 |
1 |
1 |
22 |
31 |
516 |
— |
0 |
2 |
9 |
29 |
|
Iowa |
— |
0 |
1 |
2 |
— |
— |
0 |
1 |
4 |
— |
— |
0 |
1 |
2 |
— |
|
Kansas |
— |
0 |
4 |
39 |
41 |
— |
0 |
1 |
4 |
5 |
— |
0 |
1 |
1 |
1 |
|
Minnesota |
— |
0 |
1 |
— |
3 |
— |
0 |
22 |
— |
495 |
— |
0 |
2 |
— |
19 |
|
Missouri |
1 |
1 |
17 |
150 |
201 |
1 |
0 |
2 |
9 |
13 |
— |
0 |
1 |
4 |
8 |
|
Nebraska |
1 |
0 |
1 |
5 |
3 |
— |
0 |
1 |
2 |
1 |
— |
0 |
0 |
— |
— |
|
North Dakota |
— |
0 |
0 |
— |
1 |
— |
0 |
3 |
12 |
2 |
— |
0 |
1 |
2 |
1 |
|
South Dakota |
— |
0 |
0 |
— |
— |
— |
0 |
0 |
— |
— |
— |
0 |
0 |
— |
— |
|
S. Atlantic |
— |
2 |
23 |
157 |
216 |
— |
1 |
6 |
35 |
23 |
— |
0 |
2 |
7 |
9 |
|
Delaware |
— |
0 |
3 |
11 |
10 |
— |
0 |
1 |
4 |
1 |
— |
0 |
1 |
1 |
— |
|
District of Columbia |
— |
0 |
0 |
— |
— |
— |
0 |
0 |
— |
— |
— |
0 |
0 |
— |
— |
|
Florida |
— |
0 |
6 |
18 |
13 |
— |
0 |
2 |
6 |
5 |
— |
0 |
1 |
— |
— |
|
Georgia |
— |
0 |
1 |
4 |
30 |
— |
0 |
1 |
1 |
— |
— |
0 |
1 |
1 |
1 |
|
Maryland |
— |
0 |
9 |
44 |
29 |
— |
0 |
2 |
8 |
1 |
— |
0 |
1 |
1 |
— |
|
North Carolina |
— |
0 |
22 |
27 |
41 |
— |
0 |
5 |
5 |
8 |
— |
0 |
0 |
— |
— |
|
South Carolina |
— |
0 |
0 |
— |
3 |
— |
0 |
0 |
— |
1 |
— |
0 |
0 |
— |
— |
|
Virginia |
— |
1 |
9 |
48 |
86 |
— |
0 |
3 |
11 |
7 |
— |
0 |
2 |
4 |
7 |
|
West Virginia |
— |
0 |
1 |
5 |
4 |
— |
0 |
0 |
— |
— |
— |
0 |
0 |
— |
1 |
|
E.S. Central |
3 |
1 |
9 |
96 |
113 |
— |
0 |
3 |
12 |
15 |
— |
0 |
1 |
6 |
16 |
|
Alabama |
— |
0 |
2 |
6 |
7 |
— |
0 |
1 |
5 |
7 |
— |
0 |
1 |
3 |
2 |
|
Kentucky |
— |
0 |
4 |
19 |
48 |
— |
0 |
0 |
— |
— |
— |
0 |
0 |
— |
— |
|
Mississippi |
— |
0 |
1 |
2 |
8 |
— |
0 |
0 |
— |
— |
— |
0 |
1 |
— |
3 |
|
Tennessee |
3 |
1 |
9 |
69 |
50 |
— |
0 |
2 |
7 |
8 |
— |
0 |
1 |
3 |
11 |
|
W.S. Central |
2 |
2 |
64 |
151 |
163 |
— |
0 |
5 |
9 |
18 |
— |
0 |
1 |
1 |
— |
|
Arkansas |
1 |
2 |
16 |
139 |
155 |
— |
0 |
5 |
8 |
15 |
— |
0 |
0 |
— |
— |
|
Louisiana |
— |
0 |
1 |
1 |
1 |
— |
0 |
0 |
— |
— |
— |
0 |
1 |
— |
— |
|
Oklahoma |
— |
0 |
60 |
1 |
2 |
— |
0 |
0 |
— |
— |
— |
0 |
0 |
— |
— |
|
Texas |
1 |
0 |
2 |
10 |
5 |
— |
0 |
1 |
1 |
3 |
— |
0 |
1 |
1 |
— |
|
Mountain |
— |
0 |
1 |
1 |
— |
— |
0 |
0 |
— |
3 |
— |
0 |
1 |
1 |
3 |
|
Arizona |
— |
0 |
0 |
— |
— |
— |
0 |
0 |
— |
— |
— |
0 |
1 |
1 |
3 |
|
Colorado |
N |
0 |
0 |
N |
N |
N |
0 |
0 |
N |
N |
N |
0 |
0 |
N |
N |
|
Idaho |
N |
0 |
0 |
N |
N |
N |
0 |
0 |
N |
N |
N |
0 |
0 |
N |
N |
|
Montana |
— |
0 |
1 |
1 |
— |
— |
0 |
0 |
— |
1 |
— |
0 |
0 |
— |
— |
|
Nevada |
— |
0 |
0 |
— |
— |
— |
0 |
0 |
— |
— |
— |
0 |
0 |
— |
— |
|
New Mexico |
N |
0 |
0 |
N |
N |
N |
0 |
0 |
N |
N |
N |
0 |
0 |
N |
N |
|
Utah |
— |
0 |
0 |
— |
— |
— |
0 |
0 |
— |
2 |
— |
0 |
0 |
— |
— |
|
Wyoming |
— |
0 |
0 |
— |
— |
— |
0 |
0 |
— |
— |
— |
0 |
0 |
— |
— |
|
Pacific |
— |
0 |
1 |
1 |
— |
— |
0 |
1 |
— |
6 |
— |
0 |
2 |
2 |
2 |
|
Alaska |
N |
0 |
0 |
N |
N |
N |
0 |
0 |
N |
N |
N |
0 |
0 |
N |
N |
|
California |
— |
0 |
0 |
— |
— |
— |
0 |
0 |
— |
3 |
— |
0 |
2 |
2 |
1 |
|
Hawaii |
N |
0 |
0 |
N |
N |
N |
0 |
0 |
N |
N |
N |
0 |
0 |
N |
N |
|
Oregon |
— |
0 |
1 |
1 |
— |
— |
0 |
0 |
— |
3 |
— |
0 |
0 |
— |
1 |
|
Washington |
— |
0 |
0 |
— |
— |
— |
0 |
1 |
— |
— |
— |
0 |
0 |
— |
— |
|
Territories |
|||||||||||||||
|
American Samoa |
N |
0 |
0 |
N |
N |
N |
0 |
0 |
N |
N |
N |
0 |
0 |
N |
N |
|
C.N.M.I. |
— |
— |
— |
— |
— |
— |
— |
— |
— |
— |
— |
— |
— |
— |
— |
|
Guam |
N |
0 |
0 |
N |
N |
N |
0 |
0 |
N |
N |
N |
0 |
0 |
N |
N |
|
Puerto Rico |
N |
0 |
0 |
N |
N |
N |
0 |
0 |
N |
N |
N |
0 |
0 |
N |
N |
|
U.S. Virgin Islands |
— |
0 |
0 |
— |
— |
— |
0 |
0 |
— |
— |
— |
0 |
0 |
— |
— |
|
C.N.M.I.: Commonwealth of Northern Mariana Islands. U: Unavailable. —: No reported cases. N: Not reportable. NN: Not Nationally Notifiable. NP: Nationally notifiable but not published. Cum: Cumulative year-to-date counts. Med: Median. Max: Maximum. * Three low incidence conditions, rubella, rubella congenital, and tetanus, are in Table II to facilitate case count verification with reporting jurisdictions. † Case counts for reporting year 2015 and 2016 are provisional and subject to change. For further information on interpretation of these data, see http://wwwn.cdc.gov/nndss/document/ProvisionalNationaNotifiableDiseasesSurveillanceData20100927.pdf. Data for TB are displayed in Table IV, which appears quarterly. § Cumulative total E. ewingii cases reported for year 2016 = 13, and 14 cases reported for 2015. |
|||||||||||||||
|
TABLE II. (Continued) Provisional cases of selected notifiable diseases (≥1,000 cases reported during the preceding year), and selected* low frequency diseases, United States and U.S. territories, weeks ending September 3, 2016, and September 5, 2015 (35th week)† (Export data) |
|||||||||||||||
|
Reporting area |
Giardiasis |
Gonorrhea |
Haemophilus influenzae, invasive§ All ages, all serotypes |
||||||||||||
|
Current week |
Previous 52 weeks |
Cum 2016 |
Cum 2015 |
Current week |
Previous 52 weeks |
Cum 2016 |
Cum 2015 |
Current week |
Previous 52 weeks |
Cum 2016 |
Cum 2015 |
||||
|
Med |
Max |
Med |
Max |
Med |
Max |
||||||||||
|
United States |
146 |
253 |
870 |
8,385 |
8,757 |
4,546 |
7,940 |
9,325 |
270,806 |
254,071 |
20 |
83 |
189 |
2,908 |
2,695 |
|
New England |
15 |
20 |
42 |
683 |
749 |
75 |
159 |
213 |
5,419 |
4,519 |
1 |
5 |
12 |
181 |
179 |
|
Connecticut |
— |
4 |
9 |
134 |
153 |
7 |
44 |
99 |
1,464 |
1,304 |
— |
1 |
3 |
37 |
30 |
|
Maine |
4 |
2 |
10 |
74 |
62 |
1 |
9 |
20 |
262 |
185 |
— |
0 |
3 |
21 |
28 |
|
Massachusetts |
3 |
12 |
23 |
355 |
441 |
55 |
86 |
107 |
2,942 |
2,431 |
1 |
2 |
8 |
99 |
84 |
|
New Hampshire |
— |
2 |
6 |
69 |
74 |
12 |
7 |
53 |
359 |
138 |
— |
0 |
3 |
12 |
15 |
|
Rhode Island |
8 |
1 |
5 |
51 |
19 |
— |
10 |
24 |
310 |
375 |
— |
0 |
2 |
4 |
14 |
|
Vermont |
N |
0 |
0 |
N |
N |
— |
3 |
8 |
82 |
86 |
— |
0 |
2 |
8 |
8 |
|
Mid. Atlantic |
40 |
51 |
89 |
1,653 |
1,805 |
634 |
930 |
1,107 |
32,574 |
29,937 |
3 |
12 |
34 |
450 |
411 |
|
New Jersey |
— |
7 |
14 |
184 |
277 |
57 |
143 |
302 |
5,234 |
4,931 |
— |
2 |
9 |
74 |
85 |
|
New York (Upstate) |
— |
17 |
38 |
552 |
494 |
195 |
173 |
344 |
6,025 |
5,656 |
2 |
4 |
20 |
145 |
131 |
|
New York City |
24 |
16 |
25 |
558 |
592 |
152 |
343 |
404 |
11,807 |
11,038 |
1 |
2 |
7 |
75 |
65 |
|
Pennsylvania |
16 |
12 |
22 |
359 |
442 |
230 |
272 |
340 |
9,508 |
8,312 |
— |
5 |
11 |
156 |
130 |
|
E.N. Central |
18 |
27 |
61 |
888 |
979 |
266 |
1,129 |
1,429 |
37,156 |
36,497 |
3 |
14 |
32 |
489 |
474 |
|
Illinois |
N |
0 |
0 |
N |
N |
29 |
253 |
420 |
7,922 |
11,169 |
— |
4 |
9 |
129 |
131 |
|
Indiana |
— |
3 |
9 |
92 |
119 |
71 |
173 |
304 |
5,989 |
4,823 |
— |
2 |
8 |
60 |
70 |
|
Michigan |
4 |
8 |
20 |
274 |
290 |
81 |
219 |
293 |
7,554 |
6,711 |
— |
3 |
10 |
106 |
87 |
|
Ohio |
1 |
7 |
14 |
206 |
258 |
— |
357 |
434 |
11,567 |
10,681 |
3 |
3 |
8 |
121 |
110 |
|
Wisconsin |
13 |
9 |
36 |
316 |
312 |
85 |
122 |
162 |
4,124 |
3,113 |
— |
2 |
6 |
73 |
76 |
|
W.N. Central |
3 |
13 |
54 |
365 |
926 |
226 |
467 |
554 |
16,447 |
13,844 |
— |
4 |
16 |
94 |
217 |
|
Iowa |
1 |
4 |
15 |
134 |
124 |
10 |
47 |
67 |
1,620 |
1,420 |
— |
0 |
1 |
— |
1 |
|
Kansas |
— |
2 |
7 |
62 |
69 |
2 |
53 |
78 |
1,983 |
1,702 |
— |
1 |
5 |
39 |
27 |
|
Minnesota |
— |
0 |
22 |
— |
400 |
— |
85 |
123 |
2,979 |
2,744 |
— |
0 |
7 |
1 |
70 |
|
Missouri |
— |
0 |
12 |
6 |
153 |
196 |
208 |
275 |
7,386 |
5,791 |
— |
0 |
4 |
4 |
80 |
|
Nebraska |
2 |
2 |
9 |
83 |
90 |
18 |
39 |
63 |
1,357 |
1,056 |
— |
0 |
3 |
21 |
22 |
|
North Dakota |
— |
1 |
4 |
24 |
23 |
— |
15 |
29 |
539 |
451 |
— |
0 |
3 |
18 |
16 |
|
South Dakota |
— |
2 |
8 |
56 |
67 |
— |
21 |
39 |
583 |
680 |
— |
0 |
2 |
11 |
1 |
|
S. Atlantic |
31 |
49 |
78 |
1,688 |
1,589 |
878 |
1,639 |
2,385 |
56,335 |
56,571 |
6 |
20 |
89 |
765 |
615 |
|
Delaware |
— |
0 |
3 |
8 |
18 |
31 |
30 |
45 |
1,022 |
763 |
— |
0 |
2 |
12 |
12 |
|
District of Columbia |
N |
0 |
0 |
N |
N |
41 |
56 |
136 |
2,177 |
1,951 |
— |
0 |
3 |
12 |
6 |
|
Florida |
24 |
23 |
53 |
805 |
675 |
213 |
512 |
727 |
17,339 |
15,486 |
2 |
5 |
65 |
242 |
117 |
|
Georgia |
— |
12 |
34 |
432 |
485 |
127 |
285 |
364 |
9,038 |
10,542 |
2 |
4 |
8 |
132 |
132 |
|
Maryland |
4 |
4 |
13 |
149 |
147 |
108 |
161 |
252 |
5,313 |
3,937 |
— |
2 |
6 |
79 |
56 |
|
North Carolina |
N |
0 |
0 |
N |
N |
19 |
325 |
822 |
7,558 |
12,388 |
— |
3 |
8 |
119 |
118 |
|
South Carolina |
— |
2 |
9 |
63 |
72 |
140 |
178 |
264 |
5,980 |
5,291 |
— |
2 |
5 |
62 |
71 |
|
Virginia |
3 |
6 |
26 |
187 |
150 |
186 |
146 |
776 |
7,355 |
5,696 |
2 |
2 |
16 |
85 |
69 |
|
West Virginia |
— |
1 |
6 |
44 |
42 |
13 |
16 |
29 |
553 |
517 |
— |
0 |
3 |
22 |
34 |
|
E.S. Central |
— |
4 |
13 |
173 |
122 |
231 |
544 |
723 |
16,947 |
16,173 |
1 |
6 |
19 |
229 |
207 |
|
Alabama |
— |
4 |
13 |
173 |
122 |
— |
152 |
236 |
4,663 |
4,948 |
— |
1 |
5 |
52 |
59 |
|
Kentucky |
N |
0 |
0 |
N |
N |
150 |
98 |
405 |
3,090 |
2,365 |
1 |
1 |
4 |
38 |
29 |
|
Mississippi |
N |
0 |
0 |
N |
N |
— |
125 |
239 |
3,706 |
3,243 |
— |
1 |
5 |
36 |
30 |
|
Tennessee |
N |
0 |
0 |
N |
N |
81 |
168 |
240 |
5,488 |
5,617 |
— |
3 |
11 |
103 |
89 |
|
W.S. Central |
3 |
6 |
20 |
191 |
202 |
1,323 |
1,214 |
1,917 |
41,603 |
39,011 |
4 |
7 |
21 |
320 |
164 |
|
Arkansas |
3 |
3 |
12 |
100 |
66 |
131 |
108 |
222 |
3,287 |
2,462 |
— |
1 |
5 |
32 |
32 |
|
Louisiana |
— |
3 |
12 |
91 |
136 |
328 |
184 |
1,077 |
6,722 |
6,128 |
— |
1 |
5 |
42 |
46 |
|
Oklahoma |
N |
0 |
0 |
N |
N |
14 |
106 |
171 |
3,314 |
4,234 |
— |
1 |
15 |
51 |
79 |
|
Texas |
N |
0 |
0 |
N |
N |
850 |
818 |
1,422 |
28,280 |
26,187 |
4 |
4 |
12 |
195 |
7 |
|
Mountain |
8 |
15 |
35 |
446 |
729 |
157 |
465 |
622 |
15,957 |
13,784 |
1 |
7 |
17 |
233 |
281 |
|
Arizona |
1 |
3 |
7 |
92 |
98 |
113 |
177 |
258 |
6,018 |
5,213 |
— |
2 |
11 |
85 |
102 |
|
Colorado |
— |
0 |
14 |
— |
228 |
— |
102 |
253 |
3,538 |
2,727 |
1 |
1 |
6 |
50 |
66 |
|
Idaho |
4 |
3 |
13 |
125 |
105 |
1 |
12 |
36 |
401 |
268 |
— |
0 |
3 |
22 |
15 |
|
Montana |
2 |
2 |
8 |
70 |
59 |
10 |
18 |
30 |
599 |
538 |
— |
0 |
2 |
12 |
8 |
|
Nevada |
— |
0 |
4 |
14 |
34 |
— |
59 |
96 |
1,904 |
2,371 |
— |
0 |
3 |
6 |
20 |
|
New Mexico |
— |
1 |
4 |
37 |
54 |
3 |
55 |
97 |
1,983 |
1,602 |
— |
1 |
4 |
37 |
41 |
|
Utah |
1 |
3 |
7 |
88 |
130 |
30 |
37 |
58 |
1,375 |
953 |
— |
1 |
4 |
20 |
27 |
|
Wyoming |
— |
0 |
4 |
20 |
21 |
— |
3 |
15 |
139 |
112 |
— |
0 |
2 |
1 |
2 |
|
Pacific |
28 |
64 |
647 |
2,298 |
1,656 |
756 |
1,402 |
1,579 |
48,368 |
43,735 |
1 |
4 |
12 |
147 |
147 |
|
Alaska |
5 |
1 |
6 |
45 |
58 |
— |
21 |
34 |
647 |
732 |
— |
0 |
3 |
14 |
18 |
|
California |
13 |
48 |
72 |
1,654 |
1,342 |
548 |
1,153 |
1,324 |
40,378 |
35,561 |
— |
1 |
4 |
42 |
50 |
|
Hawaii |
— |
0 |
4 |
23 |
22 |
— |
23 |
46 |
775 |
843 |
— |
0 |
6 |
26 |
7 |
|
Oregon |
5 |
6 |
14 |
209 |
234 |
89 |
73 |
102 |
2,635 |
1,960 |
1 |
1 |
4 |
59 |
72 |
|
Washington |
5 |
5 |
601 |
367 |
— |
119 |
125 |
211 |
3,933 |
4,639 |
— |
0 |
5 |
6 |
— |
|
Territories |
|||||||||||||||
|
American Samoa |
— |
0 |
0 |
— |
— |
— |
0 |
0 |
— |
— |
— |
0 |
0 |
— |
— |
|
C.N.M.I. |
— |
— |
— |
— |
— |
— |
— |
— |
— |
— |
— |
— |
— |
— |
— |
|
Guam |
— |
0 |
0 |
— |
1 |
— |
0 |
0 |
— |
— |
— |
0 |
0 |
— |
— |
|
Puerto Rico |
— |
0 |
1 |
7 |
17 |
3 |
12 |
40 |
393 |
341 |
— |
0 |
1 |
4 |
— |
|
U.S. Virgin Islands |
— |
0 |
0 |
— |
— |
— |
0 |
4 |
15 |
41 |
N |
0 |
0 |
N |
N |
|
C.N.M.I.: Commonwealth of Northern Mariana Islands. U: Unavailable. —: No reported cases. N: Not reportable. NN: Not Nationally Notifiable. NP: Nationally notifiable but not published. Cum: Cumulative year-to-date counts. Med: Median. Max: Maximum. * Three low incidence conditions, rubella, rubella congenital, and tetanus, are in Table II to facilitate case count verification with reporting jurisdictions. † Case counts for reporting year 2015 and 2016 are provisional and subject to change. For further information on interpretation of these data, see http://wwwn.cdc.gov/nndss/document/ProvisionalNationaNotifiableDiseasesSurveillanceData20100927.pdf. Data for TB are displayed in Table IV, which appears quarterly. § Data for H. influenzae (age <5 for serotype b, non typable serotype, other serotype, and unknown serotype) are available in Table I. |
|||||||||||||||
|
TABLE II. (Continued) Provisional cases of selected notifiable diseases (≥1,000 cases reported during the preceding year), and selected* low frequency diseases, United States and U.S. territories, weeks ending September 3, 2016, and September 5, 2015 (35th week)† (Export data) |
|||||||||||||||
|
Reporting area |
Hepatitis (viral, acute), by type |
||||||||||||||
|
A |
B |
C |
|||||||||||||
|
Current week |
Previous 52 weeks |
Cum 2016 |
Cum 2015 |
Current week |
Previous 52 weeks |
Cum 2016 |
Cum 2015 |
Current week |
Previous 52 weeks |
Cum 2016 |
Cum 2015 |
||||
|
Med |
Max |
Med |
Max |
Med |
Max |
||||||||||
|
United States |
52 |
27 |
72 |
1,142 |
910 |
21 |
53 |
128 |
1,662 |
2,236 |
18 |
44 |
140 |
1,353 |
1,577 |
|
New England |
1 |
1 |
4 |
55 |
42 |
— |
1 |
4 |
46 |
27 |
1 |
5 |
11 |
153 |
209 |
|
Connecticut |
— |
0 |
2 |
6 |
7 |
— |
0 |
1 |
2 |
5 |
— |
0 |
2 |
13 |
11 |
|
Maine |
— |
0 |
1 |
4 |
4 |
— |
1 |
3 |
28 |
1 |
— |
0 |
2 |
13 |
21 |
|
Massachusetts |
1 |
1 |
4 |
36 |
25 |
— |
0 |
3 |
14 |
19 |
1 |
4 |
9 |
122 |
177 |
|
New Hampshire |
— |
0 |
1 |
3 |
— |
— |
0 |
0 |
— |
— |
N |
0 |
0 |
N |
N |
|
Rhode Island |
— |
0 |
2 |
3 |
4 |
U |
0 |
0 |
U |
U |
U |
0 |
0 |
U |
U |
|
Vermont |
— |
0 |
1 |
3 |
2 |
— |
0 |
1 |
2 |
2 |
— |
0 |
1 |
5 |
— |
|
Mid. Atlantic |
6 |
4 |
11 |
145 |
156 |
3 |
4 |
8 |
119 |
156 |
7 |
7 |
13 |
230 |
262 |
|
New Jersey |
— |
1 |
3 |
44 |
42 |
— |
1 |
4 |
19 |
65 |
— |
1 |
4 |
26 |
94 |
|
New York (Upstate) |
3 |
1 |
6 |
36 |
26 |
1 |
1 |
4 |
26 |
23 |
6 |
3 |
8 |
113 |
67 |
|
New York City |
1 |
1 |
3 |
30 |
57 |
2 |
1 |
3 |
44 |
32 |
— |
0 |
1 |
4 |
6 |
|
Pennsylvania |
2 |
1 |
4 |
35 |
31 |
— |
1 |
4 |
30 |
36 |
1 |
2 |
8 |
87 |
95 |
|
E.N. Central |
1 |
3 |
8 |
96 |
117 |
1 |
9 |
17 |
313 |
474 |
2 |
8 |
18 |
283 |
292 |
|
Illinois |
— |
1 |
5 |
34 |
42 |
— |
0 |
2 |
22 |
46 |
— |
0 |
3 |
18 |
18 |
|
Indiana |
— |
0 |
3 |
11 |
11 |
— |
1 |
5 |
51 |
101 |
— |
2 |
7 |
59 |
86 |
|
Michigan |
— |
1 |
3 |
30 |
31 |
— |
1 |
4 |
34 |
35 |
1 |
2 |
5 |
72 |
57 |
|
Ohio |
1 |
0 |
3 |
20 |
25 |
1 |
6 |
12 |
200 |
288 |
1 |
3 |
10 |
108 |
82 |
|
Wisconsin |
— |
0 |
1 |
1 |
8 |
— |
0 |
1 |
6 |
4 |
— |
1 |
3 |
26 |
49 |
|
W.N. Central |
1 |
1 |
3 |
27 |
48 |
— |
1 |
5 |
31 |
61 |
— |
1 |
4 |
32 |
45 |
|
Iowa |
— |
0 |
2 |
8 |
10 |
— |
0 |
2 |
7 |
13 |
— |
0 |
0 |
— |
— |
|
Kansas |
— |
0 |
1 |
3 |
4 |
— |
0 |
2 |
12 |
7 |
— |
0 |
2 |
7 |
16 |
|
Minnesota |
— |
0 |
1 |
1 |
18 |
— |
0 |
2 |
4 |
12 |
— |
0 |
3 |
11 |
20 |
|
Missouri |
— |
0 |
2 |
— |
6 |
— |
0 |
3 |
— |
27 |
— |
0 |
1 |
— |
5 |
|
Nebraska |
1 |
0 |
2 |
13 |
5 |
— |
0 |
2 |
5 |
— |
— |
0 |
1 |
3 |
4 |
|
North Dakota |
— |
0 |
1 |
2 |
3 |
— |
0 |
1 |
1 |
— |
— |
0 |
1 |
1 |
— |
|
South Dakota |
— |
0 |
1 |
— |
2 |
— |
0 |
1 |
2 |
2 |
— |
0 |
2 |
10 |
— |
|
S. Atlantic |
36 |
7 |
33 |
306 |
171 |
12 |
20 |
34 |
664 |
758 |
2 |
10 |
20 |
341 |
338 |
|
Delaware |
— |
0 |
1 |
1 |
2 |
— |
0 |
1 |
1 |
8 |
U |
0 |
0 |
U |
U |
|
District of Columbia |
U |
0 |
0 |
U |
U |
U |
0 |
0 |
U |
U |
U |
0 |
0 |
U |
U |
|
Florida |
1 |
2 |
7 |
77 |
70 |
11 |
10 |
17 |
331 |
282 |
1 |
4 |
11 |
163 |
69 |
|
Georgia |
2 |
1 |
3 |
44 |
21 |
1 |
2 |
6 |
60 |
84 |
— |
1 |
4 |
29 |
61 |
|
Maryland |
3 |
0 |
3 |
19 |
12 |
— |
0 |
4 |
19 |
28 |
— |
1 |
4 |
26 |
25 |
|
North Carolina |
— |
1 |
4 |
32 |
31 |
— |
2 |
9 |
55 |
120 |
— |
2 |
7 |
49 |
100 |
|
South Carolina |
1 |
0 |
3 |
10 |
7 |
— |
0 |
2 |
20 |
18 |
— |
0 |
2 |
7 |
2 |
|
Virginia |
29 |
2 |
24 |
120 |
23 |
— |
1 |
11 |
31 |
40 |
1 |
1 |
4 |
28 |
32 |
|
West Virginia |
— |
0 |
1 |
3 |
5 |
— |
5 |
12 |
147 |
178 |
— |
1 |
4 |
39 |
49 |
|
E.S. Central |
— |
1 |
4 |
22 |
37 |
2 |
8 |
21 |
231 |
379 |
— |
5 |
10 |
139 |
249 |
|
Alabama |
— |
0 |
2 |
13 |
15 |
— |
1 |
5 |
40 |
74 |
— |
1 |
4 |
24 |
52 |
|
Kentucky |
— |
0 |
2 |
4 |
12 |
— |
2 |
9 |
52 |
107 |
— |
1 |
5 |
32 |
79 |
|
Mississippi |
— |
0 |
1 |
2 |
— |
— |
0 |
3 |
14 |
34 |
U |
0 |
0 |
U |
U |
|
Tennessee |
— |
0 |
2 |
3 |
10 |
2 |
4 |
8 |
125 |
164 |
— |
3 |
8 |
83 |
118 |
|
W.S. Central |
4 |
3 |
13 |
111 |
109 |
2 |
5 |
25 |
135 |
186 |
3 |
1 |
27 |
46 |
54 |
|
Arkansas |
— |
0 |
3 |
9 |
6 |
— |
1 |
4 |
32 |
19 |
— |
0 |
1 |
— |
1 |
|
Louisiana |
— |
0 |
1 |
9 |
3 |
— |
1 |
7 |
27 |
58 |
— |
0 |
2 |
5 |
20 |
|
Oklahoma |
— |
0 |
3 |
5 |
6 |
— |
0 |
10 |
5 |
17 |
1 |
0 |
25 |
15 |
5 |
|
Texas |
4 |
3 |
11 |
88 |
94 |
2 |
3 |
12 |
71 |
92 |
2 |
0 |
4 |
26 |
28 |
|
Mountain |
1 |
1 |
6 |
48 |
83 |
— |
1 |
8 |
17 |
64 |
2 |
2 |
9 |
57 |
84 |
|
Arizona |
— |
1 |
4 |
22 |
31 |
— |
0 |
3 |
8 |
12 |
U |
0 |
0 |
U |
U |
|
Colorado |
— |
0 |
2 |
11 |
21 |
— |
0 |
4 |
— |
16 |
2 |
0 |
3 |
7 |
28 |
|
Idaho |
— |
0 |
1 |
3 |
7 |
— |
0 |
1 |
6 |
7 |
— |
0 |
1 |
3 |
2 |
|
Montana |
1 |
0 |
1 |
2 |
1 |
— |
0 |
1 |
1 |
2 |
— |
0 |
2 |
13 |
10 |
|
Nevada |
— |
0 |
1 |
2 |
8 |
— |
0 |
2 |
1 |
17 |
— |
0 |
1 |
1 |
9 |
|
New Mexico |
— |
0 |
1 |
1 |
6 |
— |
0 |
0 |
— |
2 |
— |
0 |
4 |
7 |
18 |
|
Utah |
— |
0 |
1 |
7 |
6 |
— |
0 |
1 |
1 |
8 |
— |
1 |
4 |
26 |
17 |
|
Wyoming |
— |
0 |
0 |
— |
3 |
U |
0 |
0 |
U |
U |
U |
0 |
0 |
U |
U |
|
Pacific |
2 |
5 |
34 |
332 |
147 |
1 |
3 |
37 |
106 |
131 |
1 |
2 |
64 |
72 |
44 |
|
Alaska |
— |
0 |
1 |
1 |
4 |
— |
0 |
1 |
3 |
1 |
N |
0 |
0 |
N |
N |
|
California |
1 |
3 |
10 |
123 |
119 |
— |
2 |
8 |
68 |
107 |
— |
1 |
3 |
24 |
37 |
|
Hawaii |
— |
0 |
32 |
187 |
5 |
— |
0 |
1 |
1 |
9 |
— |
0 |
0 |
— |
— |
|
Oregon |
— |
0 |
3 |
8 |
19 |
— |
0 |
2 |
9 |
14 |
— |
0 |
1 |
9 |
7 |
|
Washington |
1 |
0 |
26 |
13 |
— |
1 |
0 |
34 |
25 |
— |
1 |
0 |
63 |
39 |
— |
|
Territories |
|||||||||||||||
|
American Samoa |
— |
0 |
0 |
— |
— |
— |
0 |
0 |
— |
— |
— |
0 |
0 |
— |
— |
|
C.N.M.I. |
— |
— |
— |
— |
— |
— |
— |
— |
— |
— |
— |
— |
— |
— |
— |
|
Guam |
— |
0 |
2 |
— |
44 |
— |
0 |
0 |
— |
— |
— |
0 |
0 |
— |
— |
|
Puerto Rico |
— |
0 |
1 |
2 |
2 |
— |
0 |
2 |
9 |
21 |
N |
0 |
0 |
N |
N |
|
U.S. Virgin Islands |
— |
0 |
0 |
— |
— |
— |
0 |
0 |
— |
— |
— |
0 |
0 |
— |
— |
|
C.N.M.I.: Commonwealth of Northern Mariana Islands. U: Unavailable. —: No reported cases. N: Not reportable. NN: Not Nationally Notifiable. NP: Nationally notifiable but not published. Cum: Cumulative year-to-date counts. Med: Median. Max: Maximum. * Three low incidence conditions, rubella, rubella congenital, and tetanus, are in Table II to facilitate case count verification with reporting jurisdictions. † Case counts for reporting year 2015 and 2016 are provisional and subject to change. For further information on interpretation of these data, see http://wwwn.cdc.gov/nndss/document/ProvisionalNationaNotifiableDiseasesSurveillanceData20100927.pdf. Data for TB are displayed in Table IV, which appears quarterly. |
|||||||||||||||
|
TABLE II. (Continued) Provisional cases of selected notifiable diseases (≥1,000 cases reported during the preceding year), and selected* low frequency diseases, United States and U.S. territories, weeks ending September 3, 2016, and September 5, 2015 (35th week)† (Export data) |
|||||||||||||||
|
Reporting area |
Invasive Pneumococcal Disease§ |
Legionellosis |
|||||||||||||
|
All ages |
Age <5 |
||||||||||||||
|
Current week |
Previous 52 weeks |
Cum 2016 |
Cum 2015 |
Current week |
Previous 52 weeks |
Cum 2016 |
Cum 2015 |
Current week |
Previous 52 weeks |
Cum 2016 |
Cum 2015 |
||||
|
Med |
Max |
Med |
Max |
Med |
Max |
||||||||||
|
United States |
69 |
295 |
727 |
10,108 |
10,777 |
5 |
23 |
36 |
641 |
729 |
78 |
83 |
182 |
2,596 |
4,056 |
|
New England |
6 |
20 |
42 |
726 |
738 |
— |
1 |
4 |
41 |
33 |
2 |
4 |
13 |
110 |
191 |
|
Connecticut |
— |
4 |
9 |
134 |
166 |
— |
0 |
1 |
7 |
4 |
— |
1 |
3 |
18 |
38 |
|
Maine |
— |
2 |
9 |
88 |
98 |
— |
0 |
2 |
6 |
3 |
— |
0 |
2 |
10 |
9 |
|
Massachusetts |
4 |
10 |
20 |
347 |
328 |
— |
0 |
3 |
23 |
17 |
2 |
2 |
7 |
58 |
100 |
|
New Hampshire |
— |
2 |
6 |
62 |
61 |
— |
0 |
2 |
1 |
5 |
— |
0 |
3 |
10 |
21 |
|
Rhode Island |
— |
0 |
7 |
39 |
45 |
— |
0 |
1 |
2 |
1 |
— |
0 |
6 |
10 |
9 |
|
Vermont |
2 |
1 |
10 |
56 |
40 |
— |
0 |
2 |
2 |
3 |
— |
0 |
3 |
4 |
14 |
|
Mid. Atlantic |
9 |
45 |
129 |
1,396 |
1,689 |
— |
2 |
8 |
70 |
74 |
17 |
17 |
56 |
535 |
993 |
|
New Jersey |
— |
0 |
20 |
3 |
370 |
— |
0 |
4 |
— |
13 |
— |
0 |
11 |
8 |
146 |
|
New York (Upstate) |
— |
17 |
71 |
595 |
535 |
— |
1 |
4 |
35 |
23 |
— |
5 |
16 |
177 |
290 |
|
New York City |
5 |
13 |
23 |
430 |
461 |
— |
1 |
3 |
17 |
22 |
11 |
4 |
27 |
151 |
320 |
|
Pennsylvania |
4 |
9 |
24 |
368 |
323 |
— |
0 |
3 |
18 |
16 |
6 |
6 |
23 |
199 |
237 |
|
E.N. Central |
9 |
58 |
127 |
1,925 |
1,876 |
— |
3 |
8 |
96 |
107 |
33 |
18 |
64 |
536 |
992 |
|
Illinois |
N |
0 |
0 |
N |
N |
— |
0 |
0 |
— |
3 |
— |
4 |
28 |
131 |
208 |
|
Indiana |
— |
11 |
30 |
359 |
398 |
— |
0 |
3 |
8 |
23 |
1 |
2 |
11 |
65 |
123 |
|
Michigan |
2 |
16 |
46 |
581 |
523 |
— |
0 |
4 |
27 |
31 |
— |
2 |
13 |
57 |
176 |
|
Ohio |
5 |
20 |
41 |
706 |
672 |
— |
1 |
5 |
46 |
30 |
32 |
6 |
23 |
272 |
425 |
|
Wisconsin |
2 |
7 |
25 |
279 |
283 |
— |
0 |
2 |
15 |
20 |
— |
0 |
7 |
11 |
60 |
|
W.N. Central |
3 |
14 |
29 |
406 |
682 |
— |
1 |
4 |
23 |
57 |
— |
4 |
16 |
192 |
216 |
|
Iowa |
N |
0 |
0 |
N |
N |
N |
0 |
0 |
N |
N |
— |
0 |
3 |
19 |
27 |
|
Kansas |
— |
4 |
9 |
135 |
116 |
— |
0 |
2 |
8 |
12 |
— |
0 |
4 |
13 |
22 |
|
Minnesota |
— |
0 |
19 |
— |
344 |
— |
0 |
2 |
— |
24 |
— |
1 |
7 |
46 |
32 |
|
Missouri |
— |
0 |
1 |
1 |
— |
— |
0 |
2 |
— |
10 |
— |
2 |
12 |
97 |
116 |
|
Nebraska |
3 |
3 |
8 |
133 |
93 |
— |
0 |
2 |
13 |
6 |
— |
0 |
2 |
9 |
12 |
|
North Dakota |
— |
1 |
5 |
48 |
57 |
— |
0 |
1 |
2 |
5 |
— |
0 |
1 |
3 |
2 |
|
South Dakota |
— |
2 |
9 |
89 |
72 |
N |
0 |
0 |
N |
N |
— |
0 |
2 |
5 |
5 |
|
S. Atlantic |
11 |
52 |
119 |
1,876 |
1,799 |
3 |
4 |
11 |
139 |
149 |
13 |
18 |
32 |
547 |
648 |
|
Delaware |
— |
1 |
5 |
40 |
53 |
— |
0 |
1 |
— |
3 |
1 |
0 |
2 |
11 |
17 |
|
District of Columbia |
N |
0 |
0 |
N |
N |
— |
0 |
1 |
— |
4 |
N |
0 |
0 |
N |
N |
|
Florida |
1 |
10 |
59 |
462 |
285 |
1 |
1 |
5 |
43 |
40 |
8 |
5 |
11 |
180 |
198 |
|
Georgia |
6 |
17 |
37 |
629 |
682 |
1 |
1 |
5 |
43 |
47 |
1 |
2 |
7 |
67 |
74 |
|
Maryland |
3 |
8 |
21 |
313 |
292 |
1 |
0 |
3 |
21 |
16 |
3 |
2 |
9 |
84 |
109 |
|
North Carolina |
N |
0 |
0 |
N |
N |
N |
0 |
0 |
N |
N |
— |
3 |
9 |
103 |
103 |
|
South Carolina |
1 |
6 |
18 |
237 |
312 |
— |
0 |
2 |
8 |
14 |
— |
1 |
3 |
17 |
40 |
|
Virginia |
— |
0 |
2 |
17 |
16 |
— |
0 |
2 |
17 |
16 |
— |
3 |
7 |
77 |
86 |
|
West Virginia |
— |
4 |
17 |
178 |
159 |
— |
0 |
2 |
7 |
9 |
— |
0 |
3 |
8 |
21 |
|
E.S. Central |
10 |
32 |
71 |
1,075 |
1,101 |
— |
2 |
6 |
57 |
75 |
2 |
4 |
10 |
166 |
229 |
|
Alabama |
— |
6 |
18 |
216 |
184 |
— |
0 |
5 |
18 |
19 |
— |
1 |
3 |
31 |
45 |
|
Kentucky |
— |
4 |
11 |
163 |
152 |
— |
0 |
2 |
4 |
3 |
— |
1 |
4 |
39 |
61 |
|
Mississippi |
2 |
5 |
13 |
151 |
145 |
— |
0 |
2 |
12 |
17 |
— |
0 |
3 |
13 |
30 |
|
Tennessee |
8 |
15 |
35 |
545 |
620 |
— |
1 |
3 |
23 |
36 |
2 |
2 |
7 |
83 |
93 |
|
W.S. Central |
8 |
40 |
244 |
1,521 |
1,462 |
1 |
4 |
16 |
133 |
135 |
7 |
6 |
32 |
176 |
256 |
|
Arkansas |
2 |
5 |
24 |
173 |
205 |
— |
0 |
3 |
14 |
16 |
1 |
0 |
6 |
28 |
26 |
|
Louisiana |
— |
6 |
16 |
226 |
238 |
— |
0 |
3 |
21 |
15 |
— |
0 |
3 |
7 |
29 |
|
Oklahoma |
N |
0 |
0 |
N |
N |
1 |
0 |
2 |
9 |
10 |
— |
0 |
10 |
3 |
25 |
|
Texas |
6 |
28 |
217 |
1,122 |
1,019 |
— |
3 |
14 |
89 |
94 |
6 |
4 |
21 |
138 |
176 |
|
Mountain |
8 |
28 |
65 |
1,046 |
1,314 |
1 |
2 |
6 |
76 |
91 |
2 |
3 |
10 |
90 |
163 |
|
Arizona |
7 |
10 |
37 |
544 |
470 |
1 |
1 |
4 |
37 |
31 |
1 |
1 |
4 |
48 |
65 |
|
Colorado |
— |
0 |
21 |
— |
331 |
— |
0 |
2 |
— |
19 |
— |
0 |
7 |
3 |
33 |
|
Idaho |
N |
0 |
0 |
N |
N |
— |
0 |
1 |
7 |
7 |
— |
0 |
1 |
9 |
8 |
|
Montana |
— |
1 |
6 |
67 |
43 |
— |
0 |
1 |
2 |
— |
— |
0 |
2 |
7 |
4 |
|
Nevada |
— |
2 |
10 |
57 |
116 |
— |
0 |
1 |
4 |
9 |
— |
0 |
2 |
3 |
17 |
|
New Mexico |
1 |
5 |
15 |
217 |
211 |
— |
0 |
2 |
10 |
13 |
1 |
0 |
2 |
7 |
8 |
|
Utah |
— |
4 |
9 |
138 |
127 |
— |
0 |
3 |
15 |
11 |
— |
0 |
2 |
11 |
24 |
|
Wyoming |
— |
0 |
3 |
23 |
16 |
— |
0 |
1 |
1 |
1 |
— |
0 |
1 |
2 |
4 |
|
Pacific |
5 |
3 |
12 |
137 |
116 |
— |
0 |
1 |
6 |
8 |
2 |
7 |
70 |
244 |
368 |
|
Alaska |
5 |
2 |
10 |
84 |
70 |
— |
0 |
1 |
6 |
6 |
— |
0 |
1 |
1 |
— |
|
California |
N |
0 |
0 |
N |
N |
N |
0 |
0 |
N |
N |
2 |
6 |
16 |
195 |
330 |
|
Hawaii |
— |
1 |
6 |
53 |
46 |
— |
0 |
1 |
— |
2 |
— |
0 |
1 |
3 |
6 |
|
Oregon |
N |
0 |
0 |
N |
N |
N |
0 |
0 |
N |
N |
— |
1 |
3 |
20 |
32 |
|
Washington |
N |
0 |
0 |
N |
N |
N |
0 |
0 |
N |
N |
— |
0 |
56 |
25 |
— |
|
Territories |
|||||||||||||||
|
American Samoa |
N |
0 |
0 |
N |
N |
— |
0 |
0 |
— |
— |
N |
0 |
0 |
N |
N |
|
C.N.M.I. |
— |
— |
— |
— |
— |
— |
— |
— |
— |
— |
— |
— |
— |
— |
— |
|
Guam |
— |
0 |
0 |
— |
— |
— |
0 |
0 |
— |
— |
— |
0 |
0 |
— |
— |
|
Puerto Rico |
— |
0 |
0 |
— |
— |
— |
0 |
0 |
— |
— |
— |
0 |
1 |
5 |
12 |
|
U.S. Virgin Islands |
— |
0 |
0 |
— |
— |
— |
0 |
0 |
— |
— |
— |
0 |
0 |
— |
— |
|
C.N.M.I.: Commonwealth of Northern Mariana Islands. U: Unavailable. —: No reported cases. N: Not reportable. NN: Not Nationally Notifiable. NP: Nationally notifiable but not published. Cum: Cumulative year-to-date counts. Med: Median. Max: Maximum. * Three low incidence conditions, rubella, rubella congenital, and tetanus, are in Table II to facilitate case count verification with reporting jurisdictions. † Case counts for reporting year 2015 and 2016 are provisional and subject to change. For further information on interpretation of these data, see http://wwwn.cdc.gov/nndss/document/ProvisionalNationaNotifiableDiseasesSurveillanceData20100927.pdf. Data for TB are displayed in Table IV, which appears quarterly. § Includes drug resistant and susceptible cases of Invasive Pneumococcal Disease. This condition was previously named Streptococcus pneumoniae invasive disease and cases were reported to CDC using different event codes to specify whether the cases were drug resistant or in a defined age group, such as <5 years. |
|||||||||||||||
|
TABLE II. (Continued) Provisional cases of selected notifiable diseases (≥1,000 cases reported during the preceding year), and selected* low frequency diseases, United States and U.S. territories, weeks ending September 3, 2016, and September 5, 2015 (35th week)† (Export data) |
|||||||||||||||
|
Reporting area |
Lyme disease |
Malaria |
Meningococcal disease, invasive§ All serogroups |
||||||||||||
|
Current week |
Previous 52 weeks |
Cum 2016 |
Cum 2015 |
Current week |
Previous 52 weeks |
Cum 2016 |
Cum 2015 |
Current week |
Previous 52 weeks |
Cum 2016 |
Cum 2015 |
||||
|
Med |
Max |
Med |
Max |
Med |
Max |
||||||||||
|
United States |
232 |
481 |
1,526 |
20,654 |
29,189 |
27 |
30 |
54 |
973 |
872 |
4 |
6 |
20 |
250 |
255 |
|
New England |
— |
72 |
263 |
2,558 |
8,261 |
1 |
2 |
5 |
72 |
60 |
— |
0 |
2 |
9 |
19 |
|
Connecticut |
— |
24 |
65 |
688 |
2,068 |
— |
0 |
1 |
1 |
8 |
— |
0 |
1 |
1 |
4 |
|
Maine |
— |
14 |
75 |
679 |
891 |
— |
0 |
1 |
8 |
5 |
— |
0 |
1 |
1 |
4 |
|
Massachusetts |
— |
5 |
81 |
125 |
3,685 |
— |
1 |
4 |
48 |
34 |
— |
0 |
2 |
7 |
7 |
|
New Hampshire |
— |
6 |
38 |
467 |
524 |
— |
0 |
2 |
7 |
5 |
— |
0 |
1 |
— |
— |
|
Rhode Island |
— |
12 |
77 |
453 |
607 |
1 |
0 |
3 |
4 |
8 |
— |
0 |
1 |
— |
3 |
|
Vermont |
— |
4 |
55 |
146 |
486 |
— |
0 |
2 |
4 |
— |
— |
0 |
0 |
— |
1 |
|
Mid. Atlantic |
182 |
268 |
1,024 |
13,260 |
13,655 |
13 |
7 |
16 |
239 |
229 |
1 |
0 |
4 |
27 |
22 |
|
New Jersey |
— |
50 |
162 |
2,053 |
3,872 |
— |
1 |
4 |
38 |
55 |
— |
0 |
2 |
6 |
4 |
|
New York (Upstate) |
109 |
44 |
237 |
2,171 |
2,252 |
— |
1 |
8 |
41 |
28 |
1 |
0 |
1 |
7 |
6 |
|
New York City |
5 |
4 |
563 |
690 |
672 |
12 |
3 |
12 |
128 |
118 |
— |
0 |
2 |
8 |
6 |
|
Pennsylvania |
68 |
131 |
762 |
8,346 |
6,859 |
1 |
1 |
4 |
32 |
28 |
— |
0 |
2 |
6 |
6 |
|
E.N. Central |
6 |
25 |
178 |
1,756 |
2,193 |
1 |
2 |
11 |
96 |
82 |
— |
1 |
3 |
25 |
43 |
|
Illinois |
— |
2 |
26 |
162 |
247 |
— |
1 |
4 |
33 |
34 |
— |
0 |
2 |
9 |
14 |
|
Indiana |
— |
1 |
12 |
86 |
125 |
— |
0 |
2 |
6 |
8 |
— |
0 |
2 |
5 |
3 |
|
Michigan |
— |
2 |
14 |
117 |
105 |
1 |
0 |
3 |
20 |
10 |
— |
0 |
1 |
3 |
7 |
|
Ohio |
6 |
2 |
17 |
115 |
119 |
— |
0 |
4 |
28 |
27 |
— |
0 |
2 |
5 |
12 |
|
Wisconsin |
— |
16 |
131 |
1,276 |
1,597 |
— |
0 |
2 |
9 |
3 |
— |
0 |
1 |
3 |
7 |
|
W.N. Central |
— |
6 |
53 |
230 |
1,844 |
— |
1 |
5 |
29 |
69 |
— |
0 |
2 |
11 |
22 |
|
Iowa |
— |
3 |
20 |
169 |
275 |
— |
0 |
2 |
11 |
11 |
— |
0 |
1 |
2 |
5 |
|
Kansas |
— |
0 |
3 |
22 |
18 |
— |
0 |
1 |
3 |
5 |
— |
0 |
1 |
4 |
4 |
|
Minnesota |
— |
0 |
43 |
— |
1,510 |
— |
0 |
3 |
— |
28 |
— |
0 |
1 |
1 |
5 |
|
Missouri |
— |
0 |
1 |
— |
3 |
— |
0 |
2 |
— |
17 |
— |
0 |
1 |
— |
7 |
|
Nebraska |
— |
0 |
3 |
11 |
7 |
— |
0 |
1 |
5 |
3 |
— |
0 |
1 |
3 |
1 |
|
North Dakota |
— |
0 |
5 |
18 |
26 |
— |
0 |
1 |
6 |
2 |
— |
0 |
0 |
— |
— |
|
South Dakota |
— |
0 |
2 |
10 |
5 |
— |
0 |
1 |
4 |
3 |
— |
0 |
1 |
1 |
— |
|
S. Atlantic |
35 |
71 |
175 |
2,626 |
2,986 |
9 |
7 |
18 |
288 |
212 |
1 |
1 |
4 |
43 |
47 |
|
Delaware |
4 |
8 |
22 |
311 |
318 |
— |
0 |
2 |
11 |
2 |
— |
0 |
0 |
— |
— |
|
District of Columbia |
N |
0 |
0 |
N |
N |
— |
0 |
2 |
9 |
11 |
— |
0 |
0 |
— |
3 |
|
Florida |
5 |
2 |
14 |
118 |
105 |
1 |
1 |
4 |
45 |
25 |
1 |
0 |
2 |
11 |
17 |
|
Georgia |
— |
0 |
1 |
— |
7 |
— |
1 |
4 |
27 |
37 |
— |
0 |
3 |
12 |
11 |
|
Maryland |
2 |
27 |
106 |
1,204 |
1,252 |
7 |
3 |
9 |
131 |
77 |
— |
0 |
1 |
1 |
2 |
|
North Carolina |
— |
3 |
56 |
113 |
98 |
— |
0 |
6 |
17 |
14 |
— |
0 |
1 |
2 |
4 |
|
South Carolina |
— |
0 |
3 |
18 |
32 |
— |
0 |
1 |
4 |
3 |
— |
0 |
2 |
6 |
2 |
|
Virginia |
23 |
24 |
120 |
659 |
942 |
1 |
1 |
4 |
43 |
42 |
— |
0 |
2 |
8 |
8 |
|
West Virginia |
1 |
3 |
25 |
203 |
232 |
— |
0 |
1 |
1 |
1 |
— |
0 |
2 |
3 |
— |
|
E.S. Central |
— |
2 |
6 |
67 |
76 |
— |
0 |
2 |
23 |
24 |
— |
0 |
2 |
13 |
7 |
|
Alabama |
— |
1 |
3 |
32 |
19 |
— |
0 |
1 |
5 |
10 |
— |
0 |
1 |
5 |
4 |
|
Kentucky |
— |
0 |
4 |
18 |
39 |
— |
0 |
1 |
5 |
4 |
— |
0 |
1 |
1 |
1 |
|
Mississippi |
— |
0 |
1 |
— |
2 |
— |
0 |
1 |
4 |
1 |
— |
0 |
0 |
— |
— |
|
Tennessee |
— |
0 |
4 |
17 |
16 |
— |
0 |
2 |
9 |
9 |
— |
0 |
1 |
7 |
2 |
|
W.S. Central |
2 |
1 |
6 |
24 |
31 |
2 |
2 |
13 |
78 |
69 |
— |
0 |
3 |
25 |
30 |
|
Arkansas |
— |
0 |
0 |
— |
— |
— |
0 |
1 |
2 |
5 |
— |
0 |
1 |
1 |
2 |
|
Louisiana |
— |
0 |
0 |
— |
3 |
— |
0 |
2 |
7 |
7 |
— |
0 |
1 |
3 |
5 |
|
Oklahoma |
— |
0 |
0 |
— |
— |
1 |
0 |
5 |
3 |
5 |
— |
0 |
1 |
4 |
3 |
|
Texas |
2 |
1 |
6 |
24 |
28 |
1 |
2 |
8 |
66 |
52 |
— |
0 |
3 |
17 |
20 |
|
Mountain |
1 |
0 |
4 |
30 |
32 |
— |
1 |
4 |
38 |
40 |
— |
0 |
2 |
11 |
11 |
|
Arizona |
— |
0 |
2 |
8 |
7 |
— |
0 |
4 |
31 |
10 |
— |
0 |
1 |
2 |
4 |
|
Colorado |
— |
0 |
0 |
— |
— |
— |
0 |
2 |
— |
18 |
— |
0 |
1 |
3 |
3 |
|
Idaho |
1 |
0 |
3 |
13 |
6 |
— |
0 |
2 |
— |
2 |
— |
0 |
1 |
1 |
— |
|
Montana |
— |
0 |
1 |
5 |
4 |
— |
0 |
1 |
3 |
1 |
— |
0 |
1 |
1 |
— |
|
Nevada |
— |
0 |
1 |
2 |
7 |
— |
0 |
2 |
— |
3 |
— |
0 |
0 |
— |
1 |
|
New Mexico |
— |
0 |
1 |
1 |
— |
— |
0 |
1 |
2 |
2 |
— |
0 |
1 |
2 |
1 |
|
Utah |
— |
0 |
1 |
1 |
7 |
— |
0 |
2 |
1 |
3 |
— |
0 |
1 |
2 |
1 |
|
Wyoming |
— |
0 |
0 |
— |
1 |
— |
0 |
1 |
1 |
1 |
— |
0 |
0 |
— |
1 |
|
Pacific |
6 |
2 |
24 |
103 |
111 |
1 |
3 |
22 |
110 |
87 |
2 |
2 |
11 |
86 |
54 |
|
Alaska |
— |
0 |
2 |
12 |
4 |
— |
0 |
1 |
2 |
3 |
— |
0 |
2 |
4 |
2 |
|
California |
— |
1 |
4 |
33 |
79 |
1 |
2 |
4 |
64 |
71 |
— |
1 |
6 |
60 |
33 |
|
Hawaii |
N |
0 |
0 |
N |
N |
— |
0 |
1 |
1 |
— |
— |
0 |
2 |
1 |
2 |
|
Oregon |
1 |
1 |
4 |
50 |
28 |
— |
0 |
3 |
14 |
13 |
2 |
0 |
3 |
13 |
17 |
|
Washington |
5 |
0 |
24 |
8 |
— |
— |
0 |
21 |
29 |
— |
— |
0 |
10 |
8 |
— |
|
Territories |
|||||||||||||||
|
American Samoa |
N |
0 |
0 |
N |
N |
— |
0 |
0 |
— |
— |
— |
0 |
0 |
— |
— |
|
C.N.M.I. |
— |
— |
— |
— |
— |
— |
— |
— |
— |
— |
— |
— |
— |
— |
— |
|
Guam |
— |
0 |
0 |
— |
— |
— |
0 |
0 |
— |
— |
— |
0 |
0 |
— |
— |
|
Puerto Rico |
N |
0 |
0 |
N |
N |
— |
0 |
1 |
1 |
6 |
— |
0 |
0 |
— |
— |
|
U.S. Virgin Islands |
— |
0 |
0 |
— |
— |
— |
0 |
0 |
— |
— |
— |
0 |
0 |
— |
— |
|
C.N.M.I.: Commonwealth of Northern Mariana Islands. U: Unavailable. —: No reported cases. N: Not reportable. NN: Not Nationally Notifiable. NP: Nationally notifiable but not published. Cum: Cumulative year-to-date counts. Med: Median. Max: Maximum. * Three low incidence conditions, rubella, rubella congenital, and tetanus, are in Table II to facilitate case count verification with reporting jurisdictions. † Case counts for reporting year 2015 and 2016 are provisional and subject to change. For further information on interpretation of these data, see http://wwwn.cdc.gov/nndss/document/ProvisionalNationaNotifiableDiseasesSurveillanceData20100927.pdf. Data for TB are displayed in Table IV, which appears quarterly. § Data for meningococcal disease, invasive caused by serogroups ACWY, serogroup B, other serogroup, and unknown serogroup are available in Table I. |
|||||||||||||||
|
TABLE II. (Continued) Provisional cases of selected notifiable diseases (≥1,000 cases reported during the preceding year), and selected* low frequency diseases, United States and U.S. territories, weeks ending September 3, 2016, and September 5, 2015 (35th week)† (Export data) |
|||||||||||||||
|
Reporting area |
Mumps |
Pertussis |
Rabies, animal |
||||||||||||
|
Current week |
Previous 52 weeks |
Cum 2016 |
Cum 2015 |
Current week |
Previous 52 weeks |
Cum 2016 |
Cum 2015 |
Current week |
Previous 52 weeks |
Cum 2016 |
Cum 2015 |
||||
|
Med |
Max |
Med |
Max |
Med |
Max |
||||||||||
|
United States |
8 |
50 |
129 |
1,871 |
521 |
111 |
303 |
1,924 |
9,801 |
13,590 |
75 |
58 |
100 |
1,825 |
2,777 |
|
New England |
— |
1 |
38 |
255 |
9 |
5 |
12 |
30 |
484 |
479 |
2 |
5 |
10 |
176 |
175 |
|
Connecticut |
— |
0 |
12 |
34 |
1 |
— |
1 |
6 |
62 |
54 |
— |
2 |
5 |
67 |
115 |
|
Maine |
— |
0 |
1 |
4 |
— |
4 |
4 |
12 |
161 |
205 |
— |
1 |
6 |
46 |
19 |
|
Massachusetts |
— |
1 |
28 |
209 |
4 |
— |
3 |
10 |
90 |
166 |
— |
0 |
0 |
— |
— |
|
New Hampshire |
— |
0 |
5 |
7 |
2 |
— |
1 |
3 |
28 |
26 |
— |
0 |
2 |
14 |
15 |
|
Rhode Island |
— |
0 |
1 |
1 |
1 |
— |
0 |
16 |
59 |
15 |
— |
0 |
2 |
14 |
12 |
|
Vermont |
— |
0 |
0 |
— |
1 |
1 |
2 |
8 |
84 |
13 |
2 |
1 |
3 |
35 |
14 |
|
Mid. Atlantic |
6 |
2 |
14 |
118 |
106 |
27 |
53 |
92 |
1,820 |
1,518 |
14 |
10 |
33 |
349 |
475 |
|
New Jersey |
— |
0 |
3 |
18 |
21 |
— |
10 |
23 |
302 |
283 |
— |
0 |
0 |
— |
— |
|
New York (Upstate) |
6 |
0 |
10 |
64 |
17 |
16 |
13 |
50 |
467 |
360 |
14 |
7 |
33 |
349 |
246 |
|
New York City |
— |
1 |
10 |
32 |
60 |
— |
7 |
22 |
188 |
240 |
— |
0 |
1 |
— |
5 |
|
Pennsylvania |
— |
0 |
2 |
4 |
8 |
11 |
21 |
41 |
863 |
635 |
— |
0 |
15 |
— |
224 |
|
E.N. Central |
— |
16 |
54 |
616 |
214 |
17 |
67 |
146 |
2,238 |
1,822 |
8 |
1 |
19 |
88 |
124 |
|
Illinois |
— |
9 |
33 |
293 |
186 |
— |
18 |
31 |
568 |
414 |
3 |
1 |
18 |
49 |
72 |
|
Indiana |
— |
1 |
23 |
227 |
3 |
— |
3 |
9 |
100 |
151 |
— |
0 |
0 |
— |
— |
|
Michigan |
— |
0 |
2 |
11 |
2 |
1 |
7 |
19 |
207 |
330 |
— |
0 |
3 |
19 |
26 |
|
Ohio |
— |
0 |
20 |
65 |
16 |
16 |
18 |
40 |
645 |
499 |
5 |
0 |
5 |
20 |
26 |
|
Wisconsin |
— |
0 |
17 |
20 |
7 |
— |
20 |
93 |
718 |
428 |
N |
0 |
0 |
N |
N |
|
W.N. Central |
— |
19 |
48 |
639 |
58 |
— |
24 |
64 |
585 |
1,402 |
2 |
2 |
8 |
76 |
157 |
|
Iowa |
— |
16 |
47 |
553 |
29 |
— |
3 |
11 |
77 |
99 |
— |
0 |
0 |
— |
— |
|
Kansas |
— |
0 |
2 |
6 |
— |
— |
2 |
11 |
56 |
351 |
— |
1 |
8 |
43 |
84 |
|
Minnesota |
— |
0 |
4 |
21 |
4 |
— |
11 |
28 |
311 |
321 |
— |
0 |
0 |
— |
— |
|
Missouri |
— |
0 |
1 |
— |
23 |
— |
0 |
13 |
2 |
183 |
— |
0 |
4 |
4 |
22 |
|
Nebraska |
— |
0 |
10 |
45 |
2 |
— |
3 |
13 |
108 |
423 |
2 |
0 |
2 |
14 |
27 |
|
North Dakota |
— |
0 |
3 |
12 |
— |
— |
1 |
4 |
25 |
21 |
— |
0 |
0 |
— |
— |
|
South Dakota |
— |
0 |
2 |
2 |
— |
— |
0 |
2 |
6 |
4 |
— |
0 |
2 |
15 |
24 |
|
S. Atlantic |
2 |
1 |
8 |
57 |
56 |
4 |
25 |
77 |
831 |
1,161 |
8 |
14 |
27 |
484 |
791 |
|
Delaware |
— |
0 |
0 |
— |
2 |
— |
0 |
3 |
11 |
7 |
— |
0 |
0 |
— |
— |
|
District of Columbia |
— |
0 |
0 |
— |
— |
— |
0 |
0 |
— |
— |
— |
0 |
0 |
— |
— |
|
Florida |
1 |
0 |
2 |
12 |
8 |
4 |
7 |
16 |
244 |
241 |
— |
0 |
18 |
57 |
83 |
|
Georgia |
— |
0 |
1 |
1 |
— |
— |
3 |
16 |
111 |
163 |
— |
0 |
9 |
— |
182 |
|
Maryland |
— |
0 |
3 |
5 |
12 |
— |
2 |
7 |
65 |
87 |
— |
5 |
21 |
231 |
262 |
|
North Carolina |
— |
0 |
8 |
27 |
3 |
— |
7 |
31 |
180 |
267 |
8 |
5 |
10 |
173 |
236 |
|
South Carolina |
— |
0 |
1 |
4 |
— |
— |
2 |
8 |
90 |
115 |
N |
0 |
0 |
N |
N |
|
Virginia |
1 |
0 |
2 |
8 |
30 |
— |
4 |
35 |
112 |
230 |
— |
0 |
0 |
— |
— |
|
West Virginia |
— |
0 |
0 |
— |
1 |
— |
0 |
7 |
18 |
51 |
— |
0 |
3 |
23 |
28 |
|
E.S. Central |
— |
0 |
14 |
78 |
8 |
5 |
14 |
34 |
611 |
365 |
3 |
2 |
7 |
74 |
79 |
|
Alabama |
— |
0 |
1 |
1 |
1 |
— |
3 |
7 |
124 |
115 |
3 |
1 |
7 |
61 |
67 |
|
Kentucky |
— |
0 |
14 |
73 |
4 |
3 |
8 |
27 |
392 |
94 |
— |
0 |
5 |
12 |
9 |
|
Mississippi |
— |
0 |
1 |
1 |
— |
— |
0 |
1 |
1 |
10 |
— |
0 |
2 |
1 |
3 |
|
Tennessee |
— |
0 |
1 |
3 |
3 |
2 |
3 |
7 |
94 |
146 |
— |
0 |
0 |
— |
— |
|
W.S. Central |
— |
1 |
3 |
29 |
22 |
25 |
27 |
163 |
916 |
1,079 |
37 |
14 |
55 |
454 |
775 |
|
Arkansas |
— |
0 |
1 |
1 |
4 |
— |
1 |
7 |
27 |
34 |
— |
0 |
4 |
15 |
59 |
|
Louisiana |
— |
0 |
1 |
— |
1 |
— |
1 |
5 |
35 |
40 |
— |
0 |
0 |
— |
— |
|
Oklahoma |
— |
0 |
1 |
1 |
1 |
— |
0 |
54 |
75 |
27 |
— |
0 |
3 |
20 |
72 |
|
Texas |
— |
0 |
3 |
27 |
16 |
25 |
25 |
119 |
779 |
978 |
37 |
12 |
51 |
419 |
644 |
|
Mountain |
— |
0 |
6 |
39 |
16 |
15 |
34 |
72 |
994 |
2,084 |
— |
0 |
5 |
14 |
45 |
|
Arizona |
— |
0 |
1 |
4 |
2 |
— |
6 |
21 |
215 |
438 |
N |
0 |
0 |
N |
N |
|
Colorado |
— |
0 |
3 |
10 |
5 |
14 |
15 |
26 |
483 |
622 |
— |
0 |
0 |
— |
— |
|
Idaho |
— |
0 |
1 |
1 |
8 |
1 |
1 |
8 |
71 |
171 |
— |
0 |
3 |
8 |
7 |
|
Montana |
— |
0 |
6 |
20 |
— |
— |
0 |
3 |
13 |
221 |
— |
0 |
0 |
— |
— |
|
Nevada |
— |
0 |
1 |
1 |
— |
— |
0 |
7 |
1 |
91 |
— |
0 |
2 |
4 |
5 |
|
New Mexico |
— |
0 |
1 |
2 |
1 |
— |
3 |
13 |
90 |
121 |
— |
0 |
1 |
2 |
9 |
|
Utah |
— |
0 |
1 |
1 |
— |
— |
4 |
15 |
107 |
407 |
— |
0 |
2 |
— |
15 |
|
Wyoming |
— |
0 |
0 |
— |
— |
— |
0 |
4 |
14 |
13 |
— |
0 |
2 |
— |
9 |
|
Pacific |
— |
1 |
7 |
40 |
32 |
13 |
40 |
1,410 |
1,322 |
3,680 |
1 |
3 |
17 |
110 |
156 |
|
Alaska |
— |
0 |
2 |
2 |
— |
3 |
2 |
7 |
88 |
87 |
— |
0 |
3 |
9 |
3 |
|
California |
— |
0 |
3 |
29 |
28 |
— |
24 |
54 |
722 |
3,079 |
— |
2 |
14 |
94 |
141 |
|
Hawaii |
— |
0 |
1 |
2 |
1 |
— |
1 |
5 |
47 |
37 |
— |
0 |
0 |
— |
— |
|
Oregon |
— |
0 |
1 |
4 |
3 |
— |
5 |
14 |
138 |
477 |
1 |
0 |
3 |
7 |
12 |
|
Washington |
— |
0 |
7 |
3 |
— |
10 |
6 |
1,382 |
327 |
— |
— |
0 |
10 |
— |
— |
|
Territories |
|||||||||||||||
|
American Samoa |
— |
0 |
0 |
— |
— |
— |
0 |
0 |
— |
— |
U |
0 |
0 |
U |
U |
|
C.N.M.I. |
— |
— |
— |
— |
— |
— |
— |
— |
— |
— |
— |
— |
— |
— |
— |
|
Guam |
— |
0 |
0 |
— |
5 |
— |
0 |
7 |
— |
45 |
— |
0 |
0 |
— |
— |
|
Puerto Rico |
— |
0 |
1 |
1 |
3 |
— |
0 |
3 |
8 |
10 |
— |
0 |
1 |
— |
12 |
|
U.S. Virgin Islands |
— |
0 |
0 |
— |
— |
— |
0 |
0 |
— |
— |
— |
0 |
0 |
— |
— |
|
C.N.M.I.: Commonwealth of Northern Mariana Islands. U: Unavailable. —: No reported cases. N: Not reportable. NN: Not Nationally Notifiable. NP: Nationally notifiable but not published. Cum: Cumulative year-to-date counts. Med: Median. Max: Maximum. * Three low incidence conditions, rubella, rubella congenital, and tetanus, are in Table II to facilitate case count verification with reporting jurisdictions. † Case counts for reporting year 2015 and 2016 are provisional and subject to change. For further information on interpretation of these data, see http://wwwn.cdc.gov/nndss/document/ProvisionalNationaNotifiableDiseasesSurveillanceData20100927.pdf. Data for TB are displayed in Table IV, which appears quarterly. |
|||||||||||||||
|
TABLE II. (Continued) Provisional cases of selected notifiable diseases (≥1,000 cases reported during the preceding year), and selected* low frequency diseases, United States and U.S. territories, weeks ending September 3, 2016, and September 5, 2015 (35th week)† (Export data) |
|||||||||||||||
|
Reporting area |
Rubella |
Rubella, congenital syndrome |
Salmonellosis |
||||||||||||
|
Current week |
Previous 52 weeks |
Cum 2016 |
Cum 2015 |
Current week |
Previous 52 weeks |
Cum 2016 |
Cum 2015 |
Current week |
Previous 52 weeks |
Cum 2016 |
Cum 2015 |
||||
|
Med |
Max |
Med |
Max |
Med |
Max |
||||||||||
|
United States |
— |
0 |
2 |
3 |
2 |
— |
0 |
0 |
— |
1 |
668 |
914 |
2,254 |
27,584 |
34,253 |
|
New England |
— |
0 |
0 |
— |
— |
— |
0 |
0 |
— |
— |
20 |
37 |
87 |
1,378 |
1,488 |
|
Connecticut |
— |
0 |
0 |
— |
— |
— |
0 |
0 |
— |
— |
— |
7 |
22 |
256 |
328 |
|
Maine |
— |
0 |
0 |
— |
— |
— |
0 |
0 |
— |
— |
2 |
2 |
7 |
86 |
94 |
|
Massachusetts |
— |
0 |
0 |
— |
— |
— |
0 |
0 |
— |
— |
18 |
19 |
49 |
790 |
813 |
|
New Hampshire |
— |
0 |
0 |
— |
— |
— |
0 |
0 |
— |
— |
— |
3 |
9 |
85 |
129 |
|
Rhode Island |
— |
0 |
0 |
— |
— |
— |
0 |
0 |
— |
— |
— |
2 |
44 |
67 |
63 |
|
Vermont |
— |
0 |
0 |
— |
— |
— |
0 |
0 |
— |
— |
— |
1 |
10 |
94 |
61 |
|
Mid. Atlantic |
— |
0 |
0 |
— |
— |
— |
0 |
0 |
— |
1 |
68 |
83 |
166 |
2,680 |
3,363 |
|
New Jersey |
— |
0 |
0 |
— |
— |
— |
0 |
0 |
— |
— |
— |
11 |
43 |
289 |
831 |
|
New York (Upstate) |
— |
0 |
0 |
— |
— |
— |
0 |
0 |
— |
— |
— |
25 |
66 |
889 |
845 |
|
New York City |
— |
0 |
0 |
— |
— |
— |
0 |
0 |
— |
1 |
40 |
18 |
33 |
616 |
609 |
|
Pennsylvania |
— |
0 |
0 |
— |
— |
— |
0 |
0 |
— |
— |
28 |
25 |
56 |
886 |
1,078 |
|
E.N. Central |
— |
0 |
0 |
— |
1 |
— |
0 |
0 |
— |
— |
49 |
96 |
185 |
3,361 |
4,048 |
|
Illinois |
— |
0 |
0 |
— |
— |
— |
0 |
0 |
— |
— |
— |
29 |
66 |
919 |
1,275 |
|
Indiana |
— |
0 |
0 |
— |
— |
— |
0 |
0 |
— |
— |
— |
11 |
22 |
330 |
470 |
|
Michigan |
— |
0 |
0 |
— |
— |
— |
0 |
0 |
— |
— |
7 |
19 |
38 |
619 |
642 |
|
Ohio |
— |
0 |
0 |
— |
— |
— |
0 |
0 |
— |
— |
42 |
27 |
71 |
1,100 |
952 |
|
Wisconsin |
— |
0 |
0 |
— |
1 |
— |
0 |
0 |
— |
— |
— |
13 |
45 |
393 |
709 |
|
W.N. Central |
— |
0 |
1 |
— |
— |
— |
0 |
0 |
— |
— |
12 |
39 |
158 |
1,295 |
2,638 |
|
Iowa |
— |
0 |
0 |
— |
— |
— |
0 |
0 |
— |
— |
8 |
11 |
57 |
527 |
459 |
|
Kansas |
— |
0 |
0 |
— |
— |
— |
0 |
0 |
— |
— |
1 |
8 |
19 |
280 |
343 |
|
Minnesota |
— |
0 |
0 |
— |
— |
— |
0 |
0 |
— |
— |
— |
0 |
58 |
— |
695 |
|
Missouri |
— |
0 |
1 |
— |
— |
— |
0 |
0 |
— |
— |
— |
0 |
32 |
28 |
651 |
|
Nebraska |
— |
0 |
0 |
— |
— |
— |
0 |
0 |
— |
— |
3 |
5 |
12 |
180 |
217 |
|
North Dakota |
— |
0 |
0 |
— |
— |
— |
0 |
0 |
— |
— |
— |
2 |
8 |
79 |
104 |
|
South Dakota |
— |
0 |
0 |
— |
— |
— |
0 |
0 |
— |
— |
— |
3 |
104 |
201 |
169 |
|
S. Atlantic |
— |
0 |
2 |
3 |
— |
— |
0 |
0 |
— |
— |
251 |
256 |
475 |
7,188 |
8,750 |
|
Delaware |
— |
0 |
0 |
— |
— |
— |
0 |
0 |
— |
— |
— |
2 |
10 |
75 |
118 |
|
District of Columbia |
— |
0 |
0 |
— |
— |
— |
0 |
0 |
— |
— |
— |
0 |
27 |
1 |
79 |
|
Florida |
— |
0 |
1 |
2 |
— |
— |
0 |
0 |
— |
— |
158 |
111 |
189 |
3,281 |
3,476 |
|
Georgia |
— |
0 |
0 |
— |
— |
— |
0 |
0 |
— |
— |
52 |
36 |
85 |
1,321 |
1,400 |
|
Maryland |
— |
0 |
1 |
1 |
— |
— |
0 |
0 |
— |
— |
27 |
15 |
37 |
577 |
640 |
|
North Carolina |
— |
0 |
0 |
— |
— |
— |
0 |
0 |
— |
— |
— |
28 |
162 |
662 |
1,247 |
|
South Carolina |
— |
0 |
1 |
— |
— |
— |
0 |
0 |
— |
— |
7 |
17 |
68 |
500 |
920 |
|
Virginia |
— |
0 |
0 |
— |
— |
— |
0 |
0 |
— |
— |
7 |
21 |
55 |
653 |
726 |
|
West Virginia |
— |
0 |
0 |
— |
— |
— |
0 |
0 |
— |
— |
— |
3 |
10 |
118 |
144 |
|
E.S. Central |
— |
0 |
0 |
— |
— |
— |
0 |
0 |
— |
— |
13 |
64 |
111 |
2,142 |
2,396 |
|
Alabama |
— |
0 |
0 |
— |
— |
— |
0 |
0 |
— |
— |
— |
17 |
47 |
519 |
733 |
|
Kentucky |
— |
0 |
0 |
— |
— |
— |
0 |
0 |
— |
— |
— |
8 |
77 |
429 |
372 |
|
Mississippi |
— |
0 |
0 |
— |
— |
— |
0 |
0 |
— |
— |
1 |
16 |
49 |
596 |
698 |
|
Tennessee |
— |
0 |
0 |
— |
— |
— |
0 |
0 |
— |
— |
12 |
16 |
41 |
598 |
593 |
|
W.S. Central |
— |
0 |
1 |
— |
1 |
— |
0 |
0 |
— |
— |
188 |
168 |
476 |
4,601 |
4,671 |
|
Arkansas |
— |
0 |
0 |
— |
— |
— |
0 |
0 |
— |
— |
18 |
15 |
43 |
458 |
461 |
|
Louisiana |
— |
0 |
0 |
— |
— |
— |
0 |
0 |
— |
— |
— |
19 |
60 |
564 |
821 |
|
Oklahoma |
— |
0 |
0 |
— |
— |
— |
0 |
0 |
— |
— |
29 |
15 |
61 |
567 |
444 |
|
Texas |
— |
0 |
1 |
— |
1 |
— |
0 |
0 |
— |
— |
141 |
111 |
387 |
3,012 |
2,945 |
|
Mountain |
— |
0 |
0 |
— |
— |
— |
0 |
0 |
— |
— |
25 |
44 |
143 |
1,259 |
2,563 |
|
Arizona |
— |
0 |
0 |
— |
— |
— |
0 |
0 |
— |
— |
15 |
16 |
49 |
534 |
679 |
|
Colorado |
— |
0 |
0 |
— |
— |
— |
0 |
0 |
— |
— |
— |
0 |
24 |
— |
391 |
|
Idaho |
— |
0 |
0 |
— |
— |
— |
0 |
0 |
— |
— |
3 |
4 |
11 |
124 |
486 |
|
Montana |
— |
0 |
0 |
— |
— |
— |
0 |
0 |
— |
— |
3 |
3 |
8 |
104 |
145 |
|
Nevada |
— |
0 |
0 |
— |
— |
— |
0 |
0 |
— |
— |
— |
2 |
14 |
29 |
182 |
|
New Mexico |
— |
0 |
0 |
— |
— |
— |
0 |
0 |
— |
— |
— |
6 |
23 |
178 |
290 |
|
Utah |
— |
0 |
0 |
— |
— |
— |
0 |
0 |
— |
— |
4 |
7 |
27 |
242 |
328 |
|
Wyoming |
— |
0 |
0 |
— |
— |
— |
0 |
0 |
— |
— |
— |
1 |
7 |
48 |
62 |
|
Pacific |
— |
0 |
0 |
— |
— |
— |
0 |
0 |
— |
— |
42 |
108 |
1,110 |
3,680 |
4,336 |
|
Alaska |
— |
0 |
0 |
— |
— |
— |
0 |
0 |
— |
— |
— |
1 |
5 |
55 |
56 |
|
California |
— |
0 |
0 |
— |
— |
— |
0 |
0 |
— |
— |
10 |
83 |
189 |
2,725 |
3,738 |
|
Hawaii |
— |
0 |
0 |
— |
— |
— |
0 |
0 |
— |
— |
— |
5 |
12 |
158 |
182 |
|
Oregon |
— |
0 |
0 |
— |
— |
— |
0 |
0 |
— |
— |
6 |
8 |
23 |
288 |
360 |
|
Washington |
— |
0 |
0 |
— |
— |
— |
0 |
0 |
— |
— |
26 |
8 |
1,035 |
454 |
— |
|
Territories |
|||||||||||||||
|
American Samoa |
— |
0 |
0 |
— |
— |
— |
0 |
0 |
— |
— |
— |
0 |
0 |
— |
— |
|
C.N.M.I. |
— |
— |
— |
— |
— |
— |
— |
— |
— |
— |
— |
— |
— |
— |
— |
|
Guam |
— |
0 |
0 |
— |
— |
— |
0 |
0 |
— |
— |
— |
0 |
5 |
— |
11 |
|
Puerto Rico |
— |
0 |
0 |
— |
— |
— |
0 |
0 |
— |
— |
— |
10 |
27 |
236 |
411 |
|
U.S. Virgin Islands |
— |
0 |
0 |
— |
— |
— |
0 |
0 |
— |
— |
— |
0 |
0 |
— |
— |
|
C.N.M.I.: Commonwealth of Northern Mariana Islands. U: Unavailable. —: No reported cases. N: Not reportable. NN: Not Nationally Notifiable. NP: Nationally notifiable but not published. Cum: Cumulative year-to-date counts. Med: Median. Max: Maximum. * Three low incidence conditions, rubella, rubella congenital, and tetanus, are in Table II to facilitate case count verification with reporting jurisdictions. † Case counts for reporting year 2015 and 2016 are provisional and subject to change. For further information on interpretation of these data, see http://wwwn.cdc.gov/nndss/document/ProvisionalNationaNotifiableDiseasesSurveillanceData20100927.pdf. Data for TB are displayed in Table IV, which appears quarterly. |
|||||||||||||||
|
TABLE II. (Continued) Provisional cases of selected notifiable diseases (≥1,000 cases reported during the preceding year), and selected* low frequency diseases, United States and U.S. territories, weeks ending September 3, 2016, and September 5, 2015 (35th week)† (Export data) |
||||||||||
|
Reporting area |
Shiga toxin-producing E. coli (STEC)§ |
Shigellosis |
||||||||
|
Current week |
Previous 52 weeks |
Cum 2016 |
Cum 2015 |
Current week |
Previous 52 weeks |
Cum 2016 |
Cum 2015 |
|||
|
Med |
Max |
Med |
Max |
|||||||
|
United States |
57 |
119 |
549 |
3,834 |
4,413 |
143 |
397 |
981 |
12,538 |
13,893 |
|
New England |
1 |
5 |
36 |
222 |
160 |
1 |
5 |
13 |
171 |
195 |
|
Connecticut |
— |
1 |
33 |
91 |
65 |
— |
1 |
4 |
29 |
44 |
|
Maine |
— |
0 |
3 |
22 |
21 |
— |
0 |
1 |
1 |
3 |
|
Massachusetts |
— |
2 |
7 |
77 |
41 |
1 |
3 |
11 |
119 |
118 |
|
New Hampshire |
— |
0 |
4 |
13 |
15 |
— |
0 |
1 |
5 |
4 |
|
Rhode Island |
— |
0 |
1 |
4 |
6 |
— |
0 |
2 |
16 |
21 |
|
Vermont |
1 |
0 |
4 |
15 |
12 |
— |
0 |
1 |
1 |
5 |
|
Mid. Atlantic |
8 |
12 |
27 |
453 |
468 |
8 |
26 |
41 |
854 |
1,326 |
|
New Jersey |
— |
2 |
7 |
68 |
101 |
— |
4 |
12 |
112 |
254 |
|
New York (Upstate) |
— |
4 |
16 |
181 |
122 |
— |
4 |
10 |
123 |
257 |
|
New York City |
4 |
1 |
7 |
76 |
80 |
6 |
7 |
17 |
275 |
565 |
|
Pennsylvania |
4 |
3 |
12 |
128 |
165 |
2 |
9 |
26 |
344 |
250 |
|
E.N. Central |
14 |
13 |
80 |
587 |
617 |
28 |
64 |
123 |
2,300 |
1,524 |
|
Illinois |
— |
3 |
59 |
191 |
125 |
— |
13 |
35 |
373 |
564 |
|
Indiana |
— |
1 |
8 |
42 |
89 |
— |
5 |
13 |
156 |
186 |
|
Michigan |
— |
2 |
10 |
108 |
88 |
3 |
10 |
24 |
364 |
331 |
|
Ohio |
14 |
4 |
19 |
177 |
162 |
18 |
22 |
54 |
800 |
325 |
|
Wisconsin |
— |
2 |
10 |
69 |
153 |
7 |
14 |
39 |
607 |
118 |
|
W.N. Central |
3 |
16 |
41 |
473 |
695 |
3 |
29 |
98 |
718 |
1,413 |
|
Iowa |
— |
4 |
20 |
227 |
116 |
3 |
10 |
31 |
371 |
417 |
|
Kansas |
— |
2 |
7 |
81 |
82 |
— |
4 |
14 |
166 |
78 |
|
Minnesota |
— |
0 |
13 |
— |
171 |
— |
0 |
21 |
— |
86 |
|
Missouri |
— |
0 |
9 |
9 |
173 |
— |
0 |
52 |
27 |
524 |
|
Nebraska |
3 |
2 |
9 |
97 |
81 |
— |
2 |
14 |
122 |
50 |
|
North Dakota |
— |
0 |
3 |
24 |
31 |
— |
0 |
2 |
15 |
20 |
|
South Dakota |
— |
1 |
4 |
35 |
41 |
— |
1 |
12 |
17 |
238 |
|
S. Atlantic |
7 |
10 |
19 |
359 |
391 |
25 |
56 |
130 |
1,681 |
2,907 |
|
Delaware |
— |
0 |
2 |
7 |
2 |
— |
1 |
3 |
39 |
17 |
|
District of Columbia |
— |
0 |
0 |
— |
— |
— |
0 |
0 |
— |
— |
|
Florida |
4 |
3 |
7 |
117 |
93 |
14 |
17 |
38 |
467 |
1,353 |
|
Georgia |
— |
2 |
6 |
67 |
77 |
5 |
17 |
38 |
507 |
833 |
|
Maryland |
2 |
1 |
8 |
49 |
60 |
2 |
3 |
13 |
103 |
158 |
|
North Carolina |
— |
0 |
6 |
21 |
40 |
— |
5 |
34 |
152 |
186 |
|
South Carolina |
— |
0 |
2 |
16 |
31 |
— |
4 |
44 |
131 |
131 |
|
Virginia |
1 |
1 |
8 |
69 |
74 |
4 |
7 |
22 |
277 |
215 |
|
West Virginia |
— |
0 |
3 |
13 |
14 |
— |
0 |
2 |
5 |
14 |
|
E.S. Central |
2 |
5 |
14 |
209 |
212 |
7 |
15 |
37 |
462 |
998 |
|
Alabama |
— |
1 |
3 |
19 |
24 |
— |
8 |
25 |
176 |
421 |
|
Kentucky |
1 |
1 |
5 |
53 |
53 |
2 |
3 |
15 |
126 |
329 |
|
Mississippi |
— |
0 |
3 |
13 |
13 |
— |
1 |
4 |
36 |
73 |
|
Tennessee |
1 |
3 |
8 |
124 |
122 |
5 |
3 |
9 |
124 |
175 |
|
W.S. Central |
9 |
16 |
92 |
526 |
537 |
42 |
126 |
497 |
3,863 |
3,768 |
|
Arkansas |
1 |
1 |
7 |
68 |
53 |
1 |
3 |
9 |
108 |
40 |
|
Louisiana |
— |
0 |
2 |
8 |
36 |
— |
6 |
16 |
218 |
130 |
|
Oklahoma |
4 |
2 |
33 |
86 |
95 |
7 |
16 |
124 |
516 |
565 |
|
Texas |
4 |
12 |
53 |
364 |
353 |
34 |
97 |
363 |
3,021 |
3,033 |
|
Mountain |
10 |
11 |
30 |
353 |
523 |
9 |
30 |
54 |
1,172 |
470 |
|
Arizona |
1 |
2 |
8 |
97 |
89 |
8 |
23 |
49 |
942 |
279 |
|
Colorado |
— |
0 |
10 |
— |
141 |
— |
0 |
8 |
— |
48 |
|
Idaho |
9 |
3 |
12 |
119 |
90 |
1 |
1 |
4 |
36 |
16 |
|
Montana |
— |
2 |
7 |
64 |
52 |
— |
0 |
2 |
9 |
11 |
|
Nevada |
— |
0 |
7 |
6 |
28 |
— |
0 |
8 |
11 |
31 |
|
New Mexico |
— |
0 |
3 |
19 |
27 |
— |
2 |
23 |
119 |
50 |
|
Utah |
— |
1 |
7 |
44 |
64 |
— |
1 |
5 |
50 |
26 |
|
Wyoming |
— |
0 |
2 |
4 |
32 |
— |
0 |
1 |
5 |
9 |
|
Pacific |
3 |
18 |
399 |
652 |
810 |
20 |
43 |
190 |
1,317 |
1,292 |
|
Alaska |
— |
0 |
1 |
8 |
7 |
— |
0 |
1 |
4 |
2 |
|
California |
1 |
13 |
33 |
396 |
614 |
10 |
36 |
158 |
1,082 |
1,191 |
|
Hawaii |
— |
0 |
2 |
10 |
36 |
— |
1 |
4 |
27 |
59 |
|
Oregon |
2 |
4 |
12 |
123 |
153 |
— |
2 |
10 |
83 |
40 |
|
Washington |
— |
0 |
386 |
115 |
— |
10 |
2 |
152 |
121 |
— |
|
Territories |
||||||||||
|
American Samoa |
— |
0 |
0 |
— |
— |
— |
0 |
0 |
— |
— |
|
C.N.M.I. |
— |
— |
— |
— |
— |
— |
— |
— |
— |
— |
|
Guam |
— |
0 |
0 |
— |
— |
— |
0 |
5 |
— |
7 |
|
Puerto Rico |
— |
0 |
1 |
— |
1 |
— |
0 |
3 |
14 |
12 |
|
U.S. Virgin Islands |
— |
0 |
0 |
— |
— |
— |
0 |
0 |
— |
— |
|
C.N.M.I.: Commonwealth of Northern Mariana Islands. U: Unavailable. —: No reported cases. N: Not reportable. NN: Not Nationally Notifiable. NP: Nationally notifiable but not published. Cum: Cumulative year-to-date counts. Med: Median. Max: Maximum. * Three low incidence conditions, rubella, rubella congenital, and tetanus, are in Table II to facilitate case count verification with reporting jurisdictions. † Case counts for reporting year 2015 and 2016 are provisional and subject to change. For further information on interpretation of these data, see http://wwwn.cdc.gov/nndss/document/ProvisionalNationaNotifiableDiseasesSurveillanceData20100927.pdf. Data for TB are displayed in Table IV, which appears quarterly. § Includes E. coli O157:H7, Shiga toxin-positive, serogroup non-O157, and Shiga toxin-positive, not serogrouped. |
||||||||||
|
TABLE II. (Continued) Provisional cases of selected notifiable diseases (≥1,000 cases reported during the preceding year), and selected* low frequency diseases, United States and U.S. territories, weeks ending September 3, 2016, and September 5, 2015 (35th week)† (Export data) |
|||||||||||||||
|
Reporting area |
Spotted Fever Rickettsiosis (including RMSF)§ |
Syphilis, primary and secondary |
|||||||||||||
|
Confirmed |
Probable |
||||||||||||||
|
Current week |
Previous 52 weeks |
Cum 2016 |
Cum 2015 |
Current week |
Previous 52 weeks |
Cum 2016 |
Cum 2015 |
Current week |
Previous 52 weeks |
Cum 2016 |
Cum 2015 |
||||
|
Med |
Max |
Med |
Max |
Med |
Max |
||||||||||
|
United States |
— |
2 |
10 |
84 |
149 |
28 |
54 |
322 |
2,293 |
2,833 |
101 |
486 |
581 |
15,453 |
15,637 |
|
New England |
— |
0 |
0 |
— |
2 |
— |
0 |
2 |
6 |
12 |
1 |
13 |
22 |
426 |
439 |
|
Connecticut |
— |
0 |
0 |
— |
1 |
— |
0 |
1 |
— |
3 |
1 |
1 |
5 |
23 |
67 |
|
Maine |
— |
0 |
0 |
— |
— |
— |
0 |
1 |
2 |
— |
— |
1 |
4 |
28 |
21 |
|
Massachusetts |
— |
0 |
0 |
— |
1 |
— |
0 |
1 |
3 |
8 |
— |
8 |
18 |
270 |
270 |
|
New Hampshire |
— |
0 |
0 |
— |
— |
— |
0 |
0 |
— |
— |
— |
1 |
11 |
39 |
27 |
|
Rhode Island |
— |
0 |
0 |
— |
— |
— |
0 |
1 |
1 |
1 |
— |
1 |
7 |
52 |
49 |
|
Vermont |
— |
0 |
0 |
— |
— |
— |
0 |
0 |
— |
— |
— |
0 |
3 |
14 |
5 |
|
Mid. Atlantic |
— |
0 |
1 |
6 |
5 |
— |
2 |
7 |
62 |
82 |
14 |
66 |
101 |
2,138 |
1,844 |
|
New Jersey |
— |
0 |
1 |
1 |
1 |
— |
0 |
3 |
30 |
54 |
— |
8 |
17 |
242 |
224 |
|
New York (Upstate) |
— |
0 |
1 |
3 |
4 |
— |
0 |
3 |
7 |
16 |
7 |
10 |
46 |
318 |
268 |
|
New York City |
— |
0 |
0 |
— |
— |
— |
0 |
3 |
13 |
4 |
4 |
33 |
45 |
1,088 |
932 |
|
Pennsylvania |
— |
0 |
1 |
2 |
— |
— |
0 |
4 |
12 |
8 |
3 |
14 |
21 |
490 |
420 |
|
E.N. Central |
— |
0 |
1 |
3 |
2 |
1 |
1 |
9 |
74 |
87 |
1 |
45 |
58 |
1,305 |
1,638 |
|
Illinois |
— |
0 |
1 |
1 |
1 |
— |
0 |
5 |
32 |
45 |
— |
15 |
32 |
385 |
714 |
|
Indiana |
— |
0 |
0 |
— |
— |
— |
0 |
4 |
18 |
27 |
1 |
6 |
12 |
215 |
193 |
|
Michigan |
— |
0 |
1 |
1 |
— |
— |
0 |
1 |
2 |
1 |
— |
6 |
12 |
189 |
291 |
|
Ohio |
— |
0 |
1 |
1 |
1 |
1 |
0 |
3 |
16 |
9 |
— |
13 |
21 |
436 |
386 |
|
Wisconsin |
— |
0 |
0 |
— |
— |
— |
0 |
1 |
6 |
5 |
— |
2 |
6 |
80 |
54 |
|
W.N. Central |
— |
0 |
3 |
15 |
8 |
3 |
7 |
31 |
314 |
393 |
3 |
17 |
32 |
618 |
527 |
|
Iowa |
— |
0 |
0 |
— |
— |
— |
0 |
1 |
8 |
8 |
1 |
1 |
4 |
46 |
45 |
|
Kansas |
— |
0 |
1 |
2 |
1 |
— |
1 |
8 |
73 |
131 |
1 |
2 |
5 |
76 |
57 |
|
Minnesota |
— |
0 |
0 |
— |
— |
— |
0 |
0 |
— |
10 |
— |
5 |
11 |
188 |
158 |
|
Missouri |
— |
0 |
3 |
11 |
2 |
3 |
4 |
23 |
213 |
225 |
1 |
6 |
16 |
250 |
199 |
|
Nebraska |
— |
0 |
3 |
1 |
4 |
— |
0 |
3 |
17 |
14 |
— |
1 |
6 |
32 |
31 |
|
North Dakota |
— |
0 |
1 |
1 |
— |
— |
0 |
1 |
— |
5 |
— |
0 |
3 |
19 |
8 |
|
South Dakota |
— |
0 |
0 |
— |
1 |
— |
0 |
1 |
3 |
— |
— |
0 |
2 |
7 |
29 |
|
S. Atlantic |
— |
1 |
8 |
40 |
93 |
10 |
10 |
73 |
455 |
602 |
24 |
121 |
164 |
3,934 |
3,975 |
|
Delaware |
— |
0 |
0 |
— |
— |
— |
0 |
3 |
10 |
14 |
— |
0 |
7 |
41 |
35 |
|
District of Columbia |
— |
0 |
0 |
— |
— |
— |
0 |
0 |
— |
— |
— |
1 |
7 |
70 |
74 |
|
Florida |
— |
0 |
1 |
3 |
— |
— |
0 |
2 |
11 |
13 |
1 |
44 |
66 |
1,479 |
1,336 |
|
Georgia |
— |
1 |
7 |
34 |
87 |
— |
0 |
0 |
— |
— |
2 |
25 |
50 |
871 |
996 |
|
Maryland |
— |
0 |
1 |
1 |
— |
5 |
0 |
4 |
20 |
2 |
2 |
9 |
22 |
294 |
337 |
|
North Carolina |
— |
0 |
1 |
1 |
3 |
— |
5 |
66 |
217 |
291 |
— |
20 |
41 |
626 |
753 |
|
South Carolina |
— |
0 |
1 |
— |
1 |
— |
0 |
2 |
10 |
35 |
4 |
6 |
15 |
216 |
179 |
|
Virginia |
— |
0 |
1 |
1 |
2 |
5 |
3 |
18 |
181 |
241 |
15 |
6 |
41 |
305 |
234 |
|
West Virginia |
— |
0 |
0 |
— |
— |
— |
0 |
1 |
6 |
6 |
— |
1 |
4 |
32 |
31 |
|
E.S. Central |
— |
0 |
1 |
7 |
17 |
9 |
14 |
56 |
799 |
872 |
1 |
19 |
38 |
665 |
645 |
|
Alabama |
— |
0 |
1 |
1 |
1 |
— |
3 |
24 |
256 |
237 |
— |
5 |
14 |
186 |
179 |
|
Kentucky |
— |
0 |
1 |
4 |
— |
— |
2 |
10 |
90 |
99 |
1 |
3 |
12 |
108 |
93 |
|
Mississippi |
— |
0 |
1 |
— |
3 |
— |
1 |
8 |
42 |
67 |
— |
5 |
13 |
178 |
138 |
|
Tennessee |
— |
0 |
1 |
2 |
13 |
9 |
8 |
33 |
411 |
469 |
— |
6 |
14 |
193 |
235 |
|
W.S. Central |
— |
0 |
7 |
5 |
6 |
5 |
10 |
307 |
562 |
742 |
41 |
50 |
75 |
1,770 |
1,796 |
|
Arkansas |
— |
0 |
1 |
5 |
3 |
2 |
10 |
74 |
524 |
678 |
— |
3 |
10 |
88 |
67 |
|
Louisiana |
— |
0 |
1 |
— |
1 |
— |
0 |
2 |
— |
8 |
— |
12 |
38 |
315 |
448 |
|
Oklahoma |
— |
0 |
7 |
— |
— |
— |
0 |
275 |
3 |
22 |
— |
3 |
12 |
115 |
136 |
|
Texas |
— |
0 |
0 |
— |
2 |
3 |
1 |
5 |
35 |
34 |
41 |
35 |
50 |
1,252 |
1,145 |
|
Mountain |
— |
0 |
1 |
7 |
16 |
— |
0 |
2 |
13 |
29 |
1 |
27 |
40 |
927 |
933 |
|
Arizona |
— |
0 |
1 |
4 |
9 |
— |
0 |
2 |
7 |
7 |
1 |
11 |
19 |
365 |
404 |
|
Colorado |
— |
0 |
0 |
— |
— |
— |
0 |
1 |
— |
6 |
— |
4 |
9 |
136 |
163 |
|
Idaho |
— |
0 |
1 |
3 |
— |
— |
0 |
1 |
3 |
3 |
— |
1 |
7 |
30 |
23 |
|
Montana |
— |
0 |
0 |
— |
5 |
— |
0 |
1 |
2 |
4 |
— |
0 |
2 |
8 |
7 |
|
Nevada |
— |
0 |
0 |
— |
1 |
— |
0 |
1 |
— |
— |
— |
6 |
16 |
225 |
219 |
|
New Mexico |
— |
0 |
0 |
— |
— |
— |
0 |
0 |
— |
2 |
— |
3 |
10 |
109 |
73 |
|
Utah |
— |
0 |
0 |
— |
1 |
— |
0 |
0 |
— |
6 |
— |
2 |
5 |
52 |
41 |
|
Wyoming |
— |
0 |
0 |
— |
— |
— |
0 |
1 |
1 |
1 |
— |
0 |
1 |
2 |
3 |
|
Pacific |
— |
0 |
1 |
1 |
— |
— |
0 |
4 |
8 |
14 |
15 |
115 |
144 |
3,670 |
3,840 |
|
Alaska |
N |
0 |
0 |
N |
N |
N |
0 |
0 |
N |
N |
— |
0 |
1 |
— |
5 |
|
California |
— |
0 |
0 |
— |
— |
— |
0 |
2 |
6 |
9 |
6 |
101 |
121 |
3,240 |
3,256 |
|
Hawaii |
N |
0 |
0 |
N |
N |
N |
0 |
0 |
N |
N |
— |
1 |
6 |
37 |
51 |
|
Oregon |
— |
0 |
1 |
1 |
— |
— |
0 |
1 |
2 |
5 |
4 |
6 |
15 |
217 |
226 |
|
Washington |
— |
0 |
0 |
— |
— |
— |
0 |
4 |
— |
— |
5 |
6 |
13 |
176 |
302 |
|
Territories |
|||||||||||||||
|
American Samoa |
N |
0 |
0 |
N |
N |
N |
0 |
0 |
N |
N |
— |
0 |
0 |
— |
— |
|
C.N.M.I. |
— |
— |
— |
— |
— |
— |
— |
— |
— |
— |
— |
— |
— |
— |
— |
|
Guam |
N |
0 |
0 |
N |
N |
N |
0 |
0 |
N |
N |
— |
0 |
0 |
— |
— |
|
Puerto Rico |
N |
0 |
0 |
N |
N |
N |
0 |
0 |
N |
N |
4 |
9 |
26 |
301 |
304 |
|
U.S. Virgin Islands |
— |
0 |
0 |
— |
— |
— |
0 |
0 |
— |
— |
— |
0 |
0 |
— |
— |
|
C.N.M.I.: Commonwealth of Northern Mariana Islands. U: Unavailable. —: No reported cases. N: Not reportable. NN: Not Nationally Notifiable. NP: Nationally notifiable but not published. Cum: Cumulative year-to-date counts. Med: Median. Max: Maximum. * Three low incidence conditions, rubella, rubella congenital, and tetanus, are in Table II to facilitate case count verification with reporting jurisdictions. † Case counts for reporting year 2015 and 2016 are provisional and subject to change. For further information on interpretation of these data, see http://wwwn.cdc.gov/nndss/document/ProvisionalNationaNotifiableDiseasesSurveillanceData20100927.pdf. Data for TB are displayed in Table IV, which appears quarterly. § Illnesses with similar clinical presentation that result from Spotted Fever Group Rickettsia infections are reported as Spotted Fever Rickettsioses. Rocky Mountain Spotted Fever (RMSF), caused by Rickettsia rickettsii, is the most common and well-known Spotted Fever. |
|||||||||||||||
|
TABLE II. (Continued) Provisional cases of selected notifiable diseases (≥1,000 cases reported during the preceding year), and selected* low frequency diseases, United States and U.S. territories, weeks ending September 3, 2016, and September 5, 2015 (35th week)† (Export data) |
|||||||||||||||
|
Reporting area |
Tetanus |
Varicella (chickenpox) |
Vibriosis§ |
||||||||||||
|
Current week |
Previous 52 weeks |
Cum 2016 |
Cum 2015 |
Current week |
Previous 52 weeks |
Cum 2016 |
Cum 2015 |
Current week |
Previous 52 weeks |
Cum 2016 |
Cum 2015 |
||||
|
Med |
Max |
Med |
Max |
Med |
Max |
||||||||||
|
United States |
1 |
1 |
2 |
22 |
17 |
65 |
168 |
260 |
4,784 |
6,114 |
13 |
16 |
83 |
639 |
878 |
|
New England |
— |
0 |
0 |
— |
— |
5 |
16 |
32 |
509 |
610 |
— |
1 |
13 |
56 |
83 |
|
Connecticut |
— |
0 |
0 |
— |
— |
— |
2 |
10 |
78 |
114 |
— |
0 |
2 |
5 |
24 |
|
Maine |
— |
0 |
0 |
— |
— |
3 |
4 |
9 |
137 |
145 |
— |
0 |
2 |
4 |
5 |
|
Massachusetts |
— |
0 |
0 |
— |
— |
2 |
6 |
16 |
229 |
241 |
— |
1 |
9 |
39 |
49 |
|
New Hampshire |
— |
0 |
0 |
— |
— |
— |
0 |
7 |
1 |
57 |
— |
0 |
2 |
3 |
3 |
|
Rhode Island |
— |
0 |
0 |
— |
— |
— |
1 |
6 |
33 |
31 |
— |
0 |
3 |
5 |
1 |
|
Vermont |
— |
0 |
0 |
— |
— |
— |
0 |
6 |
31 |
22 |
— |
0 |
1 |
— |
1 |
|
Mid. Atlantic |
— |
0 |
2 |
4 |
— |
8 |
23 |
46 |
616 |
717 |
— |
1 |
9 |
67 |
90 |
|
New Jersey |
— |
0 |
0 |
— |
— |
— |
7 |
19 |
217 |
284 |
— |
0 |
4 |
19 |
26 |
|
New York (Upstate) |
— |
0 |
1 |
1 |
— |
N |
0 |
0 |
N |
N |
— |
0 |
5 |
30 |
35 |
|
New York City |
— |
0 |
1 |
1 |
— |
— |
0 |
0 |
— |
— |
— |
0 |
2 |
6 |
17 |
|
Pennsylvania |
— |
0 |
1 |
2 |
— |
8 |
14 |
28 |
399 |
433 |
— |
0 |
3 |
12 |
12 |
|
E.N. Central |
— |
0 |
1 |
2 |
2 |
12 |
36 |
73 |
984 |
1,143 |
1 |
1 |
3 |
38 |
53 |
|
Illinois |
— |
0 |
1 |
1 |
1 |
— |
8 |
19 |
254 |
278 |
— |
0 |
2 |
15 |
23 |
|
Indiana |
— |
0 |
0 |
— |
— |
— |
3 |
9 |
116 |
108 |
— |
0 |
2 |
4 |
3 |
|
Michigan |
— |
0 |
0 |
— |
— |
— |
10 |
36 |
286 |
300 |
— |
0 |
2 |
7 |
9 |
|
Ohio |
— |
0 |
1 |
1 |
1 |
12 |
8 |
21 |
290 |
260 |
1 |
0 |
2 |
7 |
11 |
|
Wisconsin |
— |
0 |
1 |
— |
— |
— |
2 |
13 |
38 |
197 |
— |
0 |
1 |
5 |
7 |
|
W.N. Central |
— |
0 |
0 |
— |
2 |
3 |
12 |
32 |
344 |
559 |
— |
0 |
2 |
8 |
23 |
|
Iowa |
— |
0 |
0 |
— |
— |
N |
0 |
0 |
N |
N |
N |
0 |
0 |
N |
N |
|
Kansas |
— |
0 |
0 |
— |
— |
— |
0 |
12 |
— |
147 |
— |
0 |
2 |
2 |
4 |
|
Minnesota |
— |
0 |
0 |
— |
— |
— |
6 |
13 |
183 |
230 |
— |
0 |
1 |
— |
14 |
|
Missouri |
— |
0 |
0 |
— |
1 |
3 |
2 |
15 |
83 |
113 |
— |
0 |
1 |
— |
4 |
|
Nebraska |
— |
0 |
0 |
— |
— |
— |
0 |
3 |
23 |
15 |
— |
0 |
1 |
1 |
— |
|
North Dakota |
— |
0 |
0 |
— |
— |
— |
0 |
5 |
30 |
34 |
— |
0 |
1 |
1 |
1 |
|
South Dakota |
— |
0 |
0 |
— |
1 |
— |
0 |
4 |
25 |
20 |
— |
0 |
1 |
4 |
— |
|
S. Atlantic |
— |
0 |
1 |
5 |
5 |
17 |
27 |
54 |
858 |
1,091 |
7 |
7 |
21 |
230 |
222 |
|
Delaware |
— |
0 |
0 |
— |
— |
— |
0 |
2 |
7 |
15 |
— |
0 |
2 |
7 |
5 |
|
District of Columbia |
— |
0 |
0 |
— |
— |
— |
0 |
2 |
7 |
19 |
— |
0 |
0 |
— |
— |
|
Florida |
— |
0 |
1 |
3 |
2 |
13 |
15 |
39 |
536 |
509 |
4 |
4 |
10 |
124 |
132 |
|
Georgia |
— |
0 |
0 |
— |
— |
— |
2 |
8 |
96 |
120 |
— |
0 |
2 |
14 |
17 |
|
Maryland |
— |
0 |
1 |
1 |
— |
N |
0 |
0 |
N |
N |
2 |
0 |
6 |
43 |
20 |
|
North Carolina |
— |
0 |
1 |
— |
2 |
N |
0 |
0 |
N |
N |
— |
0 |
6 |
8 |
14 |
|
South Carolina |
— |
0 |
0 |
— |
1 |
1 |
2 |
13 |
43 |
128 |
— |
0 |
3 |
6 |
6 |
|
Virginia |
— |
0 |
1 |
1 |
— |
3 |
6 |
12 |
164 |
222 |
1 |
0 |
4 |
28 |
26 |
|
West Virginia |
— |
0 |
0 |
— |
— |
— |
0 |
8 |
5 |
78 |
— |
0 |
0 |
— |
2 |
|
E.S. Central |
1 |
0 |
1 |
5 |
1 |
— |
2 |
8 |
71 |
133 |
— |
1 |
4 |
36 |
32 |
|
Alabama |
— |
0 |
1 |
1 |
1 |
— |
2 |
7 |
65 |
123 |
— |
0 |
4 |
17 |
12 |
|
Kentucky |
1 |
0 |
1 |
2 |
— |
N |
0 |
0 |
N |
N |
— |
0 |
1 |
4 |
3 |
|
Mississippi |
— |
0 |
1 |
1 |
— |
— |
0 |
2 |
6 |
10 |
— |
0 |
1 |
5 |
12 |
|
Tennessee |
— |
0 |
1 |
1 |
— |
N |
0 |
0 |
N |
N |
— |
0 |
2 |
10 |
5 |
|
W.S. Central |
— |
0 |
1 |
3 |
2 |
16 |
31 |
80 |
895 |
1,106 |
— |
2 |
11 |
63 |
114 |
|
Arkansas |
— |
0 |
0 |
— |
— |
3 |
3 |
23 |
84 |
102 |
— |
0 |
1 |
2 |
2 |
|
Louisiana |
— |
0 |
0 |
— |
1 |
— |
1 |
21 |
26 |
56 |
— |
0 |
2 |
13 |
41 |
|
Oklahoma |
— |
0 |
1 |
1 |
— |
N |
0 |
0 |
N |
N |
— |
0 |
1 |
1 |
3 |
|
Texas |
— |
0 |
1 |
2 |
1 |
13 |
23 |
79 |
785 |
948 |
— |
1 |
9 |
47 |
68 |
|
Mountain |
— |
0 |
1 |
1 |
3 |
4 |
16 |
35 |
450 |
639 |
1 |
0 |
7 |
21 |
38 |
|
Arizona |
— |
0 |
1 |
1 |
1 |
3 |
5 |
18 |
177 |
164 |
1 |
0 |
6 |
11 |
20 |
|
Colorado |
— |
0 |
0 |
— |
2 |
— |
0 |
12 |
43 |
212 |
— |
0 |
1 |
— |
7 |
|
Idaho |
— |
0 |
0 |
— |
— |
N |
0 |
0 |
N |
N |
N |
0 |
0 |
N |
N |
|
Montana |
— |
0 |
0 |
— |
— |
— |
1 |
5 |
45 |
104 |
— |
0 |
1 |
2 |
— |
|
Nevada |
— |
0 |
0 |
— |
— |
N |
0 |
0 |
N |
N |
— |
0 |
1 |
1 |
3 |
|
New Mexico |
— |
0 |
1 |
— |
— |
— |
1 |
5 |
31 |
33 |
— |
0 |
0 |
— |
— |
|
Utah |
— |
0 |
0 |
— |
— |
1 |
4 |
18 |
150 |
120 |
— |
0 |
1 |
7 |
8 |
|
Wyoming |
— |
0 |
0 |
— |
— |
— |
0 |
3 |
4 |
6 |
— |
0 |
0 |
— |
— |
|
Pacific |
— |
0 |
1 |
2 |
2 |
— |
2 |
9 |
57 |
116 |
4 |
3 |
68 |
120 |
223 |
|
Alaska |
— |
0 |
1 |
1 |
— |
— |
0 |
4 |
15 |
32 |
2 |
0 |
1 |
5 |
2 |
|
California |
— |
0 |
1 |
1 |
2 |
— |
1 |
4 |
22 |
42 |
— |
2 |
10 |
51 |
174 |
|
Hawaii |
— |
0 |
0 |
— |
— |
— |
1 |
5 |
20 |
42 |
— |
0 |
3 |
17 |
28 |
|
Oregon |
— |
0 |
1 |
— |
— |
N |
0 |
0 |
N |
N |
2 |
0 |
3 |
18 |
19 |
|
Washington |
— |
0 |
0 |
— |
— |
N |
0 |
0 |
N |
N |
— |
0 |
68 |
29 |
— |
|
Territories |
|||||||||||||||
|
American Samoa |
— |
0 |
0 |
— |
— |
N |
0 |
0 |
N |
N |
N |
0 |
0 |
N |
N |
|
C.N.M.I. |
— |
— |
— |
— |
— |
— |
— |
— |
— |
— |
— |
— |
— |
— |
— |
|
Guam |
— |
0 |
0 |
— |
— |
— |
0 |
0 |
— |
29 |
— |
0 |
0 |
— |
— |
|
Puerto Rico |
— |
0 |
0 |
— |
1 |
— |
1 |
6 |
40 |
82 |
— |
0 |
0 |
— |
— |
|
U.S. Virgin Islands |
— |
0 |
0 |
— |
— |
— |
0 |
0 |
— |
— |
— |
0 |
0 |
— |
— |
|
C.N.M.I.: Commonwealth of Northern Mariana Islands. U: Unavailable. —: No reported cases. N: Not reportable. NN: Not Nationally Notifiable. NP: Nationally notifiable but not published. Cum: Cumulative year-to-date counts. Med: Median. Max: Maximum. * Three low incidence conditions, rubella, rubella congenital, and tetanus, are in Table II to facilitate case count verification with reporting jurisdictions. † Case counts for reporting year 2015 and 2016 are provisional and subject to change. For further information on interpretation of these data, see http://wwwn.cdc.gov/nndss/document/ProvisionalNationaNotifiableDiseasesSurveillanceData20100927.pdf. Data for TB are displayed in Table IV, which appears quarterly. § Any species of the family Vibrionaceae, other than toxigenic Vibrio cholerae O1 or O139. |
|||||||||||||||
|
TABLE II. (Continued) Provisional cases of selected notifiable diseases (≥1,000 cases reported during the preceding year), and selected* low frequency diseases, United States and U.S. territories, weeks ending September 3, 2016, and September 5, 2015 (35th week)† (Export data) |
||||||||||
|
Reporting area |
West Nile virus disease§ |
|||||||||
|
Neuroinvasive |
Nonneuroinvasive¶ |
|||||||||
|
Current week |
Previous 52 weeks |
Cum 2016 |
Cum 2015 |
Current week |
Previous 52 weeks |
Cum 2016 |
Cum 2015 |
|||
|
Med |
Max |
Med |
Max |
|||||||
|
United States |
— |
2 |
160 |
271 |
829 |
— |
3 |
89 |
284 |
500 |
|
New England |
— |
0 |
3 |
4 |
6 |
— |
0 |
2 |
— |
3 |
|
Connecticut |
— |
0 |
2 |
1 |
3 |
— |
0 |
1 |
— |
2 |
|
Maine |
— |
0 |
1 |
— |
1 |
— |
0 |
0 |
— |
— |
|
Massachusetts |
— |
0 |
2 |
1 |
2 |
— |
0 |
2 |
— |
1 |
|
New Hampshire |
— |
0 |
0 |
— |
— |
— |
0 |
0 |
— |
— |
|
Rhode Island |
— |
0 |
0 |
— |
— |
— |
0 |
0 |
— |
— |
|
Vermont |
— |
0 |
1 |
2 |
— |
— |
0 |
0 |
— |
— |
|
Mid. Atlantic |
— |
0 |
14 |
4 |
43 |
— |
0 |
5 |
2 |
24 |
|
New Jersey |
— |
0 |
5 |
1 |
13 |
— |
0 |
1 |
— |
3 |
|
New York (Upstate) |
— |
0 |
3 |
— |
6 |
— |
0 |
1 |
— |
4 |
|
New York City |
— |
0 |
7 |
— |
13 |
— |
0 |
2 |
— |
6 |
|
Pennsylvania |
— |
0 |
2 |
3 |
11 |
— |
0 |
2 |
2 |
11 |
|
E.N. Central |
— |
0 |
23 |
11 |
75 |
— |
0 |
8 |
13 |
30 |
|
Illinois |
— |
0 |
13 |
— |
34 |
— |
0 |
6 |
10 |
14 |
|
Indiana |
— |
0 |
3 |
1 |
10 |
— |
0 |
1 |
— |
4 |
|
Michigan |
— |
0 |
4 |
7 |
11 |
— |
0 |
1 |
— |
1 |
|
Ohio |
— |
0 |
2 |
1 |
17 |
— |
0 |
2 |
3 |
8 |
|
Wisconsin |
— |
0 |
3 |
2 |
3 |
— |
0 |
0 |
— |
3 |
|
W.N. Central |
— |
0 |
11 |
38 |
56 |
— |
0 |
24 |
134 |
102 |
|
Iowa |
— |
0 |
1 |
2 |
2 |
— |
0 |
1 |
— |
6 |
|
Kansas |
— |
0 |
3 |
6 |
8 |
— |
0 |
5 |
4 |
15 |
|
Minnesota |
— |
0 |
3 |
8 |
2 |
— |
0 |
5 |
16 |
6 |
|
Missouri |
— |
0 |
3 |
— |
16 |
— |
0 |
1 |
1 |
3 |
|
Nebraska |
— |
0 |
3 |
9 |
13 |
— |
0 |
5 |
27 |
36 |
|
North Dakota |
— |
0 |
3 |
1 |
7 |
— |
0 |
3 |
10 |
12 |
|
South Dakota |
— |
0 |
3 |
12 |
8 |
— |
0 |
14 |
76 |
24 |
|
S. Atlantic |
— |
0 |
10 |
7 |
49 |
— |
0 |
6 |
— |
24 |
|
Delaware |
— |
0 |
0 |
— |
— |
— |
0 |
1 |
— |
5 |
|
District of Columbia |
— |
0 |
1 |
1 |
1 |
— |
0 |
2 |
— |
— |
|
Florida |
— |
0 |
3 |
4 |
7 |
— |
0 |
1 |
— |
— |
|
Georgia |
— |
0 |
4 |
— |
10 |
— |
0 |
0 |
— |
2 |
|
Maryland |
— |
0 |
5 |
1 |
21 |
— |
0 |
2 |
— |
11 |
|
North Carolina |
— |
0 |
1 |
— |
3 |
— |
0 |
0 |
— |
— |
|
South Carolina |
— |
0 |
0 |
— |
— |
— |
0 |
0 |
— |
— |
|
Virginia |
— |
0 |
4 |
1 |
7 |
— |
0 |
2 |
— |
6 |
|
West Virginia |
— |
0 |
0 |
— |
— |
— |
0 |
0 |
— |
— |
|
E.S. Central |
— |
0 |
4 |
18 |
26 |
— |
0 |
3 |
9 |
14 |
|
Alabama |
— |
0 |
2 |
3 |
4 |
— |
0 |
2 |
2 |
4 |
|
Kentucky |
— |
0 |
1 |
— |
— |
— |
0 |
0 |
— |
1 |
|
Mississippi |
— |
0 |
4 |
14 |
19 |
— |
0 |
3 |
6 |
8 |
|
Tennessee |
— |
0 |
2 |
1 |
3 |
— |
0 |
1 |
1 |
1 |
|
W.S. Central |
— |
0 |
30 |
70 |
203 |
— |
0 |
18 |
46 |
98 |
|
Arkansas |
— |
0 |
2 |
1 |
13 |
— |
0 |
1 |
1 |
2 |
|
Louisiana |
— |
0 |
5 |
— |
30 |
— |
0 |
2 |
1 |
7 |
|
Oklahoma |
— |
0 |
8 |
3 |
27 |
— |
0 |
5 |
3 |
31 |
|
Texas |
— |
0 |
22 |
66 |
133 |
— |
0 |
13 |
41 |
58 |
|
Mountain |
— |
0 |
15 |
61 |
132 |
— |
0 |
17 |
57 |
83 |
|
Arizona |
— |
0 |
5 |
25 |
59 |
— |
0 |
4 |
13 |
28 |
|
Colorado |
— |
0 |
6 |
24 |
46 |
— |
0 |
11 |
37 |
37 |
|
Idaho |
— |
0 |
1 |
1 |
5 |
— |
0 |
3 |
4 |
7 |
|
Montana |
— |
0 |
1 |
1 |
3 |
— |
0 |
1 |
2 |
— |
|
Nevada |
— |
0 |
3 |
5 |
4 |
— |
0 |
2 |
— |
3 |
|
New Mexico |
— |
0 |
2 |
1 |
8 |
— |
0 |
1 |
— |
1 |
|
Utah |
— |
0 |
2 |
3 |
4 |
— |
0 |
2 |
1 |
2 |
|
Wyoming |
— |
0 |
1 |
1 |
3 |
— |
0 |
0 |
— |
5 |
|
Pacific |
— |
0 |
57 |
58 |
239 |
— |
0 |
23 |
23 |
122 |
|
Alaska |
— |
0 |
0 |
— |
— |
— |
0 |
0 |
— |
— |
|
California |
— |
0 |
57 |
55 |
233 |
— |
0 |
23 |
23 |
106 |
|
Hawaii |
— |
0 |
0 |
— |
— |
— |
0 |
0 |
— |
— |
|
Oregon |
— |
0 |
0 |
— |
— |
— |
0 |
0 |
— |
1 |
|
Washington |
— |
0 |
1 |
3 |
6 |
— |
0 |
1 |
— |
15 |
|
Territories |
||||||||||
|
American Samoa |
— |
0 |
0 |
— |
— |
— |
0 |
0 |
— |
— |
|
C.N.M.I. |
— |
— |
— |
— |
— |
— |
— |
— |
— |
— |
|
Guam |
— |
0 |
0 |
— |
— |
— |
0 |
0 |
— |
— |
|
Puerto Rico |
— |
0 |
0 |
— |
— |
— |
0 |
0 |
— |
— |
|
U.S. Virgin Islands |
— |
0 |
0 |
— |
— |
— |
0 |
0 |
— |
— |
|
C.N.M.I.: Commonwealth of Northern Mariana Islands. U: Unavailable. —: No reported cases. N: Not reportable. NN: Not Nationally Notifiable. NP: Nationally notifiable but not published. Cum: Cumulative year-to-date counts. Med: Median. Max: Maximum. * Three low incidence conditions, rubella, rubella congenital, and tetanus, are in Table II to facilitate case count verification with reporting jurisdictions. † Case counts for reporting year 2015 and 2016 are provisional and subject to change. For further information on interpretation of these data, see http://wwwn.cdc.gov/nndss/document/ProvisionalNationaNotifiableDiseasesSurveillanceData20100927.pdf. Data for TB are displayed in Table IV, which appears quarterly. § Updated weekly from the Division of Vector-Borne Diseases, National Center for Emerging and Zoonotic Infectious Diseases (ArboNET Surveillance). Data for Jamestown Canyon virus, La Crosse virus, Chikungunya virus, Eastern equine encephalitis virus, Powassan virus, St. Louis virus, and Western equine encephalitis virus diseases are available in Table I. ¶ Not reportable in all states. Reporting exceptions are available at http://wwwn.cdc.gov/nndss/downloads.html. |
||||||||||
|
TABLE III. Deaths in 122 U.S. cities,* week ending September 3, 2016 (35th week) (Export data) |
|||||||||||||||||
|
Reporting area |
All causes, by age (years) |
P&I† Total |
Reporting area (Continued) |
All causes, by age (years) |
P&I† Total |
||||||||||||
|
All Ages |
≥65 |
45–64 |
25–44 |
1–24 |
<1 |
All Ages |
≥65 |
45–64 |
25–44 |
1–24 |
<1 |
||||||
|
New England |
471 |
330 |
103 |
22 |
12 |
4 |
39 |
|
|
S. Atlantic |
915 |
579 |
224 |
71 |
25 |
15 |
44 |
|
Boston, MA |
139 |
91 |
35 |
7 |
5 |
1 |
13 |
|
|
Atlanta, GA |
159 |
99 |
40 |
16 |
1 |
3 |
7 |
|
Bridgeport, CT |
15 |
12 |
3 |
— |
— |
— |
3 |
|
|
Baltimore, MD |
188 |
108 |
52 |
14 |
12 |
1 |
8 |
|
Cambridge, MA |
11 |
9 |
2 |
— |
— |
— |
1 |
|
|
Charlotte, NC |
134 |
86 |
29 |
11 |
5 |
3 |
4 |
|
Fall River, MA |
22 |
19 |
2 |
— |
1 |
— |
3 |
|
|
Jacksonville, FL |
140 |
87 |
38 |
9 |
3 |
3 |
9 |
|
Hartford, CT |
48 |
31 |
14 |
2 |
1 |
— |
4 |
|
|
Miami, FL |
37 |
28 |
6 |
3 |
— |
— |
1 |
|
Lowell, MA |
22 |
22 |
— |
— |
— |
— |
1 |
|
|
Norfolk, VA |
35 |
22 |
8 |
2 |
3 |
— |
— |
|
Lynn, MA |
10 |
4 |
4 |
2 |
— |
— |
— |
|
|
Richmond, VA |
41 |
27 |
11 |
3 |
— |
— |
2 |
|
New Bedford, MA |
25 |
18 |
5 |
1 |
1 |
— |
2 |
|
|
Savannah, GA |
27 |
13 |
8 |
5 |
— |
1 |
1 |
|
New Haven, CT |
U |
U |
U |
U |
U |
U |
U |
|
|
St. Petersburg, FL |
45 |
27 |
14 |
1 |
— |
3 |
3 |
|
Providence, RI |
70 |
42 |
18 |
8 |
— |
2 |
2 |
|
|
Tampa, FL |
91 |
66 |
17 |
6 |
1 |
1 |
6 |
|
Somerville, MA |
3 |
3 |
— |
— |
— |
— |
— |
|
|
Washington, D.C. |
U |
U |
U |
U |
U |
U |
U |
|
Springfield, MA |
29 |
19 |
7 |
1 |
2 |
— |
— |
|
|
Wilmington, DE |
18 |
16 |
1 |
1 |
— |
— |
3 |
|
Waterbury, CT |
31 |
25 |
6 |
— |
— |
— |
— |
|
|
E.S. Central |
988 |
600 |
266 |
81 |
20 |
21 |
37 |
|
Worcester, MA |
46 |
35 |
7 |
1 |
2 |
1 |
10 |
|
|
Birmingham, AL |
177 |
106 |
50 |
16 |
3 |
2 |
11 |
|
Mid. Atlantic |
1,733 |
1,227 |
363 |
109 |
17 |
17 |
65 |
|
|
Chattanooga, TN |
101 |
71 |
24 |
4 |
1 |
1 |
4 |
|
Albany, NY |
57 |
44 |
8 |
5 |
— |
— |
3 |
|
|
Knoxville, TN |
114 |
72 |
30 |
7 |
2 |
3 |
6 |
|
Allentown, PA |
26 |
23 |
3 |
— |
— |
— |
— |
|
|
Lexington, KY |
142 |
76 |
36 |
19 |
6 |
5 |
2 |
|
Buffalo, NY |
260 |
171 |
65 |
17 |
3 |
4 |
29 |
|
|
Memphis, TN |
166 |
103 |
42 |
16 |
2 |
3 |
5 |
|
Camden, NJ |
34 |
15 |
11 |
6 |
2 |
— |
— |
|
|
Mobile, AL |
86 |
50 |
26 |
5 |
2 |
3 |
5 |
|
Elizabeth, NJ |
17 |
14 |
2 |
1 |
— |
— |
— |
|
|
Montgomery, AL |
35 |
24 |
9 |
2 |
— |
— |
— |
|
Erie, PA |
40 |
30 |
4 |
5 |
1 |
— |
— |
|
|
Nashville, TN |
167 |
98 |
49 |
12 |
4 |
4 |
4 |
|
Jersey City, NJ |
16 |
12 |
2 |
1 |
— |
1 |
— |
|
|
W.S. Central |
1,628 |
1,033 |
399 |
119 |
42 |
35 |
81 |
|
New York City, NY |
919 |
647 |
199 |
56 |
8 |
9 |
20 |
|
|
Austin, TX |
87 |
56 |
20 |
9 |
— |
2 |
5 |
|
Newark, NJ |
21 |
12 |
7 |
2 |
— |
— |
— |
|
|
Baton Rouge, LA |
119 |
83 |
28 |
6 |
1 |
1 |
3 |
|
Paterson, NJ |
14 |
9 |
2 |
2 |
1 |
— |
1 |
|
|
Corpus Christi, TX |
54 |
36 |
13 |
3 |
— |
2 |
4 |
|
Philadelphia, PA |
U |
U |
U |
U |
U |
U |
U |
|
|
Dallas, TX |
214 |
112 |
66 |
25 |
6 |
5 |
8 |
|
Pittsburgh, PA |
U |
U |
U |
U |
U |
U |
U |
|
|
El Paso, TX |
68 |
46 |
14 |
6 |
— |
2 |
1 |
|
Reading, PA |
35 |
24 |
6 |
3 |
1 |
1 |
— |
|
|
Fort Worth, TX |
U |
U |
U |
U |
U |
U |
U |
|
Rochester, NY |
150 |
114 |
25 |
8 |
1 |
2 |
9 |
|
|
Houston, TX |
473 |
304 |
114 |
29 |
17 |
9 |
27 |
|
Schenectady, NY |
23 |
20 |
2 |
1 |
— |
— |
1 |
|
|
Little Rock, AR |
102 |
63 |
28 |
5 |
3 |
3 |
10 |
|
Scranton, PA |
20 |
14 |
6 |
— |
— |
— |
— |
|
|
New Orleans, LA |
39 |
29 |
6 |
2 |
1 |
1 |
— |
|
Syracuse, NY |
47 |
37 |
9 |
1 |
— |
— |
1 |
|
|
San Antonio, TX |
279 |
176 |
67 |
20 |
6 |
10 |
10 |
|
Trenton, NJ |
12 |
6 |
5 |
1 |
— |
— |
1 |
|
|
Shreveport, LA |
78 |
46 |
20 |
8 |
4 |
— |
5 |
|
Utica, NY |
22 |
15 |
7 |
— |
— |
— |
— |
|
|
Tulsa, OK |
115 |
82 |
23 |
6 |
4 |
— |
8 |
|
Yonkers, NY |
20 |
20 |
— |
— |
— |
— |
— |
|
|
Mountain |
905 |
615 |
185 |
76 |
18 |
11 |
38 |
|
E.N. Central |
1,758 |
1,158 |
387 |
126 |
62 |
25 |
88 |
|
|
Albuquerque, NM |
129 |
90 |
28 |
9 |
2 |
— |
4 |
|
Akron, OH |
50 |
29 |
11 |
8 |
2 |
— |
2 |
|
|
Boise, ID |
43 |
32 |
4 |
5 |
1 |
1 |
1 |
|
Canton, OH |
23 |
13 |
4 |
5 |
1 |
— |
1 |
|
|
Colorado Springs, CO |
27 |
23 |
3 |
1 |
— |
— |
4 |
|
Chicago, IL |
262 |
169 |
61 |
16 |
14 |
2 |
19 |
|
|
Denver, CO |
U |
U |
U |
U |
U |
U |
U |
|
Cincinnati, OH |
65 |
36 |
17 |
6 |
3 |
3 |
1 |
|
|
Las Vegas, NV |
306 |
217 |
55 |
26 |
5 |
3 |
14 |
|
Cleveland, OH |
315 |
241 |
51 |
16 |
4 |
3 |
9 |
|
|
Ogden, UT |
35 |
26 |
4 |
4 |
1 |
— |
3 |
|
Columbus, OH |
U |
U |
U |
U |
U |
U |
U |
|
|
Phoenix, AZ |
187 |
102 |
50 |
21 |
7 |
7 |
2 |
|
Dayton, OH |
124 |
94 |
20 |
5 |
3 |
2 |
8 |
|
|
Pueblo, CO |
9 |
6 |
3 |
— |
— |
— |
— |
|
Detroit, MI |
149 |
67 |
58 |
11 |
10 |
3 |
5 |
|
|
Salt Lake City, UT |
U |
U |
U |
U |
U |
U |
U |
|
Evansville, IN |
40 |
30 |
8 |
2 |
— |
— |
3 |
|
|
Tucson, AZ |
169 |
119 |
38 |
10 |
2 |
— |
10 |
|
Fort Wayne, IN |
91 |
65 |
18 |
6 |
1 |
1 |
2 |
|
|
Pacific |
1,649 |
1,136 |
365 |
85 |
32 |
30 |
116 |
|
Gary, IN |
7 |
3 |
3 |
1 |
— |
— |
— |
|
|
Berkeley, CA |
12 |
8 |
2 |
2 |
— |
— |
1 |
|
Grand Rapids, MI |
60 |
37 |
16 |
3 |
2 |
2 |
4 |
|
|
Fresno, CA |
122 |
79 |
29 |
7 |
4 |
3 |
9 |
|
Indianapolis, IN |
187 |
114 |
51 |
11 |
8 |
3 |
14 |
|
|
Glendale, CA |
24 |
22 |
2 |
— |
— |
— |
1 |
|
Lansing, MI |
50 |
33 |
9 |
5 |
2 |
1 |
6 |
|
|
Honolulu, HI |
85 |
67 |
16 |
1 |
1 |
— |
12 |
|
Milwaukee, WI |
65 |
35 |
15 |
7 |
8 |
— |
— |
|
|
Long Beach, CA |
72 |
43 |
23 |
4 |
1 |
1 |
9 |
|
Peoria, IL |
U |
U |
U |
U |
U |
U |
U |
|
|
Los Angeles, CA |
238 |
146 |
63 |
17 |
8 |
4 |
21 |
|
Rockford, IL |
57 |
40 |
10 |
4 |
2 |
1 |
2 |
|
|
Pasadena, CA |
30 |
23 |
5 |
1 |
— |
1 |
3 |
|
South Bend, IN |
46 |
35 |
7 |
4 |
— |
— |
2 |
|
|
Portland, OR |
109 |
76 |
23 |
5 |
4 |
1 |
4 |
|
Toledo, OH |
108 |
71 |
21 |
11 |
1 |
4 |
7 |
|
|
Sacramento, CA |
249 |
171 |
56 |
15 |
3 |
4 |
12 |
|
Youngstown, OH |
59 |
46 |
7 |
5 |
1 |
— |
3 |
|
|
San Diego, CA |
167 |
119 |
31 |
8 |
2 |
6 |
9 |
|
W.N. Central |
510 |
340 |
120 |
28 |
10 |
11 |
40 |
|
|
San Francisco, CA |
113 |
83 |
24 |
4 |
1 |
1 |
11 |
|
Des Moines, IA |
— |
— |
— |
— |
— |
— |
— |
|
|
San Jose, CA |
196 |
138 |
41 |
7 |
5 |
5 |
11 |
|
Duluth, MN |
37 |
28 |
7 |
2 |
— |
— |
4 |
|
|
Santa Cruz, CA |
33 |
24 |
6 |
2 |
1 |
— |
— |
|
Kansas City, KS |
14 |
7 |
5 |
1 |
— |
1 |
1 |
|
|
Seattle, WA |
U |
U |
U |
U |
U |
U |
U |
|
Kansas City, MO |
62 |
42 |
13 |
4 |
2 |
1 |
1 |
|
|
Spokane, WA |
63 |
43 |
17 |
1 |
— |
2 |
3 |
|
Lincoln, NE |
45 |
36 |
9 |
— |
— |
— |
6 |
|
|
Tacoma, WA |
136 |
94 |
27 |
11 |
2 |
2 |
10 |
|
Minneapolis, MN |
55 |
33 |
15 |
2 |
2 |
3 |
7 |
|
|
Total§ |
10,557 |
7,018 |
2,412 |
717 |
238 |
169 |
548 |
|
Omaha, NE |
101 |
73 |
22 |
3 |
1 |
2 |
7 |
|
|
|
|
|
|
|
|
|
|
|
St. Louis, MO |
67 |
35 |
22 |
5 |
3 |
1 |
5 |
|
|
|
|
|
|
|
|
||
|
St. Paul, MN |
57 |
44 |
9 |
3 |
— |
1 |
3 |
|
|
|
|
|
|
|
|
||
|
Wichita, KS |
72 |
42 |
18 |
8 |
2 |
2 |
6 |
|
|
|
|
|
|
|
|
||
|
U: Unavailable. —: No reported cases. * Mortality data in this table are voluntarily reported from 122 cities in the United States, most of which have populations of >100,000. A death is reported by the place of its occurrence and by the week that the death certificate was filed. Fetal deaths are not included. † Pneumonia and influenza. § Total includes unknown ages. |
|||||||||||||||||
MMWR and Morbidity and Mortality Weekly Report are service marks of the U.S. Department of Health and Human Services.
Use of trade names and commercial sources is for identification only and does not imply endorsement by the U.S. Department of
Health and Human Services.
References to non-CDC sites on the Internet are
provided as a service to MMWR readers and do not constitute or imply
endorsement of these organizations or their programs by CDC or the U.S.
Department of Health and Human Services. CDC is not responsible for the content
of pages found at these sites. URL addresses listed in MMWR were current as of
the date of publication.
All HTML versions of MMWR articles are generated from final proofs through an automated process. This conversion might result in character translation or format errors in the HTML version. Users are referred to the electronic PDF version (https://www.cdc.gov/mmwr) and/or the original MMWR paper copy for printable versions of official text, figures, and tables.
Questions or messages regarding errors in formatting should be addressed to mmwrq@cdc.gov.
Table I Provisional cases of selected infrequently reported notifiable diseases (<1,000 cases reported during the preceding year) — United States, week ending September 3, 2016 (35th week)†
Figure I Selected notifiable disease reports, United States, comparison of provisional 4-week totals September 3, 2016, with historical data
Table II Provisional cases of selected notifiable diseases (≥1,000 cases reported during the preceding year), and selected low frequency diseases, United States and U.S. territories, weeks ending September 3, 2016, and September 5, 2015 (35th week)†
Table III Deaths in 122 U.S. cities, week ending September 3, 2016 (35th week)
|
TABLE I. Provisional cases of selected* infrequently reported notifiable diseases (<1,000 cases reported during the preceding year) — United States, week ending September 3, 2016 (35th week)† (Export data) |
|||||||||
|
Disease |
Current week |
Cum 2016 |
5-year weekly average§ |
Total cases reported for previous years |
States reporting cases during current week (No.) |
||||
|
2015 |
2014 |
2013 |
2012 |
2011 |
|||||
|
Anthrax |
— |
— |
0 |
— |
— |
— |
— |
1 |
|
|
Arboviral diseases¶,**: |
|||||||||
|
Chikungunya virus†† |
— |
69 |
4 |
896 |
NN |
NN |
NN |
NN |
|
|
Eastern equine encephalitis virus |
— |
1 |
1 |
6 |
8 |
8 |
15 |
4 |
|
|
Jamestown Canyon virus§§ |
— |
2 |
0 |
11 |
11 |
22 |
2 |
3 |
|
|
La Crosse virus§§ |
— |
6 |
2 |
55 |
80 |
85 |
78 |
130 |
|
|
Powassan virus |
— |
4 |
0 |
7 |
8 |
12 |
7 |
16 |
|
|
St. Louis encephalitis virus |
— |
2 |
0 |
23 |
10 |
1 |
3 |
6 |
|
|
Western equine encephalitis virus |
— |
— |
— |
— |
— |
— |
— |
— |
|
|
Botulism, total |
— |
116 |
3 |
195 |
161 |
152 |
168 |
153 |
|
|
foodborne |
— |
26 |
0 |
37 |
15 |
4 |
27 |
24 |
|
|
infant |
— |
76 |
2 |
138 |
127 |
136 |
123 |
97 |
|
|
other (wound and unspecified) |
— |
14 |
0 |
20 |
19 |
12 |
18 |
32 |
|
|
Brucellosis |
— |
76 |
3 |
126 |
92 |
99 |
114 |
79 |
|
|
Chancroid |
1 |
9 |
0 |
11 |
— |
— |
15 |
8 |
CA (1) |
|
Cholera |
— |
— |
0 |
2 |
5 |
14 |
17 |
40 |
|
|
Cyclosporiasis** |
2 |
321 |
11 |
645 |
388 |
784 |
123 |
151 |
OH (1), TX (1) |
|
Diphtheria |
— |
— |
— |
— |
1 |
— |
1 |
— |
|
|
Haemophilus influenzae invasive disease (age <5 yrs)¶¶: |
|||||||||
|
serotype b |
— |
11 |
1 |
29 |
40 |
31 |
30 |
14 |
|
|
nontypeable serotype |
— |
96 |
2 |
175 |
128 |
141 |
115 |
93 |
|
|
other serotype |
— |
79 |
1 |
135 |
266 |
233 |
263 |
230 |
|
|
unknown serotype |
2 |
139 |
3 |
167 |
39 |
34 |
37 |
48 |
VA (1), GA (1) |
|
Hansen’s disease** |
— |
29 |
1 |
89 |
88 |
81 |
82 |
82 |
|
|
Hantavirus infections**: |
|||||||||
|
Hantavirus infection (non-HPS)†† |
— |
2 |
0 |
1 |
NN |
NN |
NN |
NN |
|
|
Hantavirus Pulmonary Syndrome (HPS) |
— |
10 |
0 |
17 |
32 |
21 |
30 |
23 |
|
|
Hemolytic uremic syndrome, postdiarrheal** |
4 |
141 |
8 |
274 |
250 |
329 |
274 |
290 |
MI (1), NE (1), OR (1), CA (1) |
|
Hepatitis B, virus infection perinatal |
1 |
17 |
1 |
37 |
47 |
48 |
40 |
NP |
PA (1) |
|
Influenza-associated pediatric mortality**,*** |
— |
79 |
1 |
130 |
141 |
160 |
52 |
118 |
|
|
Leptospirosis** |
1 |
24 |
1 |
40 |
38 |
NN |
NN |
NN |
FL (1) |
|
Listeriosis |
14 |
391 |
24 |
766 |
769 |
735 |
727 |
870 |
NYC (1), PA (3), OH (3), MI (1), VA (2), SC (1), FL (3) |
|
Measles††† |
— |
51 |
3 |
188 |
667 |
187 |
55 |
220 |
|
|
Meningococcal disease, invasive§§§: |
|||||||||
|
serogroup ACWY |
— |
60 |
2 |
120 |
123 |
142 |
161 |
257 |
|
|
serogroup B |
1 |
49 |
1 |
111 |
89 |
99 |
110 |
159 |
NY (1) |
|
other serogroup |
— |
12 |
0 |
21 |
25 |
17 |
20 |
20 |
|
|
unknown serogroup |
3 |
129 |
3 |
120 |
196 |
298 |
260 |
323 |
FL (1), OR (2) |
|
Novel influenza A virus infections¶¶¶ |
— |
21 |
6 |
6 |
3 |
21 |
313 |
14 |
|
|
Plague |
— |
— |
0 |
13 |
10 |
4 |
4 |
3 |
|
|
Poliomyelitis, paralytic |
— |
— |
— |
— |
— |
1 |
— |
— |
|
|
Polio virus infection, nonparalytic** |
— |
— |
— |
— |
— |
— |
— |
— |
|
|
Psittacosis** |
— |
3 |
0 |
4 |
8 |
6 |
2 |
2 |
|
|
Q fever, total** |
— |
74 |
3 |
156 |
168 |
170 |
135 |
134 |
|
|
acute |
— |
60 |
3 |
122 |
132 |
137 |
113 |
110 |
|
|
chronic |
— |
14 |
1 |
34 |
36 |
33 |
22 |
24 |
|
|
Rabies, human |
— |
— |
0 |
1 |
1 |
2 |
1 |
6 |
|
|
SARS-CoV |
— |
— |
— |
— |
— |
— |
— |
— |
|
|
Smallpox |
— |
— |
— |
— |
— |
— |
— |
— |
|
|
Streptococcal toxic shock syndrome** |
— |
170 |
3 |
335 |
259 |
224 |
194 |
168 |
|
|
Syphilis, congenital**** |
— |
244 |
7 |
492 |
458 |
348 |
322 |
360 |
|
|
Toxic shock syndrome (staphylococcal)** |
— |
19 |
1 |
64 |
59 |
71 |
65 |
78 |
|
|
Trichinellosis** |
— |
8 |
0 |
11 |
14 |
22 |
18 |
15 |
|
|
Tularemia |
1 |
122 |
5 |
314 |
180 |
203 |
149 |
166 |
WY (1) |
|
Typhoid fever |
4 |
195 |
10 |
367 |
349 |
338 |
354 |
390 |
MA (1), NYC (3) |
|
Vancomycin-intermediate Staphylococcus aureus** |
1 |
67 |
3 |
183 |
212 |
248 |
134 |
82 |
OH (1) |
|
Vancomycin-resistant Staphylococcus aureus** |
— |
— |
— |
1 |
— |
— |
2 |
— |
|
|
TABLE I. (Continued) Provisional cases of selected* infrequently reported notifiable diseases (<1,000 cases reported during the preceding year) — United States, week ending September 3, 2016 (35th week)† (Export data) |
|||||||||
|
Disease |
Current week |
Cum 2016 |
5-year weekly average§ |
Total cases reported for previous years |
States reporting cases during current week (No.) |
||||
|
2015 |
2014 |
2013 |
2012 |
2011 |
|||||
|
Viral hemorrhagic fevers††††: |
|||||||||
|
Crimean-Congo hemorrhagic fever |
— |
— |
— |
— |
NP |
NP |
NP |
NP |
|
|
Ebola hemorrhagic fever |
— |
— |
— |
— |
4 |
NP |
NP |
NP |
|
|
Guanarito hemorrhagic fever |
— |
— |
— |
— |
NP |
NP |
NP |
NP |
|
|
Junin hemorrhagic fever |
— |
— |
— |
— |
NP |
NP |
NP |
NP |
|
|
Lassa fever |
— |
— |
— |
— |
1 |
NP |
NP |
NP |
|
|
Lujo virus |
— |
— |
— |
— |
NP |
NP |
NP |
NP |
|
|
Machupo hemorrhagic fever |
— |
— |
— |
— |
NP |
NP |
NP |
NP |
|
|
Marburg fever |
— |
— |
— |
— |
NP |
NP |
NP |
NP |
|
|
Sabia-associated hemorrhagic fever |
— |
— |
— |
— |
NP |
NP |
NP |
NP |
|
|
Yellow fever |
— |
— |
— |
— |
— |
— |
— |
— |
|
|
Zika virus††,§§§§ |
|||||||||
|
Zika virus congenital infection |
NA |
NA |
NA |
NN |
NN |
NN |
NN |
NN |
|
|
Zika virus disease, non-congenital infection |
4 |
2,900 |
— |
NN |
NN |
NN |
NN |
NN |
NYC (1), VA (1), MS (1), TX (1) |
|
—: No reported cases. N: Not reportable. NA: Not available. NN: Not Nationally Notifiable. NP: Nationally notifiable but not published. Cum: Cumulative year-to-date counts. * Case counts for reporting years 2015 and 2016 are provisional and subject to change. Data for years 2011 through 2014 are finalized. For further information on interpretation of these data, see http://wwwn.cdc.gov/nndss/document/ProvisionalNationaNotifiableDiseasesSurveillanceData20100927.pdfCdc-pdf. † This table does not include cases from the U.S. territories. Three low incidence conditions, rubella, rubella congenital, and tetanus, are in Table II to facilitate case count verification with reporting jurisdictions. § Calculated by summing the incidence counts for the current week, the 2 weeks preceding the current week, and the 2 weeks following the current week, for a total of 5 preceding years. Additional information is available at http://wwwn.cdc.gov/nndss/document/5yearweeklyaverage.pdfCdc-pdf. ¶ Includes both neuroinvasive and nonneuroinvasive. Updated weekly reports from the Division of Vector-Borne Diseases, National Center for Emerging and Zoonotic Infectious Diseases (ArboNET Surveillance). Data for West Nile virus are available in Table II. ** Not reportable in all reporting jurisdictions. Data from states where the condition is not reportable are excluded from this table, except for the arboviral diseases and influenza-associated pediatric mortality. Reporting exceptions are available at http://wwwn.cdc.gov/nndss/downloads.html. †† Office of Management and Budget approval of the NNDSS Revision #0920-0728 on January 21, 2016, authorized CDC to receive data for these conditions. CDC is in the process of soliciting data for these conditions (except Zika virus, congenital infection). CDC and the U.S. states are still modifying the technical infrastructure needed to collect and transmit data for Zika virus congenital infections. §§ Jamestown Canyon virus and Lacrosse virus have replaced California serogroup diseases. ¶¶ Data for Haemophilus influenzae (all ages, all serotypes) are available in Table II. *** Updated weekly from the Influenza Division, National Center for Immunization and Respiratory Diseases. Since October 4, 2015, 85 influenza-associated pediatric deaths occurring during the 2015-16 influenza season have been reported. ††† No measles cases were reported for the current week. §§§ Data for meningococcal disease (all serogroups) are available in Table II. ¶¶¶ All cases of novel influenza A virus infection reported to CDC since 2011 have been variant viruses. Influenza viruses that circulate in swine are called swine influenza viruses when isolated from swine, but are called variant viruses when isolated from humans. Variant influenza viruses are different from the influenza A (H1N1)pdm09 virus. Total case counts are provided by the Influenza Division, National Center for Immunization and Respiratory Diseases (NCIRD). **** Updated weekly from reports to the Division of STD Prevention, National Center for HIV/AIDS, Viral Hepatitis, STD, and TB Prevention. †††† Prior to 2015, CDC’s National Notifiable Diseases Surveillance System (NNDSS) did not receive electronic data about incident cases of specific viral hemorrhagic fevers; instead data were collected in aggregate as “viral hemorrhagic fevers”. Beginning in 2015, NNDSS has been updated to receive data for each of the viral hemorrhagic fevers listed below. In addition to the four cases of Ebola diagnosed in the United States to date in 2014, six residents of the United States have been medically evacuated to the United States for care after developing Ebola in West Africa. Ten of the 11 Viral Hemorrhagic Fever cases reported for 2014 are confirmed as Ebola and one as Lassa fever. §§§§ All cases reported have occurred in travelers returning from affected areas, with their sexual contacts, or infants infected in utero. |
|||||||||
FIGURE I. Selected notifiable disease reports, United States, comparison of provisional 4-week totals September 3, 2016, with historical data
* No measles cases were reported for the current 4-week period yielding a ratio for week 35 of zero (0).
† Ratio of current 4-week total to mean of 15 4-week totals (from previous, comparable, and subsequent 4-week periods for the past 5 years). The point where the hatched area begins is based on the mean and two standard deviations of these 4-week totals.
|
TABLE II. Provisional cases of selected notifiable diseases (≥1,000 cases reported during the preceding year), and selected* low frequency diseases, United States and U.S. territories, weeks ending September 3, 2016, and September 5, 2015 (35th week)† (Export data) |
||||||||||
|
Reporting area |
Babesiosis |
Campylobacteriosis |
||||||||
|
Current week |
Previous 52 weeks |
Cum 2016 |
Cum 2015 |
Current week |
Previous 52 weeks |
Cum 2016 |
Cum 2015 |
|||
|
Med |
Max |
Med |
Max |
|||||||
|
United States |
6 |
16 |
121 |
925 |
1,588 |
473 |
971 |
3,038 |
32,629 |
36,386 |
|
New England |
3 |
8 |
68 |
548 |
896 |
34 |
53 |
91 |
1,848 |
2,143 |
|
Connecticut |
— |
1 |
7 |
47 |
297 |
— |
11 |
33 |
362 |
561 |
|
Maine |
2 |
0 |
11 |
65 |
36 |
4 |
5 |
11 |
165 |
142 |
|
Massachusetts |
— |
3 |
44 |
349 |
380 |
27 |
28 |
44 |
929 |
977 |
|
New Hampshire |
— |
0 |
2 |
9 |
40 |
2 |
4 |
12 |
128 |
184 |
|
Rhode Island |
1 |
1 |
21 |
72 |
137 |
— |
4 |
18 |
131 |
159 |
|
Vermont |
— |
0 |
4 |
6 |
6 |
1 |
4 |
9 |
133 |
120 |
|
Mid. Atlantic |
3 |
7 |
109 |
335 |
573 |
51 |
139 |
213 |
4,627 |
5,412 |
|
New Jersey |
— |
1 |
14 |
99 |
271 |
— |
33 |
56 |
1,007 |
1,276 |
|
New York (Upstate) |
— |
4 |
109 |
191 |
240 |
— |
32 |
89 |
1,040 |
1,273 |
|
New York City |
3 |
0 |
11 |
45 |
62 |
28 |
33 |
54 |
1,129 |
1,153 |
|
Pennsylvania |
N |
0 |
0 |
N |
N |
23 |
40 |
81 |
1,451 |
1,710 |
|
E.N. Central |
— |
0 |
5 |
31 |
58 |
74 |
121 |
215 |
4,835 |
3,791 |
|
Illinois |
— |
0 |
1 |
1 |
3 |
1 |
25 |
63 |
1,125 |
— |
|
Indiana |
— |
0 |
0 |
— |
— |
1 |
15 |
24 |
461 |
645 |
|
Michigan |
— |
0 |
0 |
— |
3 |
13 |
23 |
42 |
885 |
957 |
|
Ohio |
— |
0 |
0 |
— |
2 |
50 |
34 |
63 |
1,345 |
1,204 |
|
Wisconsin |
— |
0 |
5 |
30 |
50 |
9 |
27 |
58 |
1,019 |
985 |
|
W.N. Central |
— |
0 |
3 |
2 |
44 |
21 |
70 |
131 |
1,908 |
3,565 |
|
Iowa |
N |
0 |
0 |
N |
N |
11 |
17 |
44 |
725 |
510 |
|
Kansas |
N |
0 |
0 |
N |
N |
— |
11 |
27 |
406 |
491 |
|
Minnesota |
— |
0 |
3 |
— |
42 |
— |
0 |
37 |
1 |
963 |
|
Missouri |
N |
0 |
0 |
N |
N |
— |
0 |
32 |
16 |
857 |
|
Nebraska |
— |
0 |
1 |
1 |
— |
10 |
8 |
26 |
396 |
373 |
|
North Dakota |
— |
0 |
1 |
1 |
2 |
— |
2 |
9 |
79 |
129 |
|
South Dakota |
— |
0 |
0 |
— |
— |
— |
7 |
24 |
285 |
242 |
|
S. Atlantic |
— |
0 |
1 |
5 |
5 |
79 |
146 |
285 |
4,542 |
6,218 |
|
Delaware |
— |
0 |
1 |
1 |
1 |
— |
2 |
7 |
84 |
104 |
|
District of Columbia |
N |
0 |
0 |
N |
N |
N |
0 |
0 |
N |
N |
|
Florida |
N |
0 |
0 |
N |
N |
42 |
48 |
83 |
1,383 |
2,514 |
|
Georgia |
N |
0 |
0 |
N |
N |
11 |
18 |
32 |
611 |
771 |
|
Maryland |
— |
0 |
1 |
3 |
2 |
15 |
14 |
32 |
550 |
563 |
|
North Carolina |
N |
0 |
0 |
N |
N |
— |
24 |
82 |
624 |
783 |
|
South Carolina |
— |
0 |
1 |
1 |
2 |
1 |
6 |
16 |
168 |
224 |
|
Virginia |
N |
0 |
0 |
N |
N |
10 |
26 |
81 |
973 |
1,044 |
|
West Virginia |
— |
0 |
0 |
— |
— |
— |
5 |
13 |
149 |
215 |
|
E.S. Central |
— |
0 |
0 |
— |
3 |
10 |
43 |
80 |
1,451 |
1,615 |
|
Alabama |
— |
0 |
0 |
— |
2 |
— |
13 |
25 |
413 |
400 |
|
Kentucky |
— |
0 |
0 |
— |
— |
2 |
13 |
35 |
427 |
551 |
|
Mississippi |
N |
0 |
0 |
N |
N |
— |
4 |
13 |
132 |
127 |
|
Tennessee |
— |
0 |
0 |
— |
1 |
8 |
13 |
28 |
479 |
537 |
|
W.S. Central |
— |
0 |
1 |
1 |
2 |
67 |
106 |
261 |
3,691 |
3,934 |
|
Arkansas |
— |
0 |
0 |
— |
— |
12 |
9 |
29 |
360 |
295 |
|
Louisiana |
— |
0 |
1 |
1 |
1 |
— |
7 |
21 |
252 |
370 |
|
Oklahoma |
N |
0 |
0 |
N |
N |
26 |
19 |
45 |
716 |
568 |
|
Texas |
— |
0 |
0 |
— |
1 |
29 |
70 |
202 |
2,363 |
2,701 |
|
Mountain |
— |
0 |
1 |
1 |
— |
17 |
68 |
106 |
2,086 |
2,992 |
|
Arizona |
— |
0 |
0 |
— |
— |
6 |
22 |
49 |
783 |
1,002 |
|
Colorado |
N |
0 |
0 |
N |
N |
— |
0 |
25 |
1 |
637 |
|
Idaho |
N |
0 |
0 |
N |
N |
9 |
8 |
20 |
306 |
265 |
|
Montana |
— |
0 |
1 |
1 |
— |
2 |
6 |
14 |
251 |
236 |
|
Nevada |
N |
0 |
0 |
N |
N |
— |
2 |
8 |
61 |
118 |
|
New Mexico |
N |
0 |
0 |
N |
N |
— |
8 |
18 |
265 |
326 |
|
Utah |
— |
0 |
0 |
— |
— |
— |
9 |
25 |
313 |
305 |
|
Wyoming |
— |
0 |
0 |
— |
— |
— |
3 |
8 |
106 |
103 |
|
Pacific |
— |
0 |
2 |
2 |
7 |
120 |
200 |
1,992 |
7,641 |
6,716 |
|
Alaska |
N |
0 |
0 |
N |
N |
6 |
2 |
5 |
73 |
54 |
|
California |
— |
0 |
1 |
1 |
5 |
88 |
159 |
239 |
5,537 |
5,625 |
|
Hawaii |
N |
0 |
0 |
N |
N |
— |
10 |
25 |
360 |
397 |
|
Oregon |
— |
0 |
1 |
1 |
2 |
17 |
16 |
35 |
673 |
640 |
|
Washington |
— |
0 |
2 |
— |
— |
9 |
14 |
1,841 |
998 |
— |
|
Territories |
||||||||||
|
American Samoa |
U |
0 |
0 |
U |
U |
— |
0 |
0 |
— |
— |
|
C.N.M.I. |
— |
— |
— |
— |
— |
— |
— |
— |
— |
— |
|
Guam |
— |
0 |
0 |
— |
— |
— |
0 |
1 |
— |
2 |
|
Puerto Rico |
N |
0 |
0 |
N |
N |
— |
0 |
3 |
20 |
22 |
|
U.S. Virgin Islands |
N |
0 |
0 |
N |
N |
— |
0 |
0 |
— |
— |
|
C.N.M.I.: Commonwealth of Northern Mariana Islands. U: Unavailable. —: No reported cases. N: Not reportable. NN: Not Nationally Notifiable. NP: Nationally notifiable but not published. Cum: Cumulative year-to-date counts. Med: Median. Max: Maximum. * Three low incidence conditions, rubella, rubella congenital, and tetanus, are in Table II to facilitate case count verification with reporting jurisdictions. † Case counts for reporting year 2015 and 2016 are provisional and subject to change. For further information on interpretation of these data, see http://wwwn.cdc.gov/nndss/document/ProvisionalNationaNotifiableDiseasesSurveillanceData20100927.pdfCdc-pdf. Data for TB are displayed in Table IV, which appears quarterly. |
||||||||||
|
TABLE II. (Continued) Provisional cases of selected notifiable diseases (≥1,000 cases reported during the preceding year), and selected* low frequency diseases, United States and U.S. territories, weeks ending September 3, 2016, and September 5, 2015 (35th week)† (Export data) |
||||||||||
|
Reporting area |
Chlamydia trachomatis infection |
Coccidioidomycosis |
||||||||
|
Current week |
Previous 52 weeks |
Cum 2016 |
Cum 2015 |
Current week |
Previous 52 weeks |
Cum 2016 |
Cum 2015 |
|||
|
Med |
Max |
Med |
Max |
|||||||
|
United States |
15,552 |
29,508 |
32,854 |
967,986 |
1,014,753 |
88 |
188 |
369 |
5,967 |
6,568 |
|
New England |
579 |
1,036 |
1,285 |
32,584 |
32,669 |
— |
0 |
1 |
2 |
— |
|
Connecticut |
5 |
240 |
484 |
5,319 |
8,544 |
N |
0 |
0 |
N |
N |
|
Maine |
113 |
76 |
134 |
2,759 |
2,675 |
N |
0 |
0 |
N |
N |
|
Massachusetts |
342 |
496 |
588 |
17,234 |
15,972 |
N |
0 |
0 |
N |
N |
|
New Hampshire |
33 |
118 |
225 |
3,879 |
1,107 |
— |
0 |
1 |
2 |
— |
|
Rhode Island |
86 |
71 |
227 |
2,488 |
3,102 |
— |
0 |
0 |
— |
— |
|
Vermont |
— |
31 |
58 |
905 |
1,269 |
N |
0 |
0 |
N |
N |
|
Mid. Atlantic |
2,334 |
3,819 |
4,287 |
131,175 |
125,763 |
— |
0 |
0 |
— |
— |
|
New Jersey |
201 |
629 |
1,129 |
22,674 |
21,614 |
N |
0 |
0 |
N |
N |
|
New York (Upstate) |
828 |
801 |
1,499 |
26,791 |
26,615 |
N |
0 |
0 |
N |
N |
|
New York City |
455 |
1,280 |
1,406 |
43,477 |
41,997 |
N |
0 |
0 |
N |
N |
|
Pennsylvania |
850 |
1,097 |
1,381 |
38,233 |
35,537 |
N |
0 |
0 |
N |
N |
|
E.N. Central |
903 |
4,270 |
5,133 |
137,093 |
150,100 |
— |
1 |
6 |
39 |
27 |
|
Illinois |
75 |
1,056 |
1,558 |
32,811 |
46,931 |
N |
0 |
0 |
N |
N |
|
Indiana |
207 |
598 |
1,223 |
20,289 |
18,640 |
N |
0 |
0 |
N |
N |
|
Michigan |
308 |
921 |
1,182 |
29,867 |
30,530 |
— |
0 |
3 |
25 |
15 |
|
Ohio |
— |
1,158 |
1,355 |
36,819 |
37,882 |
— |
0 |
4 |
13 |
6 |
|
Wisconsin |
313 |
503 |
609 |
17,307 |
16,117 |
— |
0 |
1 |
1 |
6 |
|
W.N. Central |
382 |
1,762 |
1,980 |
57,627 |
59,777 |
— |
1 |
7 |
60 |
81 |
|
Iowa |
69 |
249 |
282 |
8,170 |
8,059 |
N |
0 |
0 |
N |
N |
|
Kansas |
— |
225 |
297 |
7,578 |
7,753 |
N |
0 |
0 |
N |
N |
|
Minnesota |
— |
419 |
526 |
12,468 |
14,219 |
— |
1 |
4 |
50 |
61 |
|
Missouri |
227 |
581 |
693 |
19,971 |
19,664 |
— |
0 |
1 |
— |
7 |
|
Nebraska |
86 |
153 |
246 |
5,323 |
5,319 |
— |
0 |
1 |
4 |
7 |
|
North Dakota |
— |
61 |
91 |
2,089 |
2,131 |
— |
0 |
1 |
2 |
6 |
|
South Dakota |
— |
79 |
119 |
2,028 |
2,632 |
— |
0 |
1 |
4 |
— |
|
S. Atlantic |
3,152 |
5,978 |
7,463 |
191,281 |
213,335 |
— |
0 |
1 |
4 |
5 |
|
Delaware |
100 |
92 |
150 |
3,298 |
2,929 |
— |
0 |
1 |
1 |
— |
|
District of Columbia |
77 |
152 |
282 |
5,302 |
5,736 |
— |
0 |
0 |
— |
— |
|
Florida |
911 |
1,847 |
2,249 |
61,520 |
60,187 |
N |
0 |
0 |
N |
N |
|
Georgia |
390 |
931 |
1,288 |
29,945 |
39,360 |
N |
0 |
0 |
N |
N |
|
Maryland |
534 |
604 |
1,033 |
18,207 |
16,056 |
— |
0 |
1 |
3 |
5 |
|
North Carolina |
3 |
1,062 |
2,097 |
23,238 |
42,646 |
N |
0 |
0 |
N |
N |
|
South Carolina |
403 |
591 |
789 |
19,331 |
18,446 |
N |
0 |
0 |
N |
N |
|
Virginia |
682 |
729 |
1,358 |
27,350 |
24,608 |
N |
0 |
0 |
N |
N |
|
West Virginia |
52 |
90 |
186 |
3,090 |
3,367 |
N |
0 |
0 |
N |
N |
|
E.S. Central |
696 |
1,790 |
2,491 |
54,972 |
59,349 |
— |
0 |
0 |
— |
— |
|
Alabama |
— |
529 |
739 |
15,671 |
18,717 |
N |
0 |
0 |
N |
N |
|
Kentucky |
451 |
315 |
1,462 |
10,297 |
9,211 |
— |
0 |
0 |
— |
— |
|
Mississippi |
— |
376 |
655 |
10,940 |
9,663 |
N |
0 |
0 |
N |
N |
|
Tennessee |
245 |
586 |
791 |
18,064 |
21,758 |
N |
0 |
0 |
N |
N |
|
W.S. Central |
4,142 |
4,000 |
5,964 |
136,437 |
137,518 |
— |
0 |
2 |
8 |
4 |
|
Arkansas |
334 |
361 |
684 |
10,091 |
8,649 |
— |
0 |
2 |
1 |
2 |
|
Louisiana |
958 |
572 |
3,041 |
19,982 |
19,378 |
— |
0 |
1 |
7 |
2 |
|
Oklahoma |
64 |
305 |
483 |
9,526 |
14,202 |
N |
0 |
0 |
N |
N |
|
Texas |
2,786 |
2,779 |
4,611 |
96,838 |
95,289 |
N |
0 |
0 |
N |
N |
|
Mountain |
849 |
1,973 |
2,473 |
66,439 |
68,676 |
87 |
126 |
284 |
4,120 |
4,647 |
|
Arizona |
523 |
621 |
874 |
21,442 |
21,403 |
87 |
125 |
282 |
4,083 |
4,502 |
|
Colorado |
— |
463 |
826 |
16,025 |
16,429 |
N |
0 |
0 |
N |
N |
|
Idaho |
98 |
111 |
212 |
4,008 |
3,724 |
N |
0 |
0 |
N |
N |
|
Montana |
80 |
82 |
114 |
2,894 |
2,754 |
— |
0 |
1 |
7 |
8 |
|
Nevada |
— |
206 |
319 |
6,291 |
8,621 |
— |
0 |
7 |
7 |
62 |
|
New Mexico |
7 |
239 |
337 |
8,177 |
8,698 |
— |
0 |
2 |
11 |
25 |
|
Utah |
118 |
183 |
220 |
6,290 |
5,696 |
— |
0 |
2 |
11 |
40 |
|
Wyoming |
23 |
38 |
73 |
1,312 |
1,351 |
— |
0 |
1 |
1 |
10 |
|
Pacific |
2,515 |
4,837 |
5,293 |
160,378 |
167,566 |
1 |
60 |
99 |
1,734 |
1,804 |
|
Alaska |
— |
104 |
189 |
2,987 |
3,578 |
N |
0 |
0 |
N |
N |
|
California |
1,711 |
3,724 |
4,233 |
127,026 |
129,228 |
1 |
60 |
99 |
1,729 |
1,797 |
|
Hawaii |
— |
133 |
162 |
4,029 |
4,844 |
N |
0 |
0 |
N |
N |
|
Oregon |
348 |
328 |
432 |
11,132 |
10,902 |
— |
0 |
2 |
5 |
7 |
|
Washington |
456 |
472 |
744 |
15,204 |
19,014 |
N |
0 |
0 |
N |
N |
|
Territories |
||||||||||
|
American Samoa |
— |
0 |
0 |
— |
— |
N |
0 |
0 |
N |
N |
|
C.N.M.I. |
— |
— |
— |
— |
— |
— |
— |
— |
— |
— |
|
Guam |
— |
0 |
0 |
— |
— |
— |
0 |
0 |
— |
— |
|
Puerto Rico |
122 |
106 |
481 |
5,157 |
3,705 |
N |
0 |
0 |
N |
N |
|
U.S. Virgin Islands |
— |
11 |
28 |
331 |
532 |
— |
0 |
0 |
— |
— |
|
C.N.M.I.: Commonwealth of Northern Mariana Islands. U: Unavailable. —: No reported cases. N: Not reportable. NN: Not Nationally Notifiable. NP: Nationally notifiable but not published. Cum: Cumulative year-to-date counts. Med: Median. Max: Maximum. * Three low incidence conditions, rubella, rubella congenital, and tetanus, are in Table II to facilitate case count verification with reporting jurisdictions. † Case counts for reporting years 2015 and 2016 are provisional and subject to change. For further information on interpretation of these data, see http://wwwn.cdc.gov/nndss/document/ProvisionalNationaNotifiableDiseasesSurveillanceData20100927.pdfCdc-pdf. Data for TB are displayed in Table IV, which appears quarterly. |
||||||||||
|
TABLE II. (Continued) Provisional cases of selected notifiable diseases (≥1,000 cases reported during the preceding year), and selected* low frequency diseases, United States and U.S. territories, weeks ending September 3, 2016, and September 5, 2015 (35th week)† (Export data) |
|||||||||||||||
|
Reporting area |
Cryptosporidiosis |
Dengue Virus Infection |
|||||||||||||
|
Dengue§ |
Severe Dengue |
||||||||||||||
|
Current week |
Previous 52 weeks |
Cum 2016 |
Cum 2015 |
Current week |
Previous 52 weeks |
Cum 2016 |
Cum 2015 |
Current week |
Previous 52 weeks |
Cum 2016 |
Cum 2015 |
||||
|
Med |
Max |
Med |
Max |
Med |
Max |
||||||||||
|
United States |
391 |
148 |
516 |
6,282 |
5,745 |
2 |
14 |
47 |
434 |
408 |
— |
0 |
1 |
3 |
4 |
|
New England |
10 |
8 |
26 |
251 |
273 |
— |
0 |
2 |
7 |
16 |
— |
0 |
0 |
— |
— |
|
Connecticut |
— |
1 |
3 |
23 |
53 |
— |
0 |
2 |
3 |
3 |
— |
0 |
0 |
— |
— |
|
Maine |
— |
1 |
4 |
31 |
21 |
— |
0 |
1 |
— |
1 |
— |
0 |
0 |
— |
— |
|
Massachusetts |
8 |
4 |
13 |
134 |
127 |
— |
0 |
1 |
— |
5 |
— |
0 |
0 |
— |
— |
|
New Hampshire |
— |
0 |
4 |
28 |
26 |
— |
0 |
0 |
— |
1 |
— |
0 |
0 |
— |
— |
|
Rhode Island |
2 |
0 |
4 |
9 |
11 |
— |
0 |
1 |
2 |
3 |
— |
0 |
0 |
— |
— |
|
Vermont |
— |
1 |
7 |
26 |
35 |
— |
0 |
1 |
2 |
3 |
— |
0 |
0 |
— |
— |
|
Mid. Atlantic |
21 |
14 |
40 |
546 |
492 |
— |
3 |
11 |
78 |
99 |
— |
0 |
1 |
— |
1 |
|
New Jersey |
— |
1 |
7 |
42 |
49 |
— |
1 |
4 |
39 |
33 |
— |
0 |
0 |
— |
— |
|
New York (Upstate) |
— |
5 |
16 |
164 |
143 |
— |
0 |
5 |
25 |
18 |
— |
0 |
0 |
— |
— |
|
New York City |
10 |
2 |
10 |
96 |
78 |
— |
0 |
5 |
— |
36 |
— |
0 |
1 |
— |
1 |
|
Pennsylvania |
11 |
6 |
19 |
244 |
222 |
— |
0 |
3 |
14 |
12 |
— |
0 |
0 |
— |
— |
|
E.N. Central |
229 |
30 |
225 |
1,871 |
1,025 |
— |
1 |
4 |
38 |
36 |
— |
0 |
1 |
1 |
— |
|
Illinois |
— |
3 |
60 |
138 |
106 |
— |
0 |
2 |
12 |
19 |
— |
0 |
0 |
— |
— |
|
Indiana |
— |
3 |
8 |
104 |
128 |
— |
0 |
2 |
6 |
— |
— |
0 |
1 |
1 |
— |
|
Michigan |
5 |
5 |
19 |
241 |
149 |
— |
0 |
3 |
10 |
8 |
— |
0 |
0 |
— |
— |
|
Ohio |
208 |
8 |
189 |
933 |
261 |
— |
0 |
1 |
4 |
6 |
— |
0 |
0 |
— |
— |
|
Wisconsin |
16 |
11 |
44 |
455 |
381 |
— |
0 |
2 |
6 |
3 |
— |
0 |
0 |
— |
— |
|
W.N. Central |
11 |
23 |
98 |
666 |
1,032 |
— |
0 |
3 |
18 |
22 |
— |
0 |
0 |
— |
1 |
|
Iowa |
1 |
9 |
25 |
348 |
243 |
— |
0 |
1 |
4 |
3 |
— |
0 |
0 |
— |
— |
|
Kansas |
— |
2 |
11 |
60 |
122 |
— |
0 |
1 |
4 |
3 |
— |
0 |
0 |
— |
— |
|
Minnesota |
— |
0 |
18 |
— |
195 |
— |
0 |
3 |
3 |
11 |
— |
0 |
0 |
— |
1 |
|
Missouri |
— |
0 |
30 |
5 |
211 |
— |
0 |
2 |
6 |
2 |
— |
0 |
0 |
— |
— |
|
Nebraska |
10 |
3 |
21 |
133 |
134 |
— |
0 |
1 |
— |
1 |
— |
0 |
0 |
— |
— |
|
North Dakota |
— |
0 |
4 |
22 |
12 |
— |
0 |
0 |
— |
1 |
— |
0 |
0 |
— |
— |
|
South Dakota |
— |
4 |
19 |
98 |
115 |
— |
0 |
1 |
1 |
1 |
— |
0 |
0 |
— |
— |
|
S. Atlantic |
28 |
28 |
75 |
893 |
1,132 |
1 |
3 |
9 |
81 |
79 |
— |
0 |
1 |
1 |
— |
|
Delaware |
— |
0 |
2 |
11 |
9 |
— |
0 |
1 |
2 |
1 |
— |
0 |
0 |
— |
— |
|
District of Columbia |
— |
0 |
0 |
— |
— |
— |
0 |
1 |
2 |
8 |
— |
0 |
1 |
— |
— |
|
Florida |
16 |
12 |
40 |
331 |
553 |
— |
1 |
6 |
36 |
34 |
— |
0 |
0 |
— |
— |
|
Georgia |
7 |
6 |
23 |
218 |
218 |
1 |
0 |
2 |
14 |
4 |
— |
0 |
0 |
— |
— |
|
Maryland |
2 |
2 |
7 |
49 |
48 |
— |
0 |
2 |
13 |
7 |
— |
0 |
1 |
— |
— |
|
North Carolina |
— |
4 |
25 |
101 |
128 |
— |
0 |
1 |
3 |
5 |
— |
0 |
0 |
— |
— |
|
South Carolina |
— |
1 |
5 |
39 |
47 |
— |
0 |
2 |
3 |
3 |
— |
0 |
1 |
1 |
— |
|
Virginia |
3 |
4 |
46 |
133 |
117 |
— |
0 |
2 |
8 |
16 |
— |
0 |
0 |
— |
— |
|
West Virginia |
— |
0 |
2 |
11 |
12 |
— |
0 |
0 |
— |
1 |
— |
0 |
0 |
— |
— |
|
E.S. Central |
5 |
10 |
33 |
366 |
450 |
1 |
0 |
2 |
6 |
13 |
— |
0 |
0 |
— |
— |
|
Alabama |
2 |
4 |
21 |
162 |
181 |
— |
0 |
1 |
1 |
3 |
— |
0 |
0 |
— |
— |
|
Kentucky |
1 |
2 |
6 |
78 |
66 |
— |
0 |
0 |
— |
1 |
— |
0 |
0 |
— |
— |
|
Mississippi |
— |
1 |
3 |
24 |
25 |
— |
0 |
1 |
— |
1 |
— |
0 |
0 |
— |
— |
|
Tennessee |
2 |
4 |
17 |
102 |
178 |
1 |
0 |
1 |
5 |
8 |
— |
0 |
0 |
— |
— |
|
W.S. Central |
17 |
18 |
78 |
581 |
585 |
— |
1 |
4 |
24 |
20 |
— |
0 |
0 |
— |
2 |
|
Arkansas |
1 |
1 |
8 |
47 |
40 |
— |
0 |
1 |
1 |
— |
— |
0 |
0 |
— |
— |
|
Louisiana |
— |
1 |
6 |
50 |
99 |
— |
0 |
1 |
1 |
2 |
— |
0 |
0 |
— |
— |
|
Oklahoma |
6 |
3 |
36 |
121 |
50 |
— |
0 |
1 |
1 |
2 |
— |
0 |
0 |
— |
— |
|
Texas |
10 |
11 |
34 |
363 |
396 |
— |
1 |
3 |
21 |
16 |
— |
0 |
0 |
— |
2 |
|
Mountain |
67 |
10 |
90 |
632 |
376 |
— |
1 |
4 |
27 |
16 |
— |
0 |
0 |
— |
— |
|
Arizona |
56 |
1 |
87 |
353 |
40 |
— |
0 |
4 |
11 |
9 |
— |
0 |
0 |
— |
— |
|
Colorado |
— |
0 |
10 |
1 |
71 |
— |
0 |
2 |
8 |
3 |
— |
0 |
0 |
— |
— |
|
Idaho |
2 |
2 |
10 |
75 |
60 |
— |
0 |
1 |
3 |
1 |
— |
0 |
0 |
— |
— |
|
Montana |
2 |
1 |
5 |
44 |
28 |
— |
0 |
2 |
1 |
1 |
— |
0 |
0 |
— |
— |
|
Nevada |
— |
0 |
3 |
7 |
5 |
— |
0 |
2 |
3 |
1 |
— |
0 |
0 |
— |
— |
|
New Mexico |
— |
1 |
4 |
36 |
35 |
— |
0 |
1 |
— |
— |
— |
0 |
0 |
— |
— |
|
Utah |
7 |
3 |
7 |
106 |
115 |
— |
0 |
1 |
1 |
1 |
— |
0 |
0 |
— |
— |
|
Wyoming |
— |
0 |
2 |
10 |
22 |
— |
0 |
0 |
— |
— |
— |
0 |
0 |
— |
— |
|
Pacific |
3 |
14 |
128 |
476 |
380 |
— |
4 |
30 |
154 |
107 |
— |
0 |
1 |
1 |
— |
|
Alaska |
— |
0 |
2 |
6 |
4 |
— |
0 |
1 |
2 |
— |
— |
0 |
0 |
— |
— |
|
California |
3 |
7 |
12 |
234 |
236 |
— |
2 |
15 |
82 |
87 |
— |
0 |
0 |
— |
— |
|
Hawaii |
— |
0 |
3 |
— |
15 |
— |
1 |
25 |
54 |
9 |
— |
0 |
0 |
— |
— |
|
Oregon |
— |
6 |
11 |
181 |
125 |
— |
0 |
1 |
4 |
3 |
— |
0 |
0 |
— |
— |
|
Washington |
— |
0 |
110 |
55 |
— |
— |
0 |
3 |
12 |
8 |
— |
0 |
1 |
1 |
— |
|
Territories |
|||||||||||||||
|
American Samoa |
N |
0 |
0 |
N |
N |
— |
0 |
0 |
— |
— |
— |
0 |
0 |
— |
— |
|
C.N.M.I. |
— |
— |
— |
— |
— |
— |
— |
— |
— |
— |
— |
— |
— |
— |
— |
|
Guam |
— |
0 |
0 |
— |
— |
— |
0 |
0 |
— |
— |
— |
0 |
0 |
— |
— |
|
Puerto Rico |
— |
0 |
0 |
— |
— |
— |
3 |
27 |
163 |
30 |
— |
0 |
0 |
— |
— |
|
U.S. Virgin Islands |
— |
0 |
0 |
— |
— |
— |
0 |
5 |
34 |
3 |
— |
0 |
0 |
— |
— |
|
C.N.M.I.: Commonwealth of Northern Mariana Islands. U: Unavailable. —: No reported cases. N: Not reportable. NN: Not Nationally Notifiable. NP: Nationally notifiable but not published. Cum: Cumulative year-to-date counts. Med: Median. Max: Maximum. * Three low incidence conditions, rubella, rubella congenital, and tetanus, are in Table II to facilitate case count verification with reporting jurisdictions. † Case counts for reporting year 2015 and 2016 are provisional and subject to change. For further information on interpretation of these data, see http://wwwn.cdc.gov/nndss/document/ProvisionalNationaNotifiableDiseasesSurveillanceData20100927.pdfCdc-pdf. Data for TB are displayed in Table IV, which appears quarterly. § Includes data for dengue and dengue-like illness. Office of Management and Budget approval of the NNDSS Revision #0920-0728 on January 21, 2016, authorized CDC to receive data for these conditions. CDC is in the process of soliciting data for these conditions. |
|||||||||||||||
|
TABLE II. (Continued) Provisional cases of selected notifiable diseases (≥1,000 cases reported during the preceding year), and selected* low frequency diseases, United States and U.S. territories, weeks ending September 3, 2016, and September 5, 2015 (35th week)† (Export data) |
|||||||||||||||
|
Reporting area |
Ehrlichiosis/Anaplasmosis§ |
||||||||||||||
|
Ehrlichia chaffeensis |
Anaplasma phagocytophilum |
Undetermined |
|||||||||||||
|
Current week |
Previous 52 weeks |
Cum 2016 |
Cum 2015 |
Current week |
Previous 52 weeks |
Cum 2016 |
Cum 2015 |
Current week |
Previous 52 weeks |
Cum 2016 |
Cum 2015 |
||||
|
Med |
Max |
Med |
Max |
Med |
Max |
||||||||||
|
United States |
8 |
14 |
107 |
798 |
967 |
8 |
49 |
150 |
1,693 |
2,730 |
1 |
1 |
6 |
62 |
149 |
|
New England |
1 |
1 |
8 |
34 |
49 |
7 |
17 |
70 |
761 |
1,063 |
1 |
0 |
1 |
5 |
3 |
|
Connecticut |
— |
0 |
0 |
— |
— |
— |
0 |
4 |
9 |
106 |
— |
0 |
0 |
— |
— |
|
Maine |
1 |
0 |
1 |
3 |
4 |
7 |
2 |
31 |
256 |
116 |
1 |
0 |
1 |
4 |
1 |
|
Massachusetts |
— |
0 |
2 |
7 |
7 |
— |
7 |
46 |
303 |
601 |
— |
0 |
0 |
— |
— |
|
New Hampshire |
— |
0 |
1 |
4 |
10 |
— |
1 |
6 |
38 |
71 |
— |
0 |
0 |
— |
— |
|
Rhode Island |
— |
0 |
6 |
18 |
25 |
— |
0 |
13 |
41 |
74 |
— |
0 |
0 |
— |
— |
|
Vermont |
— |
0 |
1 |
2 |
3 |
— |
2 |
21 |
114 |
95 |
— |
0 |
1 |
1 |
2 |
|
Mid. Atlantic |
— |
2 |
37 |
120 |
111 |
— |
14 |
56 |
573 |
630 |
— |
0 |
3 |
13 |
18 |
|
New Jersey |
— |
0 |
7 |
45 |
54 |
— |
1 |
11 |
60 |
113 |
— |
0 |
1 |
4 |
5 |
|
New York (Upstate) |
— |
2 |
36 |
64 |
48 |
— |
12 |
53 |
475 |
449 |
— |
0 |
3 |
5 |
5 |
|
New York City |
— |
0 |
3 |
11 |
6 |
— |
1 |
6 |
37 |
48 |
— |
0 |
1 |
3 |
— |
|
Pennsylvania |
— |
0 |
1 |
— |
3 |
— |
0 |
2 |
1 |
20 |
— |
0 |
2 |
1 |
8 |
|
E.N. Central |
— |
1 |
6 |
42 |
66 |
— |
5 |
33 |
272 |
456 |
— |
0 |
5 |
18 |
69 |
|
Illinois |
— |
0 |
4 |
26 |
27 |
— |
0 |
2 |
6 |
9 |
— |
0 |
0 |
— |
1 |
|
Indiana |
— |
0 |
0 |
— |
— |
— |
0 |
0 |
— |
— |
— |
0 |
2 |
9 |
19 |
|
Michigan |
— |
0 |
1 |
1 |
3 |
— |
0 |
1 |
2 |
6 |
— |
0 |
0 |
— |
— |
|
Ohio |
— |
0 |
1 |
6 |
15 |
— |
0 |
2 |
4 |
1 |
— |
0 |
0 |
— |
1 |
|
Wisconsin |
— |
0 |
2 |
9 |
21 |
— |
5 |
33 |
260 |
440 |
— |
0 |
5 |
9 |
48 |
|
W.N. Central |
2 |
2 |
21 |
196 |
249 |
1 |
1 |
22 |
31 |
516 |
— |
0 |
2 |
9 |
29 |
|
Iowa |
— |
0 |
1 |
2 |
— |
— |
0 |
1 |
4 |
— |
— |
0 |
1 |
2 |
— |
|
Kansas |
— |
0 |
4 |
39 |
41 |
— |
0 |
1 |
4 |
5 |
— |
0 |
1 |
1 |
1 |
|
Minnesota |
— |
0 |
1 |
— |
3 |
— |
0 |
22 |
— |
495 |
— |
0 |
2 |
— |
19 |
|
Missouri |
1 |
1 |
17 |
150 |
201 |
1 |
0 |
2 |
9 |
13 |
— |
0 |
1 |
4 |
8 |
|
Nebraska |
1 |
0 |
1 |
5 |
3 |
— |
0 |
1 |
2 |
1 |
— |
0 |
0 |
— |
— |
|
North Dakota |
— |
0 |
0 |
— |
1 |
— |
0 |
3 |
12 |
2 |
— |
0 |
1 |
2 |
1 |
|
South Dakota |
— |
0 |
0 |
— |
— |
— |
0 |
0 |
— |
— |
— |
0 |
0 |
— |
— |
|
S. Atlantic |
— |
2 |
23 |
157 |
216 |
— |
1 |
6 |
35 |
23 |
— |
0 |
2 |
7 |
9 |
|
Delaware |
— |
0 |
3 |
11 |
10 |
— |
0 |
1 |
4 |
1 |
— |
0 |
1 |
1 |
— |
|
District of Columbia |
— |
0 |
0 |
— |
— |
— |
0 |
0 |
— |
— |
— |
0 |
0 |
— |
— |
|
Florida |
— |
0 |
6 |
18 |
13 |
— |
0 |
2 |
6 |
5 |
— |
0 |
1 |
— |
— |
|
Georgia |
— |
0 |
1 |
4 |
30 |
— |
0 |
1 |
1 |
— |
— |
0 |
1 |
1 |
1 |
|
Maryland |
— |
0 |
9 |
44 |
29 |
— |
0 |
2 |
8 |
1 |
— |
0 |
1 |
1 |
— |
|
North Carolina |
— |
0 |
22 |
27 |
41 |
— |
0 |
5 |
5 |
8 |
— |
0 |
0 |
— |
— |
|
South Carolina |
— |
0 |
0 |
— |
3 |
— |
0 |
0 |
— |
1 |
— |
0 |
0 |
— |
— |
|
Virginia |
— |
1 |
9 |
48 |
86 |
— |
0 |
3 |
11 |
7 |
— |
0 |
2 |
4 |
7 |
|
West Virginia |
— |
0 |
1 |
5 |
4 |
— |
0 |
0 |
— |
— |
— |
0 |
0 |
— |
1 |
|
E.S. Central |
3 |
1 |
9 |
96 |
113 |
— |
0 |
3 |
12 |
15 |
— |
0 |
1 |
6 |
16 |
|
Alabama |
— |
0 |
2 |
6 |
7 |
— |
0 |
1 |
5 |
7 |
— |
0 |
1 |
3 |
2 |
|
Kentucky |
— |
0 |
4 |
19 |
48 |
— |
0 |
0 |
— |
— |
— |
0 |
0 |
— |
— |
|
Mississippi |
— |
0 |
1 |
2 |
8 |
— |
0 |
0 |
— |
— |
— |
0 |
1 |
— |
3 |
|
Tennessee |
3 |
1 |
9 |
69 |
50 |
— |
0 |
2 |
7 |
8 |
— |
0 |
1 |
3 |
11 |
|
W.S. Central |
2 |
2 |
64 |
151 |
163 |
— |
0 |
5 |
9 |
18 |
— |
0 |
1 |
1 |
— |
|
Arkansas |
1 |
2 |
16 |
139 |
155 |
— |
0 |
5 |
8 |
15 |
— |
0 |
0 |
— |
— |
|
Louisiana |
— |
0 |
1 |
1 |
1 |
— |
0 |
0 |
— |
— |
— |
0 |
1 |
— |
— |
|
Oklahoma |
— |
0 |
60 |
1 |
2 |
— |
0 |
0 |
— |
— |
— |
0 |
0 |
— |
— |
|
Texas |
1 |
0 |
2 |
10 |
5 |
— |
0 |
1 |
1 |
3 |
— |
0 |
1 |
1 |
— |
|
Mountain |
— |
0 |
1 |
1 |
— |
— |
0 |
0 |
— |
3 |
— |
0 |
1 |
1 |
3 |
|
Arizona |
— |
0 |
0 |
— |
— |
— |
0 |
0 |
— |
— |
— |
0 |
1 |
1 |
3 |
|
Colorado |
N |
0 |
0 |
N |
N |
N |
0 |
0 |
N |
N |
N |
0 |
0 |
N |
N |
|
Idaho |
N |
0 |
0 |
N |
N |
N |
0 |
0 |
N |
N |
N |
0 |
0 |
N |
N |
|
Montana |
— |
0 |
1 |
1 |
— |
— |
0 |
0 |
— |
1 |
— |
0 |
0 |
— |
— |
|
Nevada |
— |
0 |
0 |
— |
— |
— |
0 |
0 |
— |
— |
— |
0 |
0 |
— |
— |
|
New Mexico |
N |
0 |
0 |
N |
N |
N |
0 |
0 |
N |
N |
N |
0 |
0 |
N |
N |
|
Utah |
— |
0 |
0 |
— |
— |
— |
0 |
0 |
— |
2 |
— |
0 |
0 |
— |
— |
|
Wyoming |
— |
0 |
0 |
— |
— |
— |
0 |
0 |
— |
— |
— |
0 |
0 |
— |
— |
|
Pacific |
— |
0 |
1 |
1 |
— |
— |
0 |
1 |
— |
6 |
— |
0 |
2 |
2 |
2 |
|
Alaska |
N |
0 |
0 |
N |
N |
N |
0 |
0 |
N |
N |
N |
0 |
0 |
N |
N |
|
California |
— |
0 |
0 |
— |
— |
— |
0 |
0 |
— |
3 |
— |
0 |
2 |
2 |
1 |
|
Hawaii |
N |
0 |
0 |
N |
N |
N |
0 |
0 |
N |
N |
N |
0 |
0 |
N |
N |
|
Oregon |
— |
0 |
1 |
1 |
— |
— |
0 |
0 |
— |
3 |
— |
0 |
0 |
— |
1 |
|
Washington |
— |
0 |
0 |
— |
— |
— |
0 |
1 |
— |
— |
— |
0 |
0 |
— |
— |
|
Territories |
|||||||||||||||
|
American Samoa |
N |
0 |
0 |
N |
N |
N |
0 |
0 |
N |
N |
N |
0 |
0 |
N |
N |
|
C.N.M.I. |
— |
— |
— |
— |
— |
— |
— |
— |
— |
— |
— |
— |
— |
— |
— |
|
Guam |
N |
0 |
0 |
N |
N |
N |
0 |
0 |
N |
N |
N |
0 |
0 |
N |
N |
|
Puerto Rico |
N |
0 |
0 |
N |
N |
N |
0 |
0 |
N |
N |
N |
0 |
0 |
N |
N |
|
U.S. Virgin Islands |
— |
0 |
0 |
— |
— |
— |
0 |
0 |
— |
— |
— |
0 |
0 |
— |
— |
|
C.N.M.I.: Commonwealth of Northern Mariana Islands. U: Unavailable. —: No reported cases. N: Not reportable. NN: Not Nationally Notifiable. NP: Nationally notifiable but not published. Cum: Cumulative year-to-date counts. Med: Median. Max: Maximum. * Three low incidence conditions, rubella, rubella congenital, and tetanus, are in Table II to facilitate case count verification with reporting jurisdictions. † Case counts for reporting year 2015 and 2016 are provisional and subject to change. For further information on interpretation of these data, see http://wwwn.cdc.gov/nndss/document/ProvisionalNationaNotifiableDiseasesSurveillanceData20100927.pdfCdc-pdf. Data for TB are displayed in Table IV, which appears quarterly. § Cumulative total E. ewingii cases reported for year 2016 = 13, and 14 cases reported for 2015. |
|||||||||||||||
|
TABLE II. (Continued) Provisional cases of selected notifiable diseases (≥1,000 cases reported during the preceding year), and selected* low frequency diseases, United States and U.S. territories, weeks ending September 3, 2016, and September 5, 2015 (35th week)† (Export data) |
|||||||||||||||
|
Reporting area |
Giardiasis |
Gonorrhea |
Haemophilus influenzae, invasive§ All ages, all serotypes |
||||||||||||
|
Current week |
Previous 52 weeks |
Cum 2016 |
Cum 2015 |
Current week |
Previous 52 weeks |
Cum 2016 |
Cum 2015 |
Current week |
Previous 52 weeks |
Cum 2016 |
Cum 2015 |
||||
|
Med |
Max |
Med |
Max |
Med |
Max |
||||||||||
|
United States |
146 |
253 |
870 |
8,385 |
8,757 |
4,546 |
7,940 |
9,325 |
270,806 |
254,071 |
20 |
83 |
189 |
2,908 |
2,695 |
|
New England |
15 |
20 |
42 |
683 |
749 |
75 |
159 |
213 |
5,419 |
4,519 |
1 |
5 |
12 |
181 |
179 |
|
Connecticut |
— |
4 |
9 |
134 |
153 |
7 |
44 |
99 |
1,464 |
1,304 |
— |
1 |
3 |
37 |
30 |
|
Maine |
4 |
2 |
10 |
74 |
62 |
1 |
9 |
20 |
262 |
185 |
— |
0 |
3 |
21 |
28 |
|
Massachusetts |
3 |
12 |
23 |
355 |
441 |
55 |
86 |
107 |
2,942 |
2,431 |
1 |
2 |
8 |
99 |
84 |
|
New Hampshire |
— |
2 |
6 |
69 |
74 |
12 |
7 |
53 |
359 |
138 |
— |
0 |
3 |
12 |
15 |
|
Rhode Island |
8 |
1 |
5 |
51 |
19 |
— |
10 |
24 |
310 |
375 |
— |
0 |
2 |
4 |
14 |
|
Vermont |
N |
0 |
0 |
N |
N |
— |
3 |
8 |
82 |
86 |
— |
0 |
2 |
8 |
8 |
|
Mid. Atlantic |
40 |
51 |
89 |
1,653 |
1,805 |
634 |
930 |
1,107 |
32,574 |
29,937 |
3 |
12 |
34 |
450 |
411 |
|
New Jersey |
— |
7 |
14 |
184 |
277 |
57 |
143 |
302 |
5,234 |
4,931 |
— |
2 |
9 |
74 |
85 |
|
New York (Upstate) |
— |
17 |
38 |
552 |
494 |
195 |
173 |
344 |
6,025 |
5,656 |
2 |
4 |
20 |
145 |
131 |
|
New York City |
24 |
16 |
25 |
558 |
592 |
152 |
343 |
404 |
11,807 |
11,038 |
1 |
2 |
7 |
75 |
65 |
|
Pennsylvania |
16 |
12 |
22 |
359 |
442 |
230 |
272 |
340 |
9,508 |
8,312 |
— |
5 |
11 |
156 |
130 |
|
E.N. Central |
18 |
27 |
61 |
888 |
979 |
266 |
1,129 |
1,429 |
37,156 |
36,497 |
3 |
14 |
32 |
489 |
474 |
|
Illinois |
N |
0 |
0 |
N |
N |
29 |
253 |
420 |
7,922 |
11,169 |
— |
4 |
9 |
129 |
131 |
|
Indiana |
— |
3 |
9 |
92 |
119 |
71 |
173 |
304 |
5,989 |
4,823 |
— |
2 |
8 |
60 |
70 |
|
Michigan |
4 |
8 |
20 |
274 |
290 |
81 |
219 |
293 |
7,554 |
6,711 |
— |
3 |
10 |
106 |
87 |
|
Ohio |
1 |
7 |
14 |
206 |
258 |
— |
357 |
434 |
11,567 |
10,681 |
3 |
3 |
8 |
121 |
110 |
|
Wisconsin |
13 |
9 |
36 |
316 |
312 |
85 |
122 |
162 |
4,124 |
3,113 |
— |
2 |
6 |
73 |
76 |
|
W.N. Central |
3 |
13 |
54 |
365 |
926 |
226 |
467 |
554 |
16,447 |
13,844 |
— |
4 |
16 |
94 |
217 |
|
Iowa |
1 |
4 |
15 |
134 |
124 |
10 |
47 |
67 |
1,620 |
1,420 |
— |
0 |
1 |
— |
1 |
|
Kansas |
— |
2 |
7 |
62 |
69 |
2 |
53 |
78 |
1,983 |
1,702 |
— |
1 |
5 |
39 |
27 |
|
Minnesota |
— |
0 |
22 |
— |
400 |
— |
85 |
123 |
2,979 |
2,744 |
— |
0 |
7 |
1 |
70 |
|
Missouri |
— |
0 |
12 |
6 |
153 |
196 |
208 |
275 |
7,386 |
5,791 |
— |
0 |
4 |
4 |
80 |
|
Nebraska |
2 |
2 |
9 |
83 |
90 |
18 |
39 |
63 |
1,357 |
1,056 |
— |
0 |
3 |
21 |
22 |
|
North Dakota |
— |
1 |
4 |
24 |
23 |
— |
15 |
29 |
539 |
451 |
— |
0 |
3 |
18 |
16 |
|
South Dakota |
— |
2 |
8 |
56 |
67 |
— |
21 |
39 |
583 |
680 |
— |
0 |
2 |
11 |
1 |
|
S. Atlantic |
31 |
49 |
78 |
1,688 |
1,589 |
878 |
1,639 |
2,385 |
56,335 |
56,571 |
6 |
20 |
89 |
765 |
615 |
|
Delaware |
— |
0 |
3 |
8 |
18 |
31 |
30 |
45 |
1,022 |
763 |
— |
0 |
2 |
12 |
12 |
|
District of Columbia |
N |
0 |
0 |
N |
N |
41 |
56 |
136 |
2,177 |
1,951 |
— |
0 |
3 |
12 |
6 |
|
Florida |
24 |
23 |
53 |
805 |
675 |
213 |
512 |
727 |
17,339 |
15,486 |
2 |
5 |
65 |
242 |
117 |
|
Georgia |
— |
12 |
34 |
432 |
485 |
127 |
285 |
364 |
9,038 |
10,542 |
2 |
4 |
8 |
132 |
132 |
|
Maryland |
4 |
4 |
13 |
149 |
147 |
108 |
161 |
252 |
5,313 |
3,937 |
— |
2 |
6 |
79 |
56 |
|
North Carolina |
N |
0 |
0 |
N |
N |
19 |
325 |
822 |
7,558 |
12,388 |
— |
3 |
8 |
119 |
118 |
|
South Carolina |
— |
2 |
9 |
63 |
72 |
140 |
178 |
264 |
5,980 |
5,291 |
— |
2 |
5 |
62 |
71 |
|
Virginia |
3 |
6 |
26 |
187 |
150 |
186 |
146 |
776 |
7,355 |
5,696 |
2 |
2 |
16 |
85 |
69 |
|
West Virginia |
— |
1 |
6 |
44 |
42 |
13 |
16 |
29 |
553 |
517 |
— |
0 |
3 |
22 |
34 |
|
E.S. Central |
— |
4 |
13 |
173 |
122 |
231 |
544 |
723 |
16,947 |
16,173 |
1 |
6 |
19 |
229 |
207 |
|
Alabama |
— |
4 |
13 |
173 |
122 |
— |
152 |
236 |
4,663 |
4,948 |
— |
1 |
5 |
52 |
59 |
|
Kentucky |
N |
0 |
0 |
N |
N |
150 |
98 |
405 |
3,090 |
2,365 |
1 |
1 |
4 |
38 |
29 |
|
Mississippi |
N |
0 |
0 |
N |
N |
— |
125 |
239 |
3,706 |
3,243 |
— |
1 |
5 |
36 |
30 |
|
Tennessee |
N |
0 |
0 |
N |
N |
81 |
168 |
240 |
5,488 |
5,617 |
— |
3 |
11 |
103 |
89 |
|
W.S. Central |
3 |
6 |
20 |
191 |
202 |
1,323 |
1,214 |
1,917 |
41,603 |
39,011 |
4 |
7 |
21 |
320 |
164 |
|
Arkansas |
3 |
3 |
12 |
100 |
66 |
131 |
108 |
222 |
3,287 |
2,462 |
— |
1 |
5 |
32 |
32 |
|
Louisiana |
— |
3 |
12 |
91 |
136 |
328 |
184 |
1,077 |
6,722 |
6,128 |
— |
1 |
5 |
42 |
46 |
|
Oklahoma |
N |
0 |
0 |
N |
N |
14 |
106 |
171 |
3,314 |
4,234 |
— |
1 |
15 |
51 |
79 |
|
Texas |
N |
0 |
0 |
N |
N |
850 |
818 |
1,422 |
28,280 |
26,187 |
4 |
4 |
12 |
195 |
7 |
|
Mountain |
8 |
15 |
35 |
446 |
729 |
157 |
465 |
622 |
15,957 |
13,784 |
1 |
7 |
17 |
233 |
281 |
|
Arizona |
1 |
3 |
7 |
92 |
98 |
113 |
177 |
258 |
6,018 |
5,213 |
— |
2 |
11 |
85 |
102 |
|
Colorado |
— |
0 |
14 |
— |
228 |
— |
102 |
253 |
3,538 |
2,727 |
1 |
1 |
6 |
50 |
66 |
|
Idaho |
4 |
3 |
13 |
125 |
105 |
1 |
12 |
36 |
401 |
268 |
— |
0 |
3 |
22 |
15 |
|
Montana |
2 |
2 |
8 |
70 |
59 |
10 |
18 |
30 |
599 |
538 |
— |
0 |
2 |
12 |
8 |
|
Nevada |
— |
0 |
4 |
14 |
34 |
— |
59 |
96 |
1,904 |
2,371 |
— |
0 |
3 |
6 |
20 |
|
New Mexico |
— |
1 |
4 |
37 |
54 |
3 |
55 |
97 |
1,983 |
1,602 |
— |
1 |
4 |
37 |
41 |
|
Utah |
1 |
3 |
7 |
88 |
130 |
30 |
37 |
58 |
1,375 |
953 |
— |
1 |
4 |
20 |
27 |
|
Wyoming |
— |
0 |
4 |
20 |
21 |
— |
3 |
15 |
139 |
112 |
— |
0 |
2 |
1 |
2 |
|
Pacific |
28 |
64 |
647 |
2,298 |
1,656 |
756 |
1,402 |
1,579 |
48,368 |
43,735 |
1 |
4 |
12 |
147 |
147 |
|
Alaska |
5 |
1 |
6 |
45 |
58 |
— |
21 |
34 |
647 |
732 |
— |
0 |
3 |
14 |
18 |
|
California |
13 |
48 |
72 |
1,654 |
1,342 |
548 |
1,153 |
1,324 |
40,378 |
35,561 |
— |
1 |
4 |
42 |
50 |
|
Hawaii |
— |
0 |
4 |
23 |
22 |
— |
23 |
46 |
775 |
843 |
— |
0 |
6 |
26 |
7 |
|
Oregon |
5 |
6 |
14 |
209 |
234 |
89 |
73 |
102 |
2,635 |
1,960 |
1 |
1 |
4 |
59 |
72 |
|
Washington |
5 |
5 |
601 |
367 |
— |
119 |
125 |
211 |
3,933 |
4,639 |
— |
0 |
5 |
6 |
— |
|
Territories |
|||||||||||||||
|
American Samoa |
— |
0 |
0 |
— |
— |
— |
0 |
0 |
— |
— |
— |
0 |
0 |
— |
— |
|
C.N.M.I. |
— |
— |
— |
— |
— |
— |
— |
— |
— |
— |
— |
— |
— |
— |
— |
|
Guam |
— |
0 |
0 |
— |
1 |
— |
0 |
0 |
— |
— |
— |
0 |
0 |
— |
— |
|
Puerto Rico |
— |
0 |
1 |
7 |
17 |
3 |
12 |
40 |
393 |
341 |
— |
0 |
1 |
4 |
— |
|
U.S. Virgin Islands |
— |
0 |
0 |
— |
— |
— |
0 |
4 |
15 |
41 |
N |
0 |
0 |
N |
N |
|
C.N.M.I.: Commonwealth of Northern Mariana Islands. U: Unavailable. —: No reported cases. N: Not reportable. NN: Not Nationally Notifiable. NP: Nationally notifiable but not published. Cum: Cumulative year-to-date counts. Med: Median. Max: Maximum. * Three low incidence conditions, rubella, rubella congenital, and tetanus, are in Table II to facilitate case count verification with reporting jurisdictions. † Case counts for reporting year 2015 and 2016 are provisional and subject to change. For further information on interpretation of these data, see http://wwwn.cdc.gov/nndss/document/ProvisionalNationaNotifiableDiseasesSurveillanceData20100927.pdfCdc-pdf. Data for TB are displayed in Table IV, which appears quarterly. § Data for H. influenzae (age <5 for serotype b, non typable serotype, other serotype, and unknown serotype) are available in Table I. |
|||||||||||||||
|
TABLE II. (Continued) Provisional cases of selected notifiable diseases (≥1,000 cases reported during the preceding year), and selected* low frequency diseases, United States and U.S. territories, weeks ending September 3, 2016, and September 5, 2015 (35th week)† (Export data) |
|||||||||||||||
|
Reporting area |
Hepatitis (viral, acute), by type |
||||||||||||||
|
A |
B |
C |
|||||||||||||
|
Current week |
Previous 52 weeks |
Cum 2016 |
Cum 2015 |
Current week |
Previous 52 weeks |
Cum 2016 |
Cum 2015 |
Current week |
Previous 52 weeks |
Cum 2016 |
Cum 2015 |
||||
|
Med |
Max |
Med |
Max |
Med |
Max |
||||||||||
|
United States |
52 |
27 |
72 |
1,142 |
910 |
21 |
53 |
128 |
1,662 |
2,236 |
18 |
44 |
140 |
1,353 |
1,577 |
|
New England |
1 |
1 |
4 |
55 |
42 |
— |
1 |
4 |
46 |
27 |
1 |
5 |
11 |
153 |
209 |
|
Connecticut |
— |
0 |
2 |
6 |
7 |
— |
0 |
1 |
2 |
5 |
— |
0 |
2 |
13 |
11 |
|
Maine |
— |
0 |
1 |
4 |
4 |
— |
1 |
3 |
28 |
1 |
— |
0 |
2 |
13 |
21 |
|
Massachusetts |
1 |
1 |
4 |
36 |
25 |
— |
0 |
3 |
14 |
19 |
1 |
4 |
9 |
122 |
177 |
|
New Hampshire |
— |
0 |
1 |
3 |
— |
— |
0 |
0 |
— |
— |
N |
0 |
0 |
N |
N |
|
Rhode Island |
— |
0 |
2 |
3 |
4 |
U |
0 |
0 |
U |
U |
U |
0 |
0 |
U |
U |
|
Vermont |
— |
0 |
1 |
3 |
2 |
— |
0 |
1 |
2 |
2 |
— |
0 |
1 |
5 |
— |
|
Mid. Atlantic |
6 |
4 |
11 |
145 |
156 |
3 |
4 |
8 |
119 |
156 |
7 |
7 |
13 |
230 |
262 |
|
New Jersey |
— |
1 |
3 |
44 |
42 |
— |
1 |
4 |
19 |
65 |
— |
1 |
4 |
26 |
94 |
|
New York (Upstate) |
3 |
1 |
6 |
36 |
26 |
1 |
1 |
4 |
26 |
23 |
6 |
3 |
8 |
113 |
67 |
|
New York City |
1 |
1 |
3 |
30 |
57 |
2 |
1 |
3 |
44 |
32 |
— |
0 |
1 |
4 |
6 |
|
Pennsylvania |
2 |
1 |
4 |
35 |
31 |
— |
1 |
4 |
30 |
36 |
1 |
2 |
8 |
87 |
95 |
|
E.N. Central |
1 |
3 |
8 |
96 |
117 |
1 |
9 |
17 |
313 |
474 |
2 |
8 |
18 |
283 |
292 |
|
Illinois |
— |
1 |
5 |
34 |
42 |
— |
0 |
2 |
22 |
46 |
— |
0 |
3 |
18 |
18 |
|
Indiana |
— |
0 |
3 |
11 |
11 |
— |
1 |
5 |
51 |
101 |
— |
2 |
7 |
59 |
86 |
|
Michigan |
— |
1 |
3 |
30 |
31 |
— |
1 |
4 |
34 |
35 |
1 |
2 |
5 |
72 |
57 |
|
Ohio |
1 |
0 |
3 |
20 |
25 |
1 |
6 |
12 |
200 |
288 |
1 |
3 |
10 |
108 |
82 |
|
Wisconsin |
— |
0 |
1 |
1 |
8 |
— |
0 |
1 |
6 |
4 |
— |
1 |
3 |
26 |
49 |
|
W.N. Central |
1 |
1 |
3 |
27 |
48 |
— |
1 |
5 |
31 |
61 |
— |
1 |
4 |
32 |
45 |
|
Iowa |
— |
0 |
2 |
8 |
10 |
— |
0 |
2 |
7 |
13 |
— |
0 |
0 |
— |
— |
|
Kansas |
— |
0 |
1 |
3 |
4 |
— |
0 |
2 |
12 |
7 |
— |
0 |
2 |
7 |
16 |
|
Minnesota |
— |
0 |
1 |
1 |
18 |
— |
0 |
2 |
4 |
12 |
— |
0 |
3 |
11 |
20 |
|
Missouri |
— |
0 |
2 |
— |
6 |
— |
0 |
3 |
— |
27 |
— |
0 |
1 |
— |
5 |
|
Nebraska |
1 |
0 |
2 |
13 |
5 |
— |
0 |
2 |
5 |
— |
— |
0 |
1 |
3 |
4 |
|
North Dakota |
— |
0 |
1 |
2 |
3 |
— |
0 |
1 |
1 |
— |
— |
0 |
1 |
1 |
— |
|
South Dakota |
— |
0 |
1 |
— |
2 |
— |
0 |
1 |
2 |
2 |
— |
0 |
2 |
10 |
— |
|
S. Atlantic |
36 |
7 |
33 |
306 |
171 |
12 |
20 |
34 |
664 |
758 |
2 |
10 |
20 |
341 |
338 |
|
Delaware |
— |
0 |
1 |
1 |
2 |
— |
0 |
1 |
1 |
8 |
U |
0 |
0 |
U |
U |
|
District of Columbia |
U |
0 |
0 |
U |
U |
U |
0 |
0 |
U |
U |
U |
0 |
0 |
U |
U |
|
Florida |
1 |
2 |
7 |
77 |
70 |
11 |
10 |
17 |
331 |
282 |
1 |
4 |
11 |
163 |
69 |
|
Georgia |
2 |
1 |
3 |
44 |
21 |
1 |
2 |
6 |
60 |
84 |
— |
1 |
4 |
29 |
61 |
|
Maryland |
3 |
0 |
3 |
19 |
12 |
— |
0 |
4 |
19 |
28 |
— |
1 |
4 |
26 |
25 |
|
North Carolina |
— |
1 |
4 |
32 |
31 |
— |
2 |
9 |
55 |
120 |
— |
2 |
7 |
49 |
100 |
|
South Carolina |
1 |
0 |
3 |
10 |
7 |
— |
0 |
2 |
20 |
18 |
— |
0 |
2 |
7 |
2 |
|
Virginia |
29 |
2 |
24 |
120 |
23 |
— |
1 |
11 |
31 |
40 |
1 |
1 |
4 |
28 |
32 |
|
West Virginia |
— |
0 |
1 |
3 |
5 |
— |
5 |
12 |
147 |
178 |
— |
1 |
4 |
39 |
49 |
|
E.S. Central |
— |
1 |
4 |
22 |
37 |
2 |
8 |
21 |
231 |
379 |
— |
5 |
10 |
139 |
249 |
|
Alabama |
— |
0 |
2 |
13 |
15 |
— |
1 |
5 |
40 |
74 |
— |
1 |
4 |
24 |
52 |
|
Kentucky |
— |
0 |
2 |
4 |
12 |
— |
2 |
9 |
52 |
107 |
— |
1 |
5 |
32 |
79 |
|
Mississippi |
— |
0 |
1 |
2 |
— |
— |
0 |
3 |
14 |
34 |
U |
0 |
0 |
U |
U |
|
Tennessee |
— |
0 |
2 |
3 |
10 |
2 |
4 |
8 |
125 |
164 |
— |
3 |
8 |
83 |
118 |
|
W.S. Central |
4 |
3 |
13 |
111 |
109 |
2 |
5 |
25 |
135 |
186 |
3 |
1 |
27 |
46 |
54 |
|
Arkansas |
— |
0 |
3 |
9 |
6 |
— |
1 |
4 |
32 |
19 |
— |
0 |
1 |
— |
1 |
|
Louisiana |
— |
0 |
1 |
9 |
3 |
— |
1 |
7 |
27 |
58 |
— |
0 |
2 |
5 |
20 |
|
Oklahoma |
— |
0 |
3 |
5 |
6 |
— |
0 |
10 |
5 |
17 |
1 |
0 |
25 |
15 |
5 |
|
Texas |
4 |
3 |
11 |
88 |
94 |
2 |
3 |
12 |
71 |
92 |
2 |
0 |
4 |
26 |
28 |
|
Mountain |
1 |
1 |
6 |
48 |
83 |
— |
1 |
8 |
17 |
64 |
2 |
2 |
9 |
57 |
84 |
|
Arizona |
— |
1 |
4 |
22 |
31 |
— |
0 |
3 |
8 |
12 |
U |
0 |
0 |
U |
U |
|
Colorado |
— |
0 |
2 |
11 |
21 |
— |
0 |
4 |
— |
16 |
2 |
0 |
3 |
7 |
28 |
|
Idaho |
— |
0 |
1 |
3 |
7 |
— |
0 |
1 |
6 |
7 |
— |
0 |
1 |
3 |
2 |
|
Montana |
1 |
0 |
1 |
2 |
1 |
— |
0 |
1 |
1 |
2 |
— |
0 |
2 |
13 |
10 |
|
Nevada |
— |
0 |
1 |
2 |
8 |
— |
0 |
2 |
1 |
17 |
— |
0 |
1 |
1 |
9 |
|
New Mexico |
— |
0 |
1 |
1 |
6 |
— |
0 |
0 |
— |
2 |
— |
0 |
4 |
7 |
18 |
|
Utah |
— |
0 |
1 |
7 |
6 |
— |
0 |
1 |
1 |
8 |
— |
1 |
4 |
26 |
17 |
|
Wyoming |
— |
0 |
0 |
— |
3 |
U |
0 |
0 |
U |
U |
U |
0 |
0 |
U |
U |
|
Pacific |
2 |
5 |
34 |
332 |
147 |
1 |
3 |
37 |
106 |
131 |
1 |
2 |
64 |
72 |
44 |
|
Alaska |
— |
0 |
1 |
1 |
4 |
— |
0 |
1 |
3 |
1 |
N |
0 |
0 |
N |
N |
|
California |
1 |
3 |
10 |
123 |
119 |
— |
2 |
8 |
68 |
107 |
— |
1 |
3 |
24 |
37 |
|
Hawaii |
— |
0 |
32 |
187 |
5 |
— |
0 |
1 |
1 |
9 |
— |
0 |
0 |
— |
— |
|
Oregon |
— |
0 |
3 |
8 |
19 |
— |
0 |
2 |
9 |
14 |
— |
0 |
1 |
9 |
7 |
|
Washington |
1 |
0 |
26 |
13 |
— |
1 |
0 |
34 |
25 |
— |
1 |
0 |
63 |
39 |
— |
|
Territories |
|||||||||||||||
|
American Samoa |
— |
0 |
0 |
— |
— |
— |
0 |
0 |
— |
— |
— |
0 |
0 |
— |
— |
|
C.N.M.I. |
— |
— |
— |
— |
— |
— |
— |
— |
— |
— |
— |
— |
— |
— |
— |
|
Guam |
— |
0 |
2 |
— |
44 |
— |
0 |
0 |
— |
— |
— |
0 |
0 |
— |
— |
|
Puerto Rico |
— |
0 |
1 |
2 |
2 |
— |
0 |
2 |
9 |
21 |
N |
0 |
0 |
N |
N |
|
U.S. Virgin Islands |
— |
0 |
0 |
— |
— |
— |
0 |
0 |
— |
— |
— |
0 |
0 |
— |
— |
|
C.N.M.I.: Commonwealth of Northern Mariana Islands. U: Unavailable. —: No reported cases. N: Not reportable. NN: Not Nationally Notifiable. NP: Nationally notifiable but not published. Cum: Cumulative year-to-date counts. Med: Median. Max: Maximum. * Three low incidence conditions, rubella, rubella congenital, and tetanus, are in Table II to facilitate case count verification with reporting jurisdictions. † Case counts for reporting year 2015 and 2016 are provisional and subject to change. For further information on interpretation of these data, see http://wwwn.cdc.gov/nndss/document/ProvisionalNationaNotifiableDiseasesSurveillanceData20100927.pdfCdc-pdf. Data for TB are displayed in Table IV, which appears quarterly. |
|||||||||||||||
|
TABLE II. (Continued) Provisional cases of selected notifiable diseases (≥1,000 cases reported during the preceding year), and selected* low frequency diseases, United States and U.S. territories, weeks ending September 3, 2016, and September 5, 2015 (35th week)† (Export data) |
|||||||||||||||
|
Reporting area |
Invasive Pneumococcal Disease§ |
Legionellosis |
|||||||||||||
|
All ages |
Age <5 |
||||||||||||||
|
Current week |
Previous 52 weeks |
Cum 2016 |
Cum 2015 |
Current week |
Previous 52 weeks |
Cum 2016 |
Cum 2015 |
Current week |
Previous 52 weeks |
Cum 2016 |
Cum 2015 |
||||
|
Med |
Max |
Med |
Max |
Med |
Max |
||||||||||
|
United States |
69 |
295 |
727 |
10,108 |
10,777 |
5 |
23 |
36 |
641 |
729 |
78 |
83 |
182 |
2,596 |
4,056 |
|
New England |
6 |
20 |
42 |
726 |
738 |
— |
1 |
4 |
41 |
33 |
2 |
4 |
13 |
110 |
191 |
|
Connecticut |
— |
4 |
9 |
134 |
166 |
— |
0 |
1 |
7 |
4 |
— |
1 |
3 |
18 |
38 |
|
Maine |
— |
2 |
9 |
88 |
98 |
— |
0 |
2 |
6 |
3 |
— |
0 |
2 |
10 |
9 |
|
Massachusetts |
4 |
10 |
20 |
347 |
328 |
— |
0 |
3 |
23 |
17 |
2 |
2 |
7 |
58 |
100 |
|
New Hampshire |
— |
2 |
6 |
62 |
61 |
— |
0 |
2 |
1 |
5 |
— |
0 |
3 |
10 |
21 |
|
Rhode Island |
— |
0 |
7 |
39 |
45 |
— |
0 |
1 |
2 |
1 |
— |
0 |
6 |
10 |
9 |
|
Vermont |
2 |
1 |
10 |
56 |
40 |
— |
0 |
2 |
2 |
3 |
— |
0 |
3 |
4 |
14 |
|
Mid. Atlantic |
9 |
45 |
129 |
1,396 |
1,689 |
— |
2 |
8 |
70 |
74 |
17 |
17 |
56 |
535 |
993 |
|
New Jersey |
— |
0 |
20 |
3 |
370 |
— |
0 |
4 |
— |
13 |
— |
0 |
11 |
8 |
146 |
|
New York (Upstate) |
— |
17 |
71 |
595 |
535 |
— |
1 |
4 |
35 |
23 |
— |
5 |
16 |
177 |
290 |
|
New York City |
5 |
13 |
23 |
430 |
461 |
— |
1 |
3 |
17 |
22 |
11 |
4 |
27 |
151 |
320 |
|
Pennsylvania |
4 |
9 |
24 |
368 |
323 |
— |
0 |
3 |
18 |
16 |
6 |
6 |
23 |
199 |
237 |
|
E.N. Central |
9 |
58 |
127 |
1,925 |
1,876 |
— |
3 |
8 |
96 |
107 |
33 |
18 |
64 |
536 |
992 |
|
Illinois |
N |
0 |
0 |
N |
N |
— |
0 |
0 |
— |
3 |
— |
4 |
28 |
131 |
208 |
|
Indiana |
— |
11 |
30 |
359 |
398 |
— |
0 |
3 |
8 |
23 |
1 |
2 |
11 |
65 |
123 |
|
Michigan |
2 |
16 |
46 |
581 |
523 |
— |
0 |
4 |
27 |
31 |
— |
2 |
13 |
57 |
176 |
|
Ohio |
5 |
20 |
41 |
706 |
672 |
— |
1 |
5 |
46 |
30 |
32 |
6 |
23 |
272 |
425 |
|
Wisconsin |
2 |
7 |
25 |
279 |
283 |
— |
0 |
2 |
15 |
20 |
— |
0 |
7 |
11 |
60 |
|
W.N. Central |
3 |
14 |
29 |
406 |
682 |
— |
1 |
4 |
23 |
57 |
— |
4 |
16 |
192 |
216 |
|
Iowa |
N |
0 |
0 |
N |
N |
N |
0 |
0 |
N |
N |
— |
0 |
3 |
19 |
27 |
|
Kansas |
— |
4 |
9 |
135 |
116 |
— |
0 |
2 |
8 |
12 |
— |
0 |
4 |
13 |
22 |
|
Minnesota |
— |
0 |
19 |
— |
344 |
— |
0 |
2 |
— |
24 |
— |
1 |
7 |
46 |
32 |
|
Missouri |
— |
0 |
1 |
1 |
— |
— |
0 |
2 |
— |
10 |
— |
2 |
12 |
97 |
116 |
|
Nebraska |
3 |
3 |
8 |
133 |
93 |
— |
0 |
2 |
13 |
6 |
— |
0 |
2 |
9 |
12 |
|
North Dakota |
— |
1 |
5 |
48 |
57 |
— |
0 |
1 |
2 |
5 |
— |
0 |
1 |
3 |
2 |
|
South Dakota |
— |
2 |
9 |
89 |
72 |
N |
0 |
0 |
N |
N |
— |
0 |
2 |
5 |
5 |
|
S. Atlantic |
11 |
52 |
119 |
1,876 |
1,799 |
3 |
4 |
11 |
139 |
149 |
13 |
18 |
32 |
547 |
648 |
|
Delaware |
— |
1 |
5 |
40 |
53 |
— |
0 |
1 |
— |
3 |
1 |
0 |
2 |
11 |
17 |
|
District of Columbia |
N |
0 |
0 |
N |
N |
— |
0 |
1 |
— |
4 |
N |
0 |
0 |
N |
N |
|
Florida |
1 |
10 |
59 |
462 |
285 |
1 |
1 |
5 |
43 |
40 |
8 |
5 |
11 |
180 |
198 |
|
Georgia |
6 |
17 |
37 |
629 |
682 |
1 |
1 |
5 |
43 |
47 |
1 |
2 |
7 |
67 |
74 |
|
Maryland |
3 |
8 |
21 |
313 |
292 |
1 |
0 |
3 |
21 |
16 |
3 |
2 |
9 |
84 |
109 |
|
North Carolina |
N |
0 |
0 |
N |
N |
N |
0 |
0 |
N |
N |
— |
3 |
9 |
103 |
103 |
|
South Carolina |
1 |
6 |
18 |
237 |
312 |
— |
0 |
2 |
8 |
14 |
— |
1 |
3 |
17 |
40 |
|
Virginia |
— |
0 |
2 |
17 |
16 |
— |
0 |
2 |
17 |
16 |
— |
3 |
7 |
77 |
86 |
|
West Virginia |
— |
4 |
17 |
178 |
159 |
— |
0 |
2 |
7 |
9 |
— |
0 |
3 |
8 |
21 |
|
E.S. Central |
10 |
32 |
71 |
1,075 |
1,101 |
— |
2 |
6 |
57 |
75 |
2 |
4 |
10 |
166 |
229 |
|
Alabama |
— |
6 |
18 |
216 |
184 |
— |
0 |
5 |
18 |
19 |
— |
1 |
3 |
31 |
45 |
|
Kentucky |
— |
4 |
11 |
163 |
152 |
— |
0 |
2 |
4 |
3 |
— |
1 |
4 |
39 |
61 |
|
Mississippi |
2 |
5 |
13 |
151 |
145 |
— |
0 |
2 |
12 |
17 |
— |
0 |
3 |
13 |
30 |
|
Tennessee |
8 |
15 |
35 |
545 |
620 |
— |
1 |
3 |
23 |
36 |
2 |
2 |
7 |
83 |
93 |
|
W.S. Central |
8 |
40 |
244 |
1,521 |
1,462 |
1 |
4 |
16 |
133 |
135 |
7 |
6 |
32 |
176 |
256 |
|
Arkansas |
2 |
5 |
24 |
173 |
205 |
— |
0 |
3 |
14 |
16 |
1 |
0 |
6 |
28 |
26 |
|
Louisiana |
— |
6 |
16 |
226 |
238 |
— |
0 |
3 |
21 |
15 |
— |
0 |
3 |
7 |
29 |
|
Oklahoma |
N |
0 |
0 |
N |
N |
1 |
0 |
2 |
9 |
10 |
— |
0 |
10 |
3 |
25 |
|
Texas |
6 |
28 |
217 |
1,122 |
1,019 |
— |
3 |
14 |
89 |
94 |
6 |
4 |
21 |
138 |
176 |
|
Mountain |
8 |
28 |
65 |
1,046 |
1,314 |
1 |
2 |
6 |
76 |
91 |
2 |
3 |
10 |
90 |
163 |
|
Arizona |
7 |
10 |
37 |
544 |
470 |
1 |
1 |
4 |
37 |
31 |
1 |
1 |
4 |
48 |
65 |
|
Colorado |
— |
0 |
21 |
— |
331 |
— |
0 |
2 |
— |
19 |
— |
0 |
7 |
3 |
33 |
|
Idaho |
N |
0 |
0 |
N |
N |
— |
0 |
1 |
7 |
7 |
— |
0 |
1 |
9 |
8 |
|
Montana |
— |
1 |
6 |
67 |
43 |
— |
0 |
1 |
2 |
— |
— |
0 |
2 |
7 |
4 |
|
Nevada |
— |
2 |
10 |
57 |
116 |
— |
0 |
1 |
4 |
9 |
— |
0 |
2 |
3 |
17 |
|
New Mexico |
1 |
5 |
15 |
217 |
211 |
— |
0 |
2 |
10 |
13 |
1 |
0 |
2 |
7 |
8 |
|
Utah |
— |
4 |
9 |
138 |
127 |
— |
0 |
3 |
15 |
11 |
— |
0 |
2 |
11 |
24 |
|
Wyoming |
— |
0 |
3 |
23 |
16 |
— |
0 |
1 |
1 |
1 |
— |
0 |
1 |
2 |
4 |
|
Pacific |
5 |
3 |
12 |
137 |
116 |
— |
0 |
1 |
6 |
8 |
2 |
7 |
70 |
244 |
368 |
|
Alaska |
5 |
2 |
10 |
84 |
70 |
— |
0 |
1 |
6 |
6 |
— |
0 |
1 |
1 |
— |
|
California |
N |
0 |
0 |
N |
N |
N |
0 |
0 |
N |
N |
2 |
6 |
16 |
195 |
330 |
|
Hawaii |
— |
1 |
6 |
53 |
46 |
— |
0 |
1 |
— |
2 |
— |
0 |
1 |
3 |
6 |
|
Oregon |
N |
0 |
0 |
N |
N |
N |
0 |
0 |
N |
N |
— |
1 |
3 |
20 |
32 |
|
Washington |
N |
0 |
0 |
N |
N |
N |
0 |
0 |
N |
N |
— |
0 |
56 |
25 |
— |
|
Territories |
|||||||||||||||
|
American Samoa |
N |
0 |
0 |
N |
N |
— |
0 |
0 |
— |
— |
N |
0 |
0 |
N |
N |
|
C.N.M.I. |
— |
— |
— |
— |
— |
— |
— |
— |
— |
— |
— |
— |
— |
— |
— |
|
Guam |
— |
0 |
0 |
— |
— |
— |
0 |
0 |
— |
— |
— |
0 |
0 |
— |
— |
|
Puerto Rico |
— |
0 |
0 |
— |
— |
— |
0 |
0 |
— |
— |
— |
0 |
1 |
5 |
12 |
|
U.S. Virgin Islands |
— |
0 |
0 |
— |
— |
— |
0 |
0 |
— |
— |
— |
0 |
0 |
— |
— |
|
C.N.M.I.: Commonwealth of Northern Mariana Islands. U: Unavailable. —: No reported cases. N: Not reportable. NN: Not Nationally Notifiable. NP: Nationally notifiable but not published. Cum: Cumulative year-to-date counts. Med: Median. Max: Maximum. * Three low incidence conditions, rubella, rubella congenital, and tetanus, are in Table II to facilitate case count verification with reporting jurisdictions. † Case counts for reporting year 2015 and 2016 are provisional and subject to change. For further information on interpretation of these data, see http://wwwn.cdc.gov/nndss/document/ProvisionalNationaNotifiableDiseasesSurveillanceData20100927.pdfCdc-pdf. Data for TB are displayed in Table IV, which appears quarterly. § Includes drug resistant and susceptible cases of Invasive Pneumococcal Disease. This condition was previously named Streptococcus pneumoniae invasive disease and cases were reported to CDC using different event codes to specify whether the cases were drug resistant or in a defined age group, such as <5 years. |
|||||||||||||||
|
TABLE II. (Continued) Provisional cases of selected notifiable diseases (≥1,000 cases reported during the preceding year), and selected* low frequency diseases, United States and U.S. territories, weeks ending September 3, 2016, and September 5, 2015 (35th week)† (Export data) |
|||||||||||||||
|
Reporting area |
Lyme disease |
Malaria |
Meningococcal disease, invasive§ All serogroups |
||||||||||||
|
Current week |
Previous 52 weeks |
Cum 2016 |
Cum 2015 |
Current week |
Previous 52 weeks |
Cum 2016 |
Cum 2015 |
Current week |
Previous 52 weeks |
Cum 2016 |
Cum 2015 |
||||
|
Med |
Max |
Med |
Max |
Med |
Max |
||||||||||
|
United States |
232 |
481 |
1,526 |
20,654 |
29,189 |
27 |
30 |
54 |
973 |
872 |
4 |
6 |
20 |
250 |
255 |
|
New England |
— |
72 |
263 |
2,558 |
8,261 |
1 |
2 |
5 |
72 |
60 |
— |
0 |
2 |
9 |
19 |
|
Connecticut |
— |
24 |
65 |
688 |
2,068 |
— |
0 |
1 |
1 |
8 |
— |
0 |
1 |
1 |
4 |
|
Maine |
— |
14 |
75 |
679 |
891 |
— |
0 |
1 |
8 |
5 |
— |
0 |
1 |
1 |
4 |
|
Massachusetts |
— |
5 |
81 |
125 |
3,685 |
— |
1 |
4 |
48 |
34 |
— |
0 |
2 |
7 |
7 |
|
New Hampshire |
— |
6 |
38 |
467 |
524 |
— |
0 |
2 |
7 |
5 |
— |
0 |
1 |
— |
— |
|
Rhode Island |
— |
12 |
77 |
453 |
607 |
1 |
0 |
3 |
4 |
8 |
— |
0 |
1 |
— |
3 |
|
Vermont |
— |
4 |
55 |
146 |
486 |
— |
0 |
2 |
4 |
— |
— |
0 |
0 |
— |
1 |
|
Mid. Atlantic |
182 |
268 |
1,024 |
13,260 |
13,655 |
13 |
7 |
16 |
239 |
229 |
1 |
0 |
4 |
27 |
22 |
|
New Jersey |
— |
50 |
162 |
2,053 |
3,872 |
— |
1 |
4 |
38 |
55 |
— |
0 |
2 |
6 |
4 |
|
New York (Upstate) |
109 |
44 |
237 |
2,171 |
2,252 |
— |
1 |
8 |
41 |
28 |
1 |
0 |
1 |
7 |
6 |
|
New York City |
5 |
4 |
563 |
690 |
672 |
12 |
3 |
12 |
128 |
118 |
— |
0 |
2 |
8 |
6 |
|
Pennsylvania |
68 |
131 |
762 |
8,346 |
6,859 |
1 |
1 |
4 |
32 |
28 |
— |
0 |
2 |
6 |
6 |
|
E.N. Central |
6 |
25 |
178 |
1,756 |
2,193 |
1 |
2 |
11 |
96 |
82 |
— |
1 |
3 |
25 |
43 |
|
Illinois |
— |
2 |
26 |
162 |
247 |
— |
1 |
4 |
33 |
34 |
— |
0 |
2 |
9 |
14 |
|
Indiana |
— |
1 |
12 |
86 |
125 |
— |
0 |
2 |
6 |
8 |
— |
0 |
2 |
5 |
3 |
|
Michigan |
— |
2 |
14 |
117 |
105 |
1 |
0 |
3 |
20 |
10 |
— |
0 |
1 |
3 |
7 |
|
Ohio |
6 |
2 |
17 |
115 |
119 |
— |
0 |
4 |
28 |
27 |
— |
0 |
2 |
5 |
12 |
|
Wisconsin |
— |
16 |
131 |
1,276 |
1,597 |
— |
0 |
2 |
9 |
3 |
— |
0 |
1 |
3 |
7 |
|
W.N. Central |
— |
6 |
53 |
230 |
1,844 |
— |
1 |
5 |
29 |
69 |
— |
0 |
2 |
11 |
22 |
|
Iowa |
— |
3 |
20 |
169 |
275 |
— |
0 |
2 |
11 |
11 |
— |
0 |
1 |
2 |
5 |
|
Kansas |
— |
0 |
3 |
22 |
18 |
— |
0 |
1 |
3 |
5 |
— |
0 |
1 |
4 |
4 |
|
Minnesota |
— |
0 |
43 |
— |
1,510 |
— |
0 |
3 |
— |
28 |
— |
0 |
1 |
1 |
5 |
|
Missouri |
— |
0 |
1 |
— |
3 |
— |
0 |
2 |
— |
17 |
— |
0 |
1 |
— |
7 |
|
Nebraska |
— |
0 |
3 |
11 |
7 |
— |
0 |
1 |
5 |
3 |
— |
0 |
1 |
3 |
1 |
|
North Dakota |
— |
0 |
5 |
18 |
26 |
— |
0 |
1 |
6 |
2 |
— |
0 |
0 |
— |
— |
|
South Dakota |
— |
0 |
2 |
10 |
5 |
— |
0 |
1 |
4 |
3 |
— |
0 |
1 |
1 |
— |
|
S. Atlantic |
35 |
71 |
175 |
2,626 |
2,986 |
9 |
7 |
18 |
288 |
212 |
1 |
1 |
4 |
43 |
47 |
|
Delaware |
4 |
8 |
22 |
311 |
318 |
— |
0 |
2 |
11 |
2 |
— |
0 |
0 |
— |
— |
|
District of Columbia |
N |
0 |
0 |
N |
N |
— |
0 |
2 |
9 |
11 |
— |
0 |
0 |
— |
3 |
|
Florida |
5 |
2 |
14 |
118 |
105 |
1 |
1 |
4 |
45 |
25 |
1 |
0 |
2 |
11 |
17 |
|
Georgia |
— |
0 |
1 |
— |
7 |
— |
1 |
4 |
27 |
37 |
— |
0 |
3 |
12 |
11 |
|
Maryland |
2 |
27 |
106 |
1,204 |
1,252 |
7 |
3 |
9 |
131 |
77 |
— |
0 |
1 |
1 |
2 |
|
North Carolina |
— |
3 |
56 |
113 |
98 |
— |
0 |
6 |
17 |
14 |
— |
0 |
1 |
2 |
4 |
|
South Carolina |
— |
0 |
3 |
18 |
32 |
— |
0 |
1 |
4 |
3 |
— |
0 |
2 |
6 |
2 |
|
Virginia |
23 |
24 |
120 |
659 |
942 |
1 |
1 |
4 |
43 |
42 |
— |
0 |
2 |
8 |
8 |
|
West Virginia |
1 |
3 |
25 |
203 |
232 |
— |
0 |
1 |
1 |
1 |
— |
0 |
2 |
3 |
— |
|
E.S. Central |
— |
2 |
6 |
67 |
76 |
— |
0 |
2 |
23 |
24 |
— |
0 |
2 |
13 |
7 |
|
Alabama |
— |
1 |
3 |
32 |
19 |
— |
0 |
1 |
5 |
10 |
— |
0 |
1 |
5 |
4 |
|
Kentucky |
— |
0 |
4 |
18 |
39 |
— |
0 |
1 |
5 |
4 |
— |
0 |
1 |
1 |
1 |
|
Mississippi |
— |
0 |
1 |
— |
2 |
— |
0 |
1 |
4 |
1 |
— |
0 |
0 |
— |
— |
|
Tennessee |
— |
0 |
4 |
17 |
16 |
— |
0 |
2 |
9 |
9 |
— |
0 |
1 |
7 |
2 |
|
W.S. Central |
2 |
1 |
6 |
24 |
31 |
2 |
2 |
13 |
78 |
69 |
— |
0 |
3 |
25 |
30 |
|
Arkansas |
— |
0 |
0 |
— |
— |
— |
0 |
1 |
2 |
5 |
— |
0 |
1 |
1 |
2 |
|
Louisiana |
— |
0 |
0 |
— |
3 |
— |
0 |
2 |
7 |
7 |
— |
0 |
1 |
3 |
5 |
|
Oklahoma |
— |
0 |
0 |
— |
— |
1 |
0 |
5 |
3 |
5 |
— |
0 |
1 |
4 |
3 |
|
Texas |
2 |
1 |
6 |
24 |
28 |
1 |
2 |
8 |
66 |
52 |
— |
0 |
3 |
17 |
20 |
|
Mountain |
1 |
0 |
4 |
30 |
32 |
— |
1 |
4 |
38 |
40 |
— |
0 |
2 |
11 |
11 |
|
Arizona |
— |
0 |
2 |
8 |
7 |
— |
0 |
4 |
31 |
10 |
— |
0 |
1 |
2 |
4 |
|
Colorado |
— |
0 |
0 |
— |
— |
— |
0 |
2 |
— |
18 |
— |
0 |
1 |
3 |
3 |
|
Idaho |
1 |
0 |
3 |
13 |
6 |
— |
0 |
2 |
— |
2 |
— |
0 |
1 |
1 |
— |
|
Montana |
— |
0 |
1 |
5 |
4 |
— |
0 |
1 |
3 |
1 |
— |
0 |
1 |
1 |
— |
|
Nevada |
— |
0 |
1 |
2 |
7 |
— |
0 |
2 |
— |
3 |
— |
0 |
0 |
— |
1 |
|
New Mexico |
— |
0 |
1 |
1 |
— |
— |
0 |
1 |
2 |
2 |
— |
0 |
1 |
2 |
1 |
|
Utah |
— |
0 |
1 |
1 |
7 |
— |
0 |
2 |
1 |
3 |
— |
0 |
1 |
2 |
1 |
|
Wyoming |
— |
0 |
0 |
— |
1 |
— |
0 |
1 |
1 |
1 |
— |
0 |
0 |
— |
1 |
|
Pacific |
6 |
2 |
24 |
103 |
111 |
1 |
3 |
22 |
110 |
87 |
2 |
2 |
11 |
86 |
54 |
|
Alaska |
— |
0 |
2 |
12 |
4 |
— |
0 |
1 |
2 |
3 |
— |
0 |
2 |
4 |
2 |
|
California |
— |
1 |
4 |
33 |
79 |
1 |
2 |
4 |
64 |
71 |
— |
1 |
6 |
60 |
33 |
|
Hawaii |
N |
0 |
0 |
N |
N |
— |
0 |
1 |
1 |
— |
— |
0 |
2 |
1 |
2 |
|
Oregon |
1 |
1 |
4 |
50 |
28 |
— |
0 |
3 |
14 |
13 |
2 |
0 |
3 |
13 |
17 |
|
Washington |
5 |
0 |
24 |
8 |
— |
— |
0 |
21 |
29 |
— |
— |
0 |
10 |
8 |
— |
|
Territories |
|||||||||||||||
|
American Samoa |
N |
0 |
0 |
N |
N |
— |
0 |
0 |
— |
— |
— |
0 |
0 |
— |
— |
|
C.N.M.I. |
— |
— |
— |
— |
— |
— |
— |
— |
— |
— |
— |
— |
— |
— |
— |
|
Guam |
— |
0 |
0 |
— |
— |
— |
0 |
0 |
— |
— |
— |
0 |
0 |
— |
— |
|
Puerto Rico |
N |
0 |
0 |
N |
N |
— |
0 |
1 |
1 |
6 |
— |
0 |
0 |
— |
— |
|
U.S. Virgin Islands |
— |
0 |
0 |
— |
— |
— |
0 |
0 |
— |
— |
— |
0 |
0 |
— |
— |
|
C.N.M.I.: Commonwealth of Northern Mariana Islands. U: Unavailable. —: No reported cases. N: Not reportable. NN: Not Nationally Notifiable. NP: Nationally notifiable but not published. Cum: Cumulative year-to-date counts. Med: Median. Max: Maximum. * Three low incidence conditions, rubella, rubella congenital, and tetanus, are in Table II to facilitate case count verification with reporting jurisdictions. † Case counts for reporting year 2015 and 2016 are provisional and subject to change. For further information on interpretation of these data, see http://wwwn.cdc.gov/nndss/document/ProvisionalNationaNotifiableDiseasesSurveillanceData20100927.pdfCdc-pdf. Data for TB are displayed in Table IV, which appears quarterly. § Data for meningococcal disease, invasive caused by serogroups ACWY, serogroup B, other serogroup, and unknown serogroup are available in Table I. |
|||||||||||||||
|
TABLE II. (Continued) Provisional cases of selected notifiable diseases (≥1,000 cases reported during the preceding year), and selected* low frequency diseases, United States and U.S. territories, weeks ending September 3, 2016, and September 5, 2015 (35th week)† (Export data) |
|||||||||||||||
|
Reporting area |
Mumps |
Pertussis |
Rabies, animal |
||||||||||||
|
Current week |
Previous 52 weeks |
Cum 2016 |
Cum 2015 |
Current week |
Previous 52 weeks |
Cum 2016 |
Cum 2015 |
Current week |
Previous 52 weeks |
Cum 2016 |
Cum 2015 |
||||
|
Med |
Max |
Med |
Max |
Med |
Max |
||||||||||
|
United States |
8 |
50 |
129 |
1,871 |
521 |
111 |
303 |
1,924 |
9,801 |
13,590 |
75 |
58 |
100 |
1,825 |
2,777 |
|
New England |
— |
1 |
38 |
255 |
9 |
5 |
12 |
30 |
484 |
479 |
2 |
5 |
10 |
176 |
175 |
|
Connecticut |
— |
0 |
12 |
34 |
1 |
— |
1 |
6 |
62 |
54 |
— |
2 |
5 |
67 |
115 |
|
Maine |
— |
0 |
1 |
4 |
— |
4 |
4 |
12 |
161 |
205 |
— |
1 |
6 |
46 |
19 |
|
Massachusetts |
— |
1 |
28 |
209 |
4 |
— |
3 |
10 |
90 |
166 |
— |
0 |
0 |
— |
— |
|
New Hampshire |
— |
0 |
5 |
7 |
2 |
— |
1 |
3 |
28 |
26 |
— |
0 |
2 |
14 |
15 |
|
Rhode Island |
— |
0 |
1 |
1 |
1 |
— |
0 |
16 |
59 |
15 |
— |
0 |
2 |
14 |
12 |
|
Vermont |
— |
0 |
0 |
— |
1 |
1 |
2 |
8 |
84 |
13 |
2 |
1 |
3 |
35 |
14 |
|
Mid. Atlantic |
6 |
2 |
14 |
118 |
106 |
27 |
53 |
92 |
1,820 |
1,518 |
14 |
10 |
33 |
349 |
475 |
|
New Jersey |
— |
0 |
3 |
18 |
21 |
— |
10 |
23 |
302 |
283 |
— |
0 |
0 |
— |
— |
|
New York (Upstate) |
6 |
0 |
10 |
64 |
17 |
16 |
13 |
50 |
467 |
360 |
14 |
7 |
33 |
349 |
246 |
|
New York City |
— |
1 |
10 |
32 |
60 |
— |
7 |
22 |
188 |
240 |
— |
0 |
1 |
— |
5 |
|
Pennsylvania |
— |
0 |
2 |
4 |
8 |
11 |
21 |
41 |
863 |
635 |
— |
0 |
15 |
— |
224 |
|
E.N. Central |
— |
16 |
54 |
616 |
214 |
17 |
67 |
146 |
2,238 |
1,822 |
8 |
1 |
19 |
88 |
124 |
|
Illinois |
— |
9 |
33 |
293 |
186 |
— |
18 |
31 |
568 |
414 |
3 |
1 |
18 |
49 |
72 |
|
Indiana |
— |
1 |
23 |
227 |
3 |
— |
3 |
9 |
100 |
151 |
— |
0 |
0 |
— |
— |
|
Michigan |
— |
0 |
2 |
11 |
2 |
1 |
7 |
19 |
207 |
330 |
— |
0 |
3 |
19 |
26 |
|
Ohio |
— |
0 |
20 |
65 |
16 |
16 |
18 |
40 |
645 |
499 |
5 |
0 |
5 |
20 |
26 |
|
Wisconsin |
— |
0 |
17 |
20 |
7 |
— |
20 |
93 |
718 |
428 |
N |
0 |
0 |
N |
N |
|
W.N. Central |
— |
19 |
48 |
639 |
58 |
— |
24 |
64 |
585 |
1,402 |
2 |
2 |
8 |
76 |
157 |
|
Iowa |
— |
16 |
47 |
553 |
29 |
— |
3 |
11 |
77 |
99 |
— |
0 |
0 |
— |
— |
|
Kansas |
— |
0 |
2 |
6 |
— |
— |
2 |
11 |
56 |
351 |
— |
1 |
8 |
43 |
84 |
|
Minnesota |
— |
0 |
4 |
21 |
4 |
— |
11 |
28 |
311 |
321 |
— |
0 |
0 |
— |
— |
|
Missouri |
— |
0 |
1 |
— |
23 |
— |
0 |
13 |
2 |
183 |
— |
0 |
4 |
4 |
22 |
|
Nebraska |
— |
0 |
10 |
45 |
2 |
— |
3 |
13 |
108 |
423 |
2 |
0 |
2 |
14 |
27 |
|
North Dakota |
— |
0 |
3 |
12 |
— |
— |
1 |
4 |
25 |
21 |
— |
0 |
0 |
— |
— |
|
South Dakota |
— |
0 |
2 |
2 |
— |
— |
0 |
2 |
6 |
4 |
— |
0 |
2 |
15 |
24 |
|
S. Atlantic |
2 |
1 |
8 |
57 |
56 |
4 |
25 |
77 |
831 |
1,161 |
8 |
14 |
27 |
484 |
791 |
|
Delaware |
— |
0 |
0 |
— |
2 |
— |
0 |
3 |
11 |
7 |
— |
0 |
0 |
— |
— |
|
District of Columbia |
— |
0 |
0 |
— |
— |
— |
0 |
0 |
— |
— |
— |
0 |
0 |
— |
— |
|
Florida |
1 |
0 |
2 |
12 |
8 |
4 |
7 |
16 |
244 |
241 |
— |
0 |
18 |
57 |
83 |
|
Georgia |
— |
0 |
1 |
1 |
— |
— |
3 |
16 |
111 |
163 |
— |
0 |
9 |
— |
182 |
|
Maryland |
— |
0 |
3 |
5 |
12 |
— |
2 |
7 |
65 |
87 |
— |
5 |
21 |
231 |
262 |
|
North Carolina |
— |
0 |
8 |
27 |
3 |
— |
7 |
31 |
180 |
267 |
8 |
5 |
10 |
173 |
236 |
|
South Carolina |
— |
0 |
1 |
4 |
— |
— |
2 |
8 |
90 |
115 |
N |
0 |
0 |
N |
N |
|
Virginia |
1 |
0 |
2 |
8 |
30 |
— |
4 |
35 |
112 |
230 |
— |
0 |
0 |
— |
— |
|
West Virginia |
— |
0 |
0 |
— |
1 |
— |
0 |
7 |
18 |
51 |
— |
0 |
3 |
23 |
28 |
|
E.S. Central |
— |
0 |
14 |
78 |
8 |
5 |
14 |
34 |
611 |
365 |
3 |
2 |
7 |
74 |
79 |
|
Alabama |
— |
0 |
1 |
1 |
1 |
— |
3 |
7 |
124 |
115 |
3 |
1 |
7 |
61 |
67 |
|
Kentucky |
— |
0 |
14 |
73 |
4 |
3 |
8 |
27 |
392 |
94 |
— |
0 |
5 |
12 |
9 |
|
Mississippi |
— |
0 |
1 |
1 |
— |
— |
0 |
1 |
1 |
10 |
— |
0 |
2 |
1 |
3 |
|
Tennessee |
— |
0 |
1 |
3 |
3 |
2 |
3 |
7 |
94 |
146 |
— |
0 |
0 |
— |
— |
|
W.S. Central |
— |
1 |
3 |
29 |
22 |
25 |
27 |
163 |
916 |
1,079 |
37 |
14 |
55 |
454 |
775 |
|
Arkansas |
— |
0 |
1 |
1 |
4 |
— |
1 |
7 |
27 |
34 |
— |
0 |
4 |
15 |
59 |
|
Louisiana |
— |
0 |
1 |
— |
1 |
— |
1 |
5 |
35 |
40 |
— |
0 |
0 |
— |
— |
|
Oklahoma |
— |
0 |
1 |
1 |
1 |
— |
0 |
54 |
75 |
27 |
— |
0 |
3 |
20 |
72 |
|
Texas |
— |
0 |
3 |
27 |
16 |
25 |
25 |
119 |
779 |
978 |
37 |
12 |
51 |
419 |
644 |
|
Mountain |
— |
0 |
6 |
39 |
16 |
15 |
34 |
72 |
994 |
2,084 |
— |
0 |
5 |
14 |
45 |
|
Arizona |
— |
0 |
1 |
4 |
2 |
— |
6 |
21 |
215 |
438 |
N |
0 |
0 |
N |
N |
|
Colorado |
— |
0 |
3 |
10 |
5 |
14 |
15 |
26 |
483 |
622 |
— |
0 |
0 |
— |
— |
|
Idaho |
— |
0 |
1 |
1 |
8 |
1 |
1 |
8 |
71 |
171 |
— |
0 |
3 |
8 |
7 |
|
Montana |
— |
0 |
6 |
20 |
— |
— |
0 |
3 |
13 |
221 |
— |
0 |
0 |
— |
— |
|
Nevada |
— |
0 |
1 |
1 |
— |
— |
0 |
7 |
1 |
91 |
— |
0 |
2 |
4 |
5 |
|
New Mexico |
— |
0 |
1 |
2 |
1 |
— |
3 |
13 |
90 |
121 |
— |
0 |
1 |
2 |
9 |
|
Utah |
— |
0 |
1 |
1 |
— |
— |
4 |
15 |
107 |
407 |
— |
0 |
2 |
— |
15 |
|
Wyoming |
— |
0 |
0 |
— |
— |
— |
0 |
4 |
14 |
13 |
— |
0 |
2 |
— |
9 |
|
Pacific |
— |
1 |
7 |
40 |
32 |
13 |
40 |
1,410 |
1,322 |
3,680 |
1 |
3 |
17 |
110 |
156 |
|
Alaska |
— |
0 |
2 |
2 |
— |
3 |
2 |
7 |
88 |
87 |
— |
0 |
3 |
9 |
3 |
|
California |
— |
0 |
3 |
29 |
28 |
— |
24 |
54 |
722 |
3,079 |
— |
2 |
14 |
94 |
141 |
|
Hawaii |
— |
0 |
1 |
2 |
1 |
— |
1 |
5 |
47 |
37 |
— |
0 |
0 |
— |
— |
|
Oregon |
— |
0 |
1 |
4 |
3 |
— |
5 |
14 |
138 |
477 |
1 |
0 |
3 |
7 |
12 |
|
Washington |
— |
0 |
7 |
3 |
— |
10 |
6 |
1,382 |
327 |
— |
— |
0 |
10 |
— |
— |
|
Territories |
|||||||||||||||
|
American Samoa |
— |
0 |
0 |
— |
— |
— |
0 |
0 |
— |
— |
U |
0 |
0 |
U |
U |
|
C.N.M.I. |
— |
— |
— |
— |
— |
— |
— |
— |
— |
— |
— |
— |
— |
— |
— |
|
Guam |
— |
0 |
0 |
— |
5 |
— |
0 |
7 |
— |
45 |
— |
0 |
0 |
— |
— |
|
Puerto Rico |
— |
0 |
1 |
1 |
3 |
— |
0 |
3 |
8 |
10 |
— |
0 |
1 |
— |
12 |
|
U.S. Virgin Islands |
— |
0 |
0 |
— |
— |
— |
0 |
0 |
— |
— |
— |
0 |
0 |
— |
— |
|
C.N.M.I.: Commonwealth of Northern Mariana Islands. U: Unavailable. —: No reported cases. N: Not reportable. NN: Not Nationally Notifiable. NP: Nationally notifiable but not published. Cum: Cumulative year-to-date counts. Med: Median. Max: Maximum. * Three low incidence conditions, rubella, rubella congenital, and tetanus, are in Table II to facilitate case count verification with reporting jurisdictions. † Case counts for reporting year 2015 and 2016 are provisional and subject to change. For further information on interpretation of these data, see http://wwwn.cdc.gov/nndss/document/ProvisionalNationaNotifiableDiseasesSurveillanceData20100927.pdfCdc-pdf. Data for TB are displayed in Table IV, which appears quarterly. |
|||||||||||||||
|
TABLE II. (Continued) Provisional cases of selected notifiable diseases (≥1,000 cases reported during the preceding year), and selected* low frequency diseases, United States and U.S. territories, weeks ending September 3, 2016, and September 5, 2015 (35th week)† (Export data) |
|||||||||||||||
|
Reporting area |
Rubella |
Rubella, congenital syndrome |
Salmonellosis |
||||||||||||
|
Current week |
Previous 52 weeks |
Cum 2016 |
Cum 2015 |
Current week |
Previous 52 weeks |
Cum 2016 |
Cum 2015 |
Current week |
Previous 52 weeks |
Cum 2016 |
Cum 2015 |
||||
|
Med |
Max |
Med |
Max |
Med |
Max |
||||||||||
|
United States |
— |
0 |
2 |
3 |
2 |
— |
0 |
0 |
— |
1 |
668 |
914 |
2,254 |
27,584 |
34,253 |
|
New England |
— |
0 |
0 |
— |
— |
— |
0 |
0 |
— |
— |
20 |
37 |
87 |
1,378 |
1,488 |
|
Connecticut |
— |
0 |
0 |
— |
— |
— |
0 |
0 |
— |
— |
— |
7 |
22 |
256 |
328 |
|
Maine |
— |
0 |
0 |
— |
— |
— |
0 |
0 |
— |
— |
2 |
2 |
7 |
86 |
94 |
|
Massachusetts |
— |
0 |
0 |
— |
— |
— |
0 |
0 |
— |
— |
18 |
19 |
49 |
790 |
813 |
|
New Hampshire |
— |
0 |
0 |
— |
— |
— |
0 |
0 |
— |
— |
— |
3 |
9 |
85 |
129 |
|
Rhode Island |
— |
0 |
0 |
— |
— |
— |
0 |
0 |
— |
— |
— |
2 |
44 |
67 |
63 |
|
Vermont |
— |
0 |
0 |
— |
— |
— |
0 |
0 |
— |
— |
— |
1 |
10 |
94 |
61 |
|
Mid. Atlantic |
— |
0 |
0 |
— |
— |
— |
0 |
0 |
— |
1 |
68 |
83 |
166 |
2,680 |
3,363 |
|
New Jersey |
— |
0 |
0 |
— |
— |
— |
0 |
0 |
— |
— |
— |
11 |
43 |
289 |
831 |
|
New York (Upstate) |
— |
0 |
0 |
— |
— |
— |
0 |
0 |
— |
— |
— |
25 |
66 |
889 |
845 |
|
New York City |
— |
0 |
0 |
— |
— |
— |
0 |
0 |
— |
1 |
40 |
18 |
33 |
616 |
609 |
|
Pennsylvania |
— |
0 |
0 |
— |
— |
— |
0 |
0 |
— |
— |
28 |
25 |
56 |
886 |
1,078 |
|
E.N. Central |
— |
0 |
0 |
— |
1 |
— |
0 |
0 |
— |
— |
49 |
96 |
185 |
3,361 |
4,048 |
|
Illinois |
— |
0 |
0 |
— |
— |
— |
0 |
0 |
— |
— |
— |
29 |
66 |
919 |
1,275 |
|
Indiana |
— |
0 |
0 |
— |
— |
— |
0 |
0 |
— |
— |
— |
11 |
22 |
330 |
470 |
|
Michigan |
— |
0 |
0 |
— |
— |
— |
0 |
0 |
— |
— |
7 |
19 |
38 |
619 |
642 |
|
Ohio |
— |
0 |
0 |
— |
— |
— |
0 |
0 |
— |
— |
42 |
27 |
71 |
1,100 |
952 |
|
Wisconsin |
— |
0 |
0 |
— |
1 |
— |
0 |
0 |
— |
— |
— |
13 |
45 |
393 |
709 |
|
W.N. Central |
— |
0 |
1 |
— |
— |
— |
0 |
0 |
— |
— |
12 |
39 |
158 |
1,295 |
2,638 |
|
Iowa |
— |
0 |
0 |
— |
— |
— |
0 |
0 |
— |
— |
8 |
11 |
57 |
527 |
459 |
|
Kansas |
— |
0 |
0 |
— |
— |
— |
0 |
0 |
— |
— |
1 |
8 |
19 |
280 |
343 |
|
Minnesota |
— |
0 |
0 |
— |
— |
— |
0 |
0 |
— |
— |
— |
0 |
58 |
— |
695 |
|
Missouri |
— |
0 |
1 |
— |
— |
— |
0 |
0 |
— |
— |
— |
0 |
32 |
28 |
651 |
|
Nebraska |
— |
0 |
0 |
— |
— |
— |
0 |
0 |
— |
— |
3 |
5 |
12 |
180 |
217 |
|
North Dakota |
— |
0 |
0 |
— |
— |
— |
0 |
0 |
— |
— |
— |
2 |
8 |
79 |
104 |
|
South Dakota |
— |
0 |
0 |
— |
— |
— |
0 |
0 |
— |
— |
— |
3 |
104 |
201 |
169 |
|
S. Atlantic |
— |
0 |
2 |
3 |
— |
— |
0 |
0 |
— |
— |
251 |
256 |
475 |
7,188 |
8,750 |
|
Delaware |
— |
0 |
0 |
— |
— |
— |
0 |
0 |
— |
— |
— |
2 |
10 |
75 |
118 |
|
District of Columbia |
— |
0 |
0 |
— |
— |
— |
0 |
0 |
— |
— |
— |
0 |
27 |
1 |
79 |
|
Florida |
— |
0 |
1 |
2 |
— |
— |
0 |
0 |
— |
— |
158 |
111 |
189 |
3,281 |
3,476 |
|
Georgia |
— |
0 |
0 |
— |
— |
— |
0 |
0 |
— |
— |
52 |
36 |
85 |
1,321 |
1,400 |
|
Maryland |
— |
0 |
1 |
1 |
— |
— |
0 |
0 |
— |
— |
27 |
15 |
37 |
577 |
640 |
|
North Carolina |
— |
0 |
0 |
— |
— |
— |
0 |
0 |
— |
— |
— |
28 |
162 |
662 |
1,247 |
|
South Carolina |
— |
0 |
1 |
— |
— |
— |
0 |
0 |
— |
— |
7 |
17 |
68 |
500 |
920 |
|
Virginia |
— |
0 |
0 |
— |
— |
— |
0 |
0 |
— |
— |
7 |
21 |
55 |
653 |
726 |
|
West Virginia |
— |
0 |
0 |
— |
— |
— |
0 |
0 |
— |
— |
— |
3 |
10 |
118 |
144 |
|
E.S. Central |
— |
0 |
0 |
— |
— |
— |
0 |
0 |
— |
— |
13 |
64 |
111 |
2,142 |
2,396 |
|
Alabama |
— |
0 |
0 |
— |
— |
— |
0 |
0 |
— |
— |
— |
17 |
47 |
519 |
733 |
|
Kentucky |
— |
0 |
0 |
— |
— |
— |
0 |
0 |
— |
— |
— |
8 |
77 |
429 |
372 |
|
Mississippi |
— |
0 |
0 |
— |
— |
— |
0 |
0 |
— |
— |
1 |
16 |
49 |
596 |
698 |
|
Tennessee |
— |
0 |
0 |
— |
— |
— |
0 |
0 |
— |
— |
12 |
16 |
41 |
598 |
593 |
|
W.S. Central |
— |
0 |
1 |
— |
1 |
— |
0 |
0 |
— |
— |
188 |
168 |
476 |
4,601 |
4,671 |
|
Arkansas |
— |
0 |
0 |
— |
— |
— |
0 |
0 |
— |
— |
18 |
15 |
43 |
458 |
461 |
|
Louisiana |
— |
0 |
0 |
— |
— |
— |
0 |
0 |
— |
— |
— |
19 |
60 |
564 |
821 |
|
Oklahoma |
— |
0 |
0 |
— |
— |
— |
0 |
0 |
— |
— |
29 |
15 |
61 |
567 |
444 |
|
Texas |
— |
0 |
1 |
— |
1 |
— |
0 |
0 |
— |
— |
141 |
111 |
387 |
3,012 |
2,945 |
|
Mountain |
— |
0 |
0 |
— |
— |
— |
0 |
0 |
— |
— |
25 |
44 |
143 |
1,259 |
2,563 |
|
Arizona |
— |
0 |
0 |
— |
— |
— |
0 |
0 |
— |
— |
15 |
16 |
49 |
534 |
679 |
|
Colorado |
— |
0 |
0 |
— |
— |
— |
0 |
0 |
— |
— |
— |
0 |
24 |
— |
391 |
|
Idaho |
— |
0 |
0 |
— |
— |
— |
0 |
0 |
— |
— |
3 |
4 |
11 |
124 |
486 |
|
Montana |
— |
0 |
0 |
— |
— |
— |
0 |
0 |
— |
— |
3 |
3 |
8 |
104 |
145 |
|
Nevada |
— |
0 |
0 |
— |
— |
— |
0 |
0 |
— |
— |
— |
2 |
14 |
29 |
182 |
|
New Mexico |
— |
0 |
0 |
— |
— |
— |
0 |
0 |
— |
— |
— |
6 |
23 |
178 |
290 |
|
Utah |
— |
0 |
0 |
— |
— |
— |
0 |
0 |
— |
— |
4 |
7 |
27 |
242 |
328 |
|
Wyoming |
— |
0 |
0 |
— |
— |
— |
0 |
0 |
— |
— |
— |
1 |
7 |
48 |
62 |
|
Pacific |
— |
0 |
0 |
— |
— |
— |
0 |
0 |
— |
— |
42 |
108 |
1,110 |
3,680 |
4,336 |
|
Alaska |
— |
0 |
0 |
— |
— |
— |
0 |
0 |
— |
— |
— |
1 |
5 |
55 |
56 |
|
California |
— |
0 |
0 |
— |
— |
— |
0 |
0 |
— |
— |
10 |
83 |
189 |
2,725 |
3,738 |
|
Hawaii |
— |
0 |
0 |
— |
— |
— |
0 |
0 |
— |
— |
— |
5 |
12 |
158 |
182 |
|
Oregon |
— |
0 |
0 |
— |
— |
— |
0 |
0 |
— |
— |
6 |
8 |
23 |
288 |
360 |
|
Washington |
— |
0 |
0 |
— |
— |
— |
0 |
0 |
— |
— |
26 |
8 |
1,035 |
454 |
— |
|
Territories |
|||||||||||||||
|
American Samoa |
— |
0 |
0 |
— |
— |
— |
0 |
0 |
— |
— |
— |
0 |
0 |
— |
— |
|
C.N.M.I. |
— |
— |
— |
— |
— |
— |
— |
— |
— |
— |
— |
— |
— |
— |
— |
|
Guam |
— |
0 |
0 |
— |
— |
— |
0 |
0 |
— |
— |
— |
0 |
5 |
— |
11 |
|
Puerto Rico |
— |
0 |
0 |
— |
— |
— |
0 |
0 |
— |
— |
— |
10 |
27 |
236 |
411 |
|
U.S. Virgin Islands |
— |
0 |
0 |
— |
— |
— |
0 |
0 |
— |
— |
— |
0 |
0 |
— |
— |
|
C.N.M.I.: Commonwealth of Northern Mariana Islands. U: Unavailable. —: No reported cases. N: Not reportable. NN: Not Nationally Notifiable. NP: Nationally notifiable but not published. Cum: Cumulative year-to-date counts. Med: Median. Max: Maximum. * Three low incidence conditions, rubella, rubella congenital, and tetanus, are in Table II to facilitate case count verification with reporting jurisdictions. † Case counts for reporting year 2015 and 2016 are provisional and subject to change. For further information on interpretation of these data, see http://wwwn.cdc.gov/nndss/document/ProvisionalNationaNotifiableDiseasesSurveillanceData20100927.pdfCdc-pdf. Data for TB are displayed in Table IV, which appears quarterly. |
|||||||||||||||
|
TABLE II. (Continued) Provisional cases of selected notifiable diseases (≥1,000 cases reported during the preceding year), and selected* low frequency diseases, United States and U.S. territories, weeks ending September 3, 2016, and September 5, 2015 (35th week)† (Export data) |
||||||||||
|
Reporting area |
Shiga toxin-producing E. coli (STEC)§ |
Shigellosis |
||||||||
|
Current week |
Previous 52 weeks |
Cum 2016 |
Cum 2015 |
Current week |
Previous 52 weeks |
Cum 2016 |
Cum 2015 |
|||
|
Med |
Max |
Med |
Max |
|||||||
|
United States |
57 |
119 |
549 |
3,834 |
4,413 |
143 |
397 |
981 |
12,538 |
13,893 |
|
New England |
1 |
5 |
36 |
222 |
160 |
1 |
5 |
13 |
171 |
195 |
|
Connecticut |
— |
1 |
33 |
91 |
65 |
— |
1 |
4 |
29 |
44 |
|
Maine |
— |
0 |
3 |
22 |
21 |
— |
0 |
1 |
1 |
3 |
|
Massachusetts |
— |
2 |
7 |
77 |
41 |
1 |
3 |
11 |
119 |
118 |
|
New Hampshire |
— |
0 |
4 |
13 |
15 |
— |
0 |
1 |
5 |
4 |
|
Rhode Island |
— |
0 |
1 |
4 |
6 |
— |
0 |
2 |
16 |
21 |
|
Vermont |
1 |
0 |
4 |
15 |
12 |
— |
0 |
1 |
1 |
5 |
|
Mid. Atlantic |
8 |
12 |
27 |
453 |
468 |
8 |
26 |
41 |
854 |
1,326 |
|
New Jersey |
— |
2 |
7 |
68 |
101 |
— |
4 |
12 |
112 |
254 |
|
New York (Upstate) |
— |
4 |
16 |
181 |
122 |
— |
4 |
10 |
123 |
257 |
|
New York City |
4 |
1 |
7 |
76 |
80 |
6 |
7 |
17 |
275 |
565 |
|
Pennsylvania |
4 |
3 |
12 |
128 |
165 |
2 |
9 |
26 |
344 |
250 |
|
E.N. Central |
14 |
13 |
80 |
587 |
617 |
28 |
64 |
123 |
2,300 |
1,524 |
|
Illinois |
— |
3 |
59 |
191 |
125 |
— |
13 |
35 |
373 |
564 |
|
Indiana |
— |
1 |
8 |
42 |
89 |
— |
5 |
13 |
156 |
186 |
|
Michigan |
— |
2 |
10 |
108 |
88 |
3 |
10 |
24 |
364 |
331 |
|
Ohio |
14 |
4 |
19 |
177 |
162 |
18 |
22 |
54 |
800 |
325 |
|
Wisconsin |
— |
2 |
10 |
69 |
153 |
7 |
14 |
39 |
607 |
118 |
|
W.N. Central |
3 |
16 |
41 |
473 |
695 |
3 |
29 |
98 |
718 |
1,413 |
|
Iowa |
— |
4 |
20 |
227 |
116 |
3 |
10 |
31 |
371 |
417 |
|
Kansas |
— |
2 |
7 |
81 |
82 |
— |
4 |
14 |
166 |
78 |
|
Minnesota |
— |
0 |
13 |
— |
171 |
— |
0 |
21 |
— |
86 |
|
Missouri |
— |
0 |
9 |
9 |
173 |
— |
0 |
52 |
27 |
524 |
|
Nebraska |
3 |
2 |
9 |
97 |
81 |
— |
2 |
14 |
122 |
50 |
|
North Dakota |
— |
0 |
3 |
24 |
31 |
— |
0 |
2 |
15 |
20 |
|
South Dakota |
— |
1 |
4 |
35 |
41 |
— |
1 |
12 |
17 |
238 |
|
S. Atlantic |
7 |
10 |
19 |
359 |
391 |
25 |
56 |
130 |
1,681 |
2,907 |
|
Delaware |
— |
0 |
2 |
7 |
2 |
— |
1 |
3 |
39 |
17 |
|
District of Columbia |
— |
0 |
0 |
— |
— |
— |
0 |
0 |
— |
— |
|
Florida |
4 |
3 |
7 |
117 |
93 |
14 |
17 |
38 |
467 |
1,353 |
|
Georgia |
— |
2 |
6 |
67 |
77 |
5 |
17 |
38 |
507 |
833 |
|
Maryland |
2 |
1 |
8 |
49 |
60 |
2 |
3 |
13 |
103 |
158 |
|
North Carolina |
— |
0 |
6 |
21 |
40 |
— |
5 |
34 |
152 |
186 |
|
South Carolina |
— |
0 |
2 |
16 |
31 |
— |
4 |
44 |
131 |
131 |
|
Virginia |
1 |
1 |
8 |
69 |
74 |
4 |
7 |
22 |
277 |
215 |
|
West Virginia |
— |
0 |
3 |
13 |
14 |
— |
0 |
2 |
5 |
14 |
|
E.S. Central |
2 |
5 |
14 |
209 |
212 |
7 |
15 |
37 |
462 |
998 |
|
Alabama |
— |
1 |
3 |
19 |
24 |
— |
8 |
25 |
176 |
421 |
|
Kentucky |
1 |
1 |
5 |
53 |
53 |
2 |
3 |
15 |
126 |
329 |
|
Mississippi |
— |
0 |
3 |
13 |
13 |
— |
1 |
4 |
36 |
73 |
|
Tennessee |
1 |
3 |
8 |
124 |
122 |
5 |
3 |
9 |
124 |
175 |
|
W.S. Central |
9 |
16 |
92 |
526 |
537 |
42 |
126 |
497 |
3,863 |
3,768 |
|
Arkansas |
1 |
1 |
7 |
68 |
53 |
1 |
3 |
9 |
108 |
40 |
|
Louisiana |
— |
0 |
2 |
8 |
36 |
— |
6 |
16 |
218 |
130 |
|
Oklahoma |
4 |
2 |
33 |
86 |
95 |
7 |
16 |
124 |
516 |
565 |
|
Texas |
4 |
12 |
53 |
364 |
353 |
34 |
97 |
363 |
3,021 |
3,033 |
|
Mountain |
10 |
11 |
30 |
353 |
523 |
9 |
30 |
54 |
1,172 |
470 |
|
Arizona |
1 |
2 |
8 |
97 |
89 |
8 |
23 |
49 |
942 |
279 |
|
Colorado |
— |
0 |
10 |
— |
141 |
— |
0 |
8 |
— |
48 |
|
Idaho |
9 |
3 |
12 |
119 |
90 |
1 |
1 |
4 |
36 |
16 |
|
Montana |
— |
2 |
7 |
64 |
52 |
— |
0 |
2 |
9 |
11 |
|
Nevada |
— |
0 |
7 |
6 |
28 |
— |
0 |
8 |
11 |
31 |
|
New Mexico |
— |
0 |
3 |
19 |
27 |
— |
2 |
23 |
119 |
50 |
|
Utah |
— |
1 |
7 |
44 |
64 |
— |
1 |
5 |
50 |
26 |
|
Wyoming |
— |
0 |
2 |
4 |
32 |
— |
0 |
1 |
5 |
9 |
|
Pacific |
3 |
18 |
399 |
652 |
810 |
20 |
43 |
190 |
1,317 |
1,292 |
|
Alaska |
— |
0 |
1 |
8 |
7 |
— |
0 |
1 |
4 |
2 |
|
California |
1 |
13 |
33 |
396 |
614 |
10 |
36 |
158 |
1,082 |
1,191 |
|
Hawaii |
— |
0 |
2 |
10 |
36 |
— |
1 |
4 |
27 |
59 |
|
Oregon |
2 |
4 |
12 |
123 |
153 |
— |
2 |
10 |
83 |
40 |
|
Washington |
— |
0 |
386 |
115 |
— |
10 |
2 |
152 |
121 |
— |
|
Territories |
||||||||||
|
American Samoa |
— |
0 |
0 |
— |
— |
— |
0 |
0 |
— |
— |
|
C.N.M.I. |
— |
— |
— |
— |
— |
— |
— |
— |
— |
— |
|
Guam |
— |
0 |
0 |
— |
— |
— |
0 |
5 |
— |
7 |
|
Puerto Rico |
— |
0 |
1 |
— |
1 |
— |
0 |
3 |
14 |
12 |
|
U.S. Virgin Islands |
— |
0 |
0 |
— |
— |
— |
0 |
0 |
— |
— |
|
C.N.M.I.: Commonwealth of Northern Mariana Islands. U: Unavailable. —: No reported cases. N: Not reportable. NN: Not Nationally Notifiable. NP: Nationally notifiable but not published. Cum: Cumulative year-to-date counts. Med: Median. Max: Maximum. * Three low incidence conditions, rubella, rubella congenital, and tetanus, are in Table II to facilitate case count verification with reporting jurisdictions. † Case counts for reporting year 2015 and 2016 are provisional and subject to change. For further information on interpretation of these data, see http://wwwn.cdc.gov/nndss/document/ProvisionalNationaNotifiableDiseasesSurveillanceData20100927.pdfCdc-pdf. Data for TB are displayed in Table IV, which appears quarterly. § Includes E. coli O157:H7, Shiga toxin-positive, serogroup non-O157, and Shiga toxin-positive, not serogrouped. |
||||||||||
|
TABLE II. (Continued) Provisional cases of selected notifiable diseases (≥1,000 cases reported during the preceding year), and selected* low frequency diseases, United States and U.S. territories, weeks ending September 3, 2016, and September 5, 2015 (35th week)† (Export data) |
|||||||||||||||
|
Reporting area |
Spotted Fever Rickettsiosis (including RMSF)§ |
Syphilis, primary and secondary |
|||||||||||||
|
Confirmed |
Probable |
||||||||||||||
|
Current week |
Previous 52 weeks |
Cum 2016 |
Cum 2015 |
Current week |
Previous 52 weeks |
Cum 2016 |
Cum 2015 |
Current week |
Previous 52 weeks |
Cum 2016 |
Cum 2015 |
||||
|
Med |
Max |
Med |
Max |
Med |
Max |
||||||||||
|
United States |
— |
2 |
10 |
84 |
149 |
28 |
54 |
322 |
2,293 |
2,833 |
101 |
486 |
581 |
15,453 |
15,637 |
|
New England |
— |
0 |
0 |
— |
2 |
— |
0 |
2 |
6 |
12 |
1 |
13 |
22 |
426 |
439 |
|
Connecticut |
— |
0 |
0 |
— |
1 |
— |
0 |
1 |
— |
3 |
1 |
1 |
5 |
23 |
67 |
|
Maine |
— |
0 |
0 |
— |
— |
— |
0 |
1 |
2 |
— |
— |
1 |
4 |
28 |
21 |
|
Massachusetts |
— |
0 |
0 |
— |
1 |
— |
0 |
1 |
3 |
8 |
— |
8 |
18 |
270 |
270 |
|
New Hampshire |
— |
0 |
0 |
— |
— |
— |
0 |
0 |
— |
— |
— |
1 |
11 |
39 |
27 |
|
Rhode Island |
— |
0 |
0 |
— |
— |
— |
0 |
1 |
1 |
1 |
— |
1 |
7 |
52 |
49 |
|
Vermont |
— |
0 |
0 |
— |
— |
— |
0 |
0 |
— |
— |
— |
0 |
3 |
14 |
5 |
|
Mid. Atlantic |
— |
0 |
1 |
6 |
5 |
— |
2 |
7 |
62 |
82 |
14 |
66 |
101 |
2,138 |
1,844 |
|
New Jersey |
— |
0 |
1 |
1 |
1 |
— |
0 |
3 |
30 |
54 |
— |
8 |
17 |
242 |
224 |
|
New York (Upstate) |
— |
0 |
1 |
3 |
4 |
— |
0 |
3 |
7 |
16 |
7 |
10 |
46 |
318 |
268 |
|
New York City |
— |
0 |
0 |
— |
— |
— |
0 |
3 |
13 |
4 |
4 |
33 |
45 |
1,088 |
932 |
|
Pennsylvania |
— |
0 |
1 |
2 |
— |
— |
0 |
4 |
12 |
8 |
3 |
14 |
21 |
490 |
420 |
|
E.N. Central |
— |
0 |
1 |
3 |
2 |
1 |
1 |
9 |
74 |
87 |
1 |
45 |
58 |
1,305 |
1,638 |
|
Illinois |
— |
0 |
1 |
1 |
1 |
— |
0 |
5 |
32 |
45 |
— |
15 |
32 |
385 |
714 |
|
Indiana |
— |
0 |
0 |
— |
— |
— |
0 |
4 |
18 |
27 |
1 |
6 |
12 |
215 |
193 |
|
Michigan |
— |
0 |
1 |
1 |
— |
— |
0 |
1 |
2 |
1 |
— |
6 |
12 |
189 |
291 |
|
Ohio |
— |
0 |
1 |
1 |
1 |
1 |
0 |
3 |
16 |
9 |
— |
13 |
21 |
436 |
386 |
|
Wisconsin |
— |
0 |
0 |
— |
— |
— |
0 |
1 |
6 |
5 |
— |
2 |
6 |
80 |
54 |
|
W.N. Central |
— |
0 |
3 |
15 |
8 |
3 |
7 |
31 |
314 |
393 |
3 |
17 |
32 |
618 |
527 |
|
Iowa |
— |
0 |
0 |
— |
— |
— |
0 |
1 |
8 |
8 |
1 |
1 |
4 |
46 |
45 |
|
Kansas |
— |
0 |
1 |
2 |
1 |
— |
1 |
8 |
73 |
131 |
1 |
2 |
5 |
76 |
57 |
|
Minnesota |
— |
0 |
0 |
— |
— |
— |
0 |
0 |
— |
10 |
— |
5 |
11 |
188 |
158 |
|
Missouri |
— |
0 |
3 |
11 |
2 |
3 |
4 |
23 |
213 |
225 |
1 |
6 |
16 |
250 |
199 |
|
Nebraska |
— |
0 |
3 |
1 |
4 |
— |
0 |
3 |
17 |
14 |
— |
1 |
6 |
32 |
31 |
|
North Dakota |
— |
0 |
1 |
1 |
— |
— |
0 |
1 |
— |
5 |
— |
0 |
3 |
19 |
8 |
|
South Dakota |
— |
0 |
0 |
— |
1 |
— |
0 |
1 |
3 |
— |
— |
0 |
2 |
7 |
29 |
|
S. Atlantic |
— |
1 |
8 |
40 |
93 |
10 |
10 |
73 |
455 |
602 |
24 |
121 |
164 |
3,934 |
3,975 |
|
Delaware |
— |
0 |
0 |
— |
— |
— |
0 |
3 |
10 |
14 |
— |
0 |
7 |
41 |
35 |
|
District of Columbia |
— |
0 |
0 |
— |
— |
— |
0 |
0 |
— |
— |
— |
1 |
7 |
70 |
74 |
|
Florida |
— |
0 |
1 |
3 |
— |
— |
0 |
2 |
11 |
13 |
1 |
44 |
66 |
1,479 |
1,336 |
|
Georgia |
— |
1 |
7 |
34 |
87 |
— |
0 |
0 |
— |
— |
2 |
25 |
50 |
871 |
996 |
|
Maryland |
— |
0 |
1 |
1 |
— |
5 |
0 |
4 |
20 |
2 |
2 |
9 |
22 |
294 |
337 |
|
North Carolina |
— |
0 |
1 |
1 |
3 |
— |
5 |
66 |
217 |
291 |
— |
20 |
41 |
626 |
753 |
|
South Carolina |
— |
0 |
1 |
— |
1 |
— |
0 |
2 |
10 |
35 |
4 |
6 |
15 |
216 |
179 |
|
Virginia |
— |
0 |
1 |
1 |
2 |
5 |
3 |
18 |
181 |
241 |
15 |
6 |
41 |
305 |
234 |
|
West Virginia |
— |
0 |
0 |
— |
— |
— |
0 |
1 |
6 |
6 |
— |
1 |
4 |
32 |
31 |
|
E.S. Central |
— |
0 |
1 |
7 |
17 |
9 |
14 |
56 |
799 |
872 |
1 |
19 |
38 |
665 |
645 |
|
Alabama |
— |
0 |
1 |
1 |
1 |
— |
3 |
24 |
256 |
237 |
— |
5 |
14 |
186 |
179 |
|
Kentucky |
— |
0 |
1 |
4 |
— |
— |
2 |
10 |
90 |
99 |
1 |
3 |
12 |
108 |
93 |
|
Mississippi |
— |
0 |
1 |
— |
3 |
— |
1 |
8 |
42 |
67 |
— |
5 |
13 |
178 |
138 |
|
Tennessee |
— |
0 |
1 |
2 |
13 |
9 |
8 |
33 |
411 |
469 |
— |
6 |
14 |
193 |
235 |
|
W.S. Central |
— |
0 |
7 |
5 |
6 |
5 |
10 |
307 |
562 |
742 |
41 |
50 |
75 |
1,770 |
1,796 |
|
Arkansas |
— |
0 |
1 |
5 |
3 |
2 |
10 |
74 |
524 |
678 |
— |
3 |
10 |
88 |
67 |
|
Louisiana |
— |
0 |
1 |
— |
1 |
— |
0 |
2 |
— |
8 |
— |
12 |
38 |
315 |
448 |
|
Oklahoma |
— |
0 |
7 |
— |
— |
— |
0 |
275 |
3 |
22 |
— |
3 |
12 |
115 |
136 |
|
Texas |
— |
0 |
0 |
— |
2 |
3 |
1 |
5 |
35 |
34 |
41 |
35 |
50 |
1,252 |
1,145 |
|
Mountain |
— |
0 |
1 |
7 |
16 |
— |
0 |
2 |
13 |
29 |
1 |
27 |
40 |
927 |
933 |
|
Arizona |
— |
0 |
1 |
4 |
9 |
— |
0 |
2 |
7 |
7 |
1 |
11 |
19 |
365 |
404 |
|
Colorado |
— |
0 |
0 |
— |
— |
— |
0 |
1 |
— |
6 |
— |
4 |
9 |
136 |
163 |
|
Idaho |
— |
0 |
1 |
3 |
— |
— |
0 |
1 |
3 |
3 |
— |
1 |
7 |
30 |
23 |
|
Montana |
— |
0 |
0 |
— |
5 |
— |
0 |
1 |
2 |
4 |
— |
0 |
2 |
8 |
7 |
|
Nevada |
— |
0 |
0 |
— |
1 |
— |
0 |
1 |
— |
— |
— |
6 |
16 |
225 |
219 |
|
New Mexico |
— |
0 |
0 |
— |
— |
— |
0 |
0 |
— |
2 |
— |
3 |
10 |
109 |
73 |
|
Utah |
— |
0 |
0 |
— |
1 |
— |
0 |
0 |
— |
6 |
— |
2 |
5 |
52 |
41 |
|
Wyoming |
— |
0 |
0 |
— |
— |
— |
0 |
1 |
1 |
1 |
— |
0 |
1 |
2 |
3 |
|
Pacific |
— |
0 |
1 |
1 |
— |
— |
0 |
4 |
8 |
14 |
15 |
115 |
144 |
3,670 |
3,840 |
|
Alaska |
N |
0 |
0 |
N |
N |
N |
0 |
0 |
N |
N |
— |
0 |
1 |
— |
5 |
|
California |
— |
0 |
0 |
— |
— |
— |
0 |
2 |
6 |
9 |
6 |
101 |
121 |
3,240 |
3,256 |
|
Hawaii |
N |
0 |
0 |
N |
N |
N |
0 |
0 |
N |
N |
— |
1 |
6 |
37 |
51 |
|
Oregon |
— |
0 |
1 |
1 |
— |
— |
0 |
1 |
2 |
5 |
4 |
6 |
15 |
217 |
226 |
|
Washington |
— |
0 |
0 |
— |
— |
— |
0 |
4 |
— |
— |
5 |
6 |
13 |
176 |
302 |
|
Territories |
|||||||||||||||
|
American Samoa |
N |
0 |
0 |
N |
N |
N |
0 |
0 |
N |
N |
— |
0 |
0 |
— |
— |
|
C.N.M.I. |
— |
— |
— |
— |
— |
— |
— |
— |
— |
— |
— |
— |
— |
— |
— |
|
Guam |
N |
0 |
0 |
N |
N |
N |
0 |
0 |
N |
N |
— |
0 |
0 |
— |
— |
|
Puerto Rico |
N |
0 |
0 |
N |
N |
N |
0 |
0 |
N |
N |
4 |
9 |
26 |
301 |
304 |
|
U.S. Virgin Islands |
— |
0 |
0 |
— |
— |
— |
0 |
0 |
— |
— |
— |
0 |
0 |
— |
— |
|
C.N.M.I.: Commonwealth of Northern Mariana Islands. U: Unavailable. —: No reported cases. N: Not reportable. NN: Not Nationally Notifiable. NP: Nationally notifiable but not published. Cum: Cumulative year-to-date counts. Med: Median. Max: Maximum. * Three low incidence conditions, rubella, rubella congenital, and tetanus, are in Table II to facilitate case count verification with reporting jurisdictions. † Case counts for reporting year 2015 and 2016 are provisional and subject to change. For further information on interpretation of these data, see http://wwwn.cdc.gov/nndss/document/ProvisionalNationaNotifiableDiseasesSurveillanceData20100927.pdfCdc-pdf. Data for TB are displayed in Table IV, which appears quarterly. § Illnesses with similar clinical presentation that result from Spotted Fever Group Rickettsia infections are reported as Spotted Fever Rickettsioses. Rocky Mountain Spotted Fever (RMSF), caused by Rickettsia rickettsii, is the most common and well-known Spotted Fever. |
|||||||||||||||
|
TABLE II. (Continued) Provisional cases of selected notifiable diseases (≥1,000 cases reported during the preceding year), and selected* low frequency diseases, United States and U.S. territories, weeks ending September 3, 2016, and September 5, 2015 (35th week)† (Export data) |
|||||||||||||||
|
Reporting area |
Tetanus |
Varicella (chickenpox) |
Vibriosis§ |
||||||||||||
|
Current week |
Previous 52 weeks |
Cum 2016 |
Cum 2015 |
Current week |
Previous 52 weeks |
Cum 2016 |
Cum 2015 |
Current week |
Previous 52 weeks |
Cum 2016 |
Cum 2015 |
||||
|
Med |
Max |
Med |
Max |
Med |
Max |
||||||||||
|
United States |
1 |
1 |
2 |
22 |
17 |
65 |
168 |
260 |
4,784 |
6,114 |
13 |
16 |
83 |
639 |
878 |
|
New England |
— |
0 |
0 |
— |
— |
5 |
16 |
32 |
509 |
610 |
— |
1 |
13 |
56 |
83 |
|
Connecticut |
— |
0 |
0 |
— |
— |
— |
2 |
10 |
78 |
114 |
— |
0 |
2 |
5 |
24 |
|
Maine |
— |
0 |
0 |
— |
— |
3 |
4 |
9 |
137 |
145 |
— |
0 |
2 |
4 |
5 |
|
Massachusetts |
— |
0 |
0 |
— |
— |
2 |
6 |
16 |
229 |
241 |
— |
1 |
9 |
39 |
49 |
|
New Hampshire |
— |
0 |
0 |
— |
— |
— |
0 |
7 |
1 |
57 |
— |
0 |
2 |
3 |
3 |
|
Rhode Island |
— |
0 |
0 |
— |
— |
— |
1 |
6 |
33 |
31 |
— |
0 |
3 |
5 |
1 |
|
Vermont |
— |
0 |
0 |
— |
— |
— |
0 |
6 |
31 |
22 |
— |
0 |
1 |
— |
1 |
|
Mid. Atlantic |
— |
0 |
2 |
4 |
— |
8 |
23 |
46 |
616 |
717 |
— |
1 |
9 |
67 |
90 |
|
New Jersey |
— |
0 |
0 |
— |
— |
— |
7 |
19 |
217 |
284 |
— |
0 |
4 |
19 |
26 |
|
New York (Upstate) |
— |
0 |
1 |
1 |
— |
N |
0 |
0 |
N |
N |
— |
0 |
5 |
30 |
35 |
|
New York City |
— |
0 |
1 |
1 |
— |
— |
0 |
0 |
— |
— |
— |
0 |
2 |
6 |
17 |
|
Pennsylvania |
— |
0 |
1 |
2 |
— |
8 |
14 |
28 |
399 |
433 |
— |
0 |
3 |
12 |
12 |
|
E.N. Central |
— |
0 |
1 |
2 |
2 |
12 |
36 |
73 |
984 |
1,143 |
1 |
1 |
3 |
38 |
53 |
|
Illinois |
— |
0 |
1 |
1 |
1 |
— |
8 |
19 |
254 |
278 |
— |
0 |
2 |
15 |
23 |
|
Indiana |
— |
0 |
0 |
— |
— |
— |
3 |
9 |
116 |
108 |
— |
0 |
2 |
4 |
3 |
|
Michigan |
— |
0 |
0 |
— |
— |
— |
10 |
36 |
286 |
300 |
— |
0 |
2 |
7 |
9 |
|
Ohio |
— |
0 |
1 |
1 |
1 |
12 |
8 |
21 |
290 |
260 |
1 |
0 |
2 |
7 |
11 |
|
Wisconsin |
— |
0 |
1 |
— |
— |
— |
2 |
13 |
38 |
197 |
— |
0 |
1 |
5 |
7 |
|
W.N. Central |
— |
0 |
0 |
— |
2 |
3 |
12 |
32 |
344 |
559 |
— |
0 |
2 |
8 |
23 |
|
Iowa |
— |
0 |
0 |
— |
— |
N |
0 |
0 |
N |
N |
N |
0 |
0 |
N |
N |
|
Kansas |
— |
0 |
0 |
— |
— |
— |
0 |
12 |
— |
147 |
— |
0 |
2 |
2 |
4 |
|
Minnesota |
— |
0 |
0 |
— |
— |
— |
6 |
13 |
183 |
230 |
— |
0 |
1 |
— |
14 |
|
Missouri |
— |
0 |
0 |
— |
1 |
3 |
2 |
15 |
83 |
113 |
— |
0 |
1 |
— |
4 |
|
Nebraska |
— |
0 |
0 |
— |
— |
— |
0 |
3 |
23 |
15 |
— |
0 |
1 |
1 |
— |
|
North Dakota |
— |
0 |
0 |
— |
— |
— |
0 |
5 |
30 |
34 |
— |
0 |
1 |
1 |
1 |
|
South Dakota |
— |
0 |
0 |
— |
1 |
— |
0 |
4 |
25 |
20 |
— |
0 |
1 |
4 |
— |
|
S. Atlantic |
— |
0 |
1 |
5 |
5 |
17 |
27 |
54 |
858 |
1,091 |
7 |
7 |
21 |
230 |
222 |
|
Delaware |
— |
0 |
0 |
— |
— |
— |
0 |
2 |
7 |
15 |
— |
0 |
2 |
7 |
5 |
|
District of Columbia |
— |
0 |
0 |
— |
— |
— |
0 |
2 |
7 |
19 |
— |
0 |
0 |
— |
— |
|
Florida |
— |
0 |
1 |
3 |
2 |
13 |
15 |
39 |
536 |
509 |
4 |
4 |
10 |
124 |
132 |
|
Georgia |
— |
0 |
0 |
— |
— |
— |
2 |
8 |
96 |
120 |
— |
0 |
2 |
14 |
17 |
|
Maryland |
— |
0 |
1 |
1 |
— |
N |
0 |
0 |
N |
N |
2 |
0 |
6 |
43 |
20 |
|
North Carolina |
— |
0 |
1 |
— |
2 |
N |
0 |
0 |
N |
N |
— |
0 |
6 |
8 |
14 |
|
South Carolina |
— |
0 |
0 |
— |
1 |
1 |
2 |
13 |
43 |
128 |
— |
0 |
3 |
6 |
6 |
|
Virginia |
— |
0 |
1 |
1 |
— |
3 |
6 |
12 |
164 |
222 |
1 |
0 |
4 |
28 |
26 |
|
West Virginia |
— |
0 |
0 |
— |
— |
— |
0 |
8 |
5 |
78 |
— |
0 |
0 |
— |
2 |
|
E.S. Central |
1 |
0 |
1 |
5 |
1 |
— |
2 |
8 |
71 |
133 |
— |
1 |
4 |
36 |
32 |
|
Alabama |
— |
0 |
1 |
1 |
1 |
— |
2 |
7 |
65 |
123 |
— |
0 |
4 |
17 |
12 |
|
Kentucky |
1 |
0 |
1 |
2 |
— |
N |
0 |
0 |
N |
N |
— |
0 |
1 |
4 |
3 |
|
Mississippi |
— |
0 |
1 |
1 |
— |
— |
0 |
2 |
6 |
10 |
— |
0 |
1 |
5 |
12 |
|
Tennessee |
— |
0 |
1 |
1 |
— |
N |
0 |
0 |
N |
N |
— |
0 |
2 |
10 |
5 |
|
W.S. Central |
— |
0 |
1 |
3 |
2 |
16 |
31 |
80 |
895 |
1,106 |
— |
2 |
11 |
63 |
114 |
|
Arkansas |
— |
0 |
0 |
— |
— |
3 |
3 |
23 |
84 |
102 |
— |
0 |
1 |
2 |
2 |
|
Louisiana |
— |
0 |
0 |
— |
1 |
— |
1 |
21 |
26 |
56 |
— |
0 |
2 |
13 |
41 |
|
Oklahoma |
— |
0 |
1 |
1 |
— |
N |
0 |
0 |
N |
N |
— |
0 |
1 |
1 |
3 |
|
Texas |
— |
0 |
1 |
2 |
1 |
13 |
23 |
79 |
785 |
948 |
— |
1 |
9 |
47 |
68 |
|
Mountain |
— |
0 |
1 |
1 |
3 |
4 |
16 |
35 |
450 |
639 |
1 |
0 |
7 |
21 |
38 |
|
Arizona |
— |
0 |
1 |
1 |
1 |
3 |
5 |
18 |
177 |
164 |
1 |
0 |
6 |
11 |
20 |
|
Colorado |
— |
0 |
0 |
— |
2 |
— |
0 |
12 |
43 |
212 |
— |
0 |
1 |
— |
7 |
|
Idaho |
— |
0 |
0 |
— |
— |
N |
0 |
0 |
N |
N |
N |
0 |
0 |
N |
N |
|
Montana |
— |
0 |
0 |
— |
— |
— |
1 |
5 |
45 |
104 |
— |
0 |
1 |
2 |
— |
|
Nevada |
— |
0 |
0 |
— |
— |
N |
0 |
0 |
N |
N |
— |
0 |
1 |
1 |
3 |
|
New Mexico |
— |
0 |
1 |
— |
— |
— |
1 |
5 |
31 |
33 |
— |
0 |
0 |
— |
— |
|
Utah |
— |
0 |
0 |
— |
— |
1 |
4 |
18 |
150 |
120 |
— |
0 |
1 |
7 |
8 |
|
Wyoming |
— |
0 |
0 |
— |
— |
— |
0 |
3 |
4 |
6 |
— |
0 |
0 |
— |
— |
|
Pacific |
— |
0 |
1 |
2 |
2 |
— |
2 |
9 |
57 |
116 |
4 |
3 |
68 |
120 |
223 |
|
Alaska |
— |
0 |
1 |
1 |
— |
— |
0 |
4 |
15 |
32 |
2 |
0 |
1 |
5 |
2 |
|
California |
— |
0 |
1 |
1 |
2 |
— |
1 |
4 |
22 |
42 |
— |
2 |
10 |
51 |
174 |
|
Hawaii |
— |
0 |
0 |
— |
— |
— |
1 |
5 |
20 |
42 |
— |
0 |
3 |
17 |
28 |
|
Oregon |
— |
0 |
1 |
— |
— |
N |
0 |
0 |
N |
N |
2 |
0 |
3 |
18 |
19 |
|
Washington |
— |
0 |
0 |
— |
— |
N |
0 |
0 |
N |
N |
— |
0 |
68 |
29 |
— |
|
Territories |
|||||||||||||||
|
American Samoa |
— |
0 |
0 |
— |
— |
N |
0 |
0 |
N |
N |
N |
0 |
0 |
N |
N |
|
C.N.M.I. |
— |
— |
— |
— |
— |
— |
— |
— |
— |
— |
— |
— |
— |
— |
— |
|
Guam |
— |
0 |
0 |
— |
— |
— |
0 |
0 |
— |
29 |
— |
0 |
0 |
— |
— |
|
Puerto Rico |
— |
0 |
0 |
— |
1 |
— |
1 |
6 |
40 |
82 |
— |
0 |
0 |
— |
— |
|
U.S. Virgin Islands |
— |
0 |
0 |
— |
— |
— |
0 |
0 |
— |
— |
— |
0 |
0 |
— |
— |
|
C.N.M.I.: Commonwealth of Northern Mariana Islands. U: Unavailable. —: No reported cases. N: Not reportable. NN: Not Nationally Notifiable. NP: Nationally notifiable but not published. Cum: Cumulative year-to-date counts. Med: Median. Max: Maximum. * Three low incidence conditions, rubella, rubella congenital, and tetanus, are in Table II to facilitate case count verification with reporting jurisdictions. † Case counts for reporting year 2015 and 2016 are provisional and subject to change. For further information on interpretation of these data, see http://wwwn.cdc.gov/nndss/document/ProvisionalNationaNotifiableDiseasesSurveillanceData20100927.pdfCdc-pdf. Data for TB are displayed in Table IV, which appears quarterly. § Any species of the family Vibrionaceae, other than toxigenic Vibrio cholerae O1 or O139. |
|||||||||||||||
|
TABLE II. (Continued) Provisional cases of selected notifiable diseases (≥1,000 cases reported during the preceding year), and selected* low frequency diseases, United States and U.S. territories, weeks ending September 3, 2016, and September 5, 2015 (35th week)† (Export data) |
||||||||||
|
Reporting area |
West Nile virus disease§ |
|||||||||
|
Neuroinvasive |
Nonneuroinvasive¶ |
|||||||||
|
Current week |
Previous 52 weeks |
Cum 2016 |
Cum 2015 |
Current week |
Previous 52 weeks |
Cum 2016 |
Cum 2015 |
|||
|
Med |
Max |
Med |
Max |
|||||||
|
United States |
— |
2 |
160 |
271 |
829 |
— |
3 |
89 |
284 |
500 |
|
New England |
— |
0 |
3 |
4 |
6 |
— |
0 |
2 |
— |
3 |
|
Connecticut |
— |
0 |
2 |
1 |
3 |
— |
0 |
1 |
— |
2 |
|
Maine |
— |
0 |
1 |
— |
1 |
— |
0 |
0 |
— |
— |
|
Massachusetts |
— |
0 |
2 |
1 |
2 |
— |
0 |
2 |
— |
1 |
|
New Hampshire |
— |
0 |
0 |
— |
— |
— |
0 |
0 |
— |
— |
|
Rhode Island |
— |
0 |
0 |
— |
— |
— |
0 |
0 |
— |
— |
|
Vermont |
— |
0 |
1 |
2 |
— |
— |
0 |
0 |
— |
— |
|
Mid. Atlantic |
— |
0 |
14 |
4 |
43 |
— |
0 |
5 |
2 |
24 |
|
New Jersey |
— |
0 |
5 |
1 |
13 |
— |
0 |
1 |
— |
3 |
|
New York (Upstate) |
— |
0 |
3 |
— |
6 |
— |
0 |
1 |
— |
4 |
|
New York City |
— |
0 |
7 |
— |
13 |
— |
0 |
2 |
— |
6 |
|
Pennsylvania |
— |
0 |
2 |
3 |
11 |
— |
0 |
2 |
2 |
11 |
|
E.N. Central |
— |
0 |
23 |
11 |
75 |
— |
0 |
8 |
13 |
30 |
|
Illinois |
— |
0 |
13 |
— |
34 |
— |
0 |
6 |
10 |
14 |
|
Indiana |
— |
0 |
3 |
1 |
10 |
— |
0 |
1 |
— |
4 |
|
Michigan |
— |
0 |
4 |
7 |
11 |
— |
0 |
1 |
— |
1 |
|
Ohio |
— |
0 |
2 |
1 |
17 |
— |
0 |
2 |
3 |
8 |
|
Wisconsin |
— |
0 |
3 |
2 |
3 |
— |
0 |
0 |
— |
3 |
|
W.N. Central |
— |
0 |
11 |
38 |
56 |
— |
0 |
24 |
134 |
102 |
|
Iowa |
— |
0 |
1 |
2 |
2 |
— |
0 |
1 |
— |
6 |
|
Kansas |
— |
0 |
3 |
6 |
8 |
— |
0 |
5 |
4 |
15 |
|
Minnesota |
— |
0 |
3 |
8 |
2 |
— |
0 |
5 |
16 |
6 |
|
Missouri |
— |
0 |
3 |
— |
16 |
— |
0 |
1 |
1 |
3 |
|
Nebraska |
— |
0 |
3 |
9 |
13 |
— |
0 |
5 |
27 |
36 |
|
North Dakota |
— |
0 |
3 |
1 |
7 |
— |
0 |
3 |
10 |
12 |
|
South Dakota |
— |
0 |
3 |
12 |
8 |
— |
0 |
14 |
76 |
24 |
|
S. Atlantic |
— |
0 |
10 |
7 |
49 |
— |
0 |
6 |
— |
24 |
|
Delaware |
— |
0 |
0 |
— |
— |
— |
0 |
1 |
— |
5 |
|
District of Columbia |
— |
0 |
1 |
1 |
1 |
— |
0 |
2 |
— |
— |
|
Florida |
— |
0 |
3 |
4 |
7 |
— |
0 |
1 |
— |
— |
|
Georgia |
— |
0 |
4 |
— |
10 |
— |
0 |
0 |
— |
2 |
|
Maryland |
— |
0 |
5 |
1 |
21 |
— |
0 |
2 |
— |
11 |
|
North Carolina |
— |
0 |
1 |
— |
3 |
— |
0 |
0 |
— |
— |
|
South Carolina |
— |
0 |
0 |
— |
— |
— |
0 |
0 |
— |
— |
|
Virginia |
— |
0 |
4 |
1 |
7 |
— |
0 |
2 |
— |
6 |
|
West Virginia |
— |
0 |
0 |
— |
— |
— |
0 |
0 |
— |
— |
|
E.S. Central |
— |
0 |
4 |
18 |
26 |
— |
0 |
3 |
9 |
14 |
|
Alabama |
— |
0 |
2 |
3 |
4 |
— |
0 |
2 |
2 |
4 |
|
Kentucky |
— |
0 |
1 |
— |
— |
— |
0 |
0 |
— |
1 |
|
Mississippi |
— |
0 |
4 |
14 |
19 |
— |
0 |
3 |
6 |
8 |
|
Tennessee |
— |
0 |
2 |
1 |
3 |
— |
0 |
1 |
1 |
1 |
|
W.S. Central |
— |
0 |
30 |
70 |
203 |
— |
0 |
18 |
46 |
98 |
|
Arkansas |
— |
0 |
2 |
1 |
13 |
— |
0 |
1 |
1 |
2 |
|
Louisiana |
— |
0 |
5 |
— |
30 |
— |
0 |
2 |
1 |
7 |
|
Oklahoma |
— |
0 |
8 |
3 |
27 |
— |
0 |
5 |
3 |
31 |
|
Texas |
— |
0 |
22 |
66 |
133 |
— |
0 |
13 |
41 |
58 |
|
Mountain |
— |
0 |
15 |
61 |
132 |
— |
0 |
17 |
57 |
83 |
|
Arizona |
— |
0 |
5 |
25 |
59 |
— |
0 |
4 |
13 |
28 |
|
Colorado |
— |
0 |
6 |
24 |
46 |
— |
0 |
11 |
37 |
37 |
|
Idaho |
— |
0 |
1 |
1 |
5 |
— |
0 |
3 |
4 |
7 |
|
Montana |
— |
0 |
1 |
1 |
3 |
— |
0 |
1 |
2 |
— |
|
Nevada |
— |
0 |
3 |
5 |
4 |
— |
0 |
2 |
— |
3 |
|
New Mexico |
— |
0 |
2 |
1 |
8 |
— |
0 |
1 |
— |
1 |
|
Utah |
— |
0 |
2 |
3 |
4 |
— |
0 |
2 |
1 |
2 |
|
Wyoming |
— |
0 |
1 |
1 |
3 |
— |
0 |
0 |
— |
5 |
|
Pacific |
— |
0 |
57 |
58 |
239 |
— |
0 |
23 |
23 |
122 |
|
Alaska |
— |
0 |
0 |
— |
— |
— |
0 |
0 |
— |
— |
|
California |
— |
0 |
57 |
55 |
233 |
— |
0 |
23 |
23 |
106 |
|
Hawaii |
— |
0 |
0 |
— |
— |
— |
0 |
0 |
— |
— |
|
Oregon |
— |
0 |
0 |
— |
— |
— |
0 |
0 |
— |
1 |
|
Washington |
— |
0 |
1 |
3 |
6 |
— |
0 |
1 |
— |
15 |
|
Territories |
||||||||||
|
American Samoa |
— |
0 |
0 |
— |
— |
— |
0 |
0 |
— |
— |
|
C.N.M.I. |
— |
— |
— |
— |
— |
— |
— |
— |
— |
— |
|
Guam |
— |
0 |
0 |
— |
— |
— |
0 |
0 |
— |
— |
|
Puerto Rico |
— |
0 |
0 |
— |
— |
— |
0 |
0 |
— |
— |
|
U.S. Virgin Islands |
— |
0 |
0 |
— |
— |
— |
0 |
0 |
— |
— |
|
C.N.M.I.: Commonwealth of Northern Mariana Islands. U: Unavailable. —: No reported cases. N: Not reportable. NN: Not Nationally Notifiable. NP: Nationally notifiable but not published. Cum: Cumulative year-to-date counts. Med: Median. Max: Maximum. * Three low incidence conditions, rubella, rubella congenital, and tetanus, are in Table II to facilitate case count verification with reporting jurisdictions. † Case counts for reporting year 2015 and 2016 are provisional and subject to change. For further information on interpretation of these data, see http://wwwn.cdc.gov/nndss/document/ProvisionalNationaNotifiableDiseasesSurveillanceData20100927.pdfCdc-pdf. Data for TB are displayed in Table IV, which appears quarterly. § Updated weekly from the Division of Vector-Borne Diseases, National Center for Emerging and Zoonotic Infectious Diseases (ArboNET Surveillance). Data for Jamestown Canyon virus, La Crosse virus, Chikungunya virus, Eastern equine encephalitis virus, Powassan virus, St. Louis virus, and Western equine encephalitis virus diseases are available in Table I. ¶ Not reportable in all states. Reporting exceptions are available at http://wwwn.cdc.gov/nndss/downloads.html. |
||||||||||
|
TABLE III. Deaths in 122 U.S. cities,* week ending September 3, 2016 (35th week) (Export data) |
|||||||||||||||||
|
Reporting area |
All causes, by age (years) |
P&I† Total |
Reporting area (Continued) |
All causes, by age (years) |
P&I† Total |
||||||||||||
|
All Ages |
≥65 |
45–64 |
25–44 |
1–24 |
<1 |
All Ages |
≥65 |
45–64 |
25–44 |
1–24 |
<1 |
||||||
|
New England |
471 |
330 |
103 |
22 |
12 |
4 |
39 |
|
|
S. Atlantic |
915 |
579 |
224 |
71 |
25 |
15 |
44 |
|
Boston, MA |
139 |
91 |
35 |
7 |
5 |
1 |
13 |
|
|
Atlanta, GA |
159 |
99 |
40 |
16 |
1 |
3 |
7 |
|
Bridgeport, CT |
15 |
12 |
3 |
— |
— |
— |
3 |
|
|
Baltimore, MD |
188 |
108 |
52 |
14 |
12 |
1 |
8 |
|
Cambridge, MA |
11 |
9 |
2 |
— |
— |
— |
1 |
|
|
Charlotte, NC |
134 |
86 |
29 |
11 |
5 |
3 |
4 |
|
Fall River, MA |
22 |
19 |
2 |
— |
1 |
— |
3 |
|
|
Jacksonville, FL |
140 |
87 |
38 |
9 |
3 |
3 |
9 |
|
Hartford, CT |
48 |
31 |
14 |
2 |
1 |
— |
4 |
|
|
Miami, FL |
37 |
28 |
6 |
3 |
— |
— |
1 |
|
Lowell, MA |
22 |
22 |
— |
— |
— |
— |
1 |
|
|
Norfolk, VA |
35 |
22 |
8 |
2 |
3 |
— |
— |
|
Lynn, MA |
10 |
4 |
4 |
2 |
— |
— |
— |
|
|
Richmond, VA |
41 |
27 |
11 |
3 |
— |
— |
2 |
|
New Bedford, MA |
25 |
18 |
5 |
1 |
1 |
— |
2 |
|
|
Savannah, GA |
27 |
13 |
8 |
5 |
— |
1 |
1 |
|
New Haven, CT |
U |
U |
U |
U |
U |
U |
U |
|
|
St. Petersburg, FL |
45 |
27 |
14 |
1 |
— |
3 |
3 |
|
Providence, RI |
70 |
42 |
18 |
8 |
— |
2 |
2 |
|
|
Tampa, FL |
91 |
66 |
17 |
6 |
1 |
1 |
6 |
|
Somerville, MA |
3 |
3 |
— |
— |
— |
— |
— |
|
|
Washington, D.C. |
U |
U |
U |
U |
U |
U |
U |
|
Springfield, MA |
29 |
19 |
7 |
1 |
2 |
— |
— |
|
|
Wilmington, DE |
18 |
16 |
1 |
1 |
— |
— |
3 |
|
Waterbury, CT |
31 |
25 |
6 |
— |
— |
— |
— |
|
|
E.S. Central |
988 |
600 |
266 |
81 |
20 |
21 |
37 |
|
Worcester, MA |
46 |
35 |
7 |
1 |
2 |
1 |
10 |
|
|
Birmingham, AL |
177 |
106 |
50 |
16 |
3 |
2 |
11 |
|
Mid. Atlantic |
1,733 |
1,227 |
363 |
109 |
17 |
17 |
65 |
|
|
Chattanooga, TN |
101 |
71 |
24 |
4 |
1 |
1 |
4 |
|
Albany, NY |
57 |
44 |
8 |
5 |
— |
— |
3 |
|
|
Knoxville, TN |
114 |
72 |
30 |
7 |
2 |
3 |
6 |
|
Allentown, PA |
26 |
23 |
3 |
— |
— |
— |
— |
|
|
Lexington, KY |
142 |
76 |
36 |
19 |
6 |
5 |
2 |
|
Buffalo, NY |
260 |
171 |
65 |
17 |
3 |
4 |
29 |
|
|
Memphis, TN |
166 |
103 |
42 |
16 |
2 |
3 |
5 |
|
Camden, NJ |
34 |
15 |
11 |
6 |
2 |
— |
— |
|
|
Mobile, AL |
86 |
50 |
26 |
5 |
2 |
3 |
5 |
|
Elizabeth, NJ |
17 |
14 |
2 |
1 |
— |
— |
— |
|
|
Montgomery, AL |
35 |
24 |
9 |
2 |
— |
— |
— |
|
Erie, PA |
40 |
30 |
4 |
5 |
1 |
— |
— |
|
|
Nashville, TN |
167 |
98 |
49 |
12 |
4 |
4 |
4 |
|
Jersey City, NJ |
16 |
12 |
2 |
1 |
— |
1 |
— |
|
|
W.S. Central |
1,628 |
1,033 |
399 |
119 |
42 |
35 |
81 |
|
New York City, NY |
919 |
647 |
199 |
56 |
8 |
9 |
20 |
|
|
Austin, TX |
87 |
56 |
20 |
9 |
— |
2 |
5 |
|
Newark, NJ |
21 |
12 |
7 |
2 |
— |
— |
— |
|
|
Baton Rouge, LA |
119 |
83 |
28 |
6 |
1 |
1 |
3 |
|
Paterson, NJ |
14 |
9 |
2 |
2 |
1 |
— |
1 |
|
|
Corpus Christi, TX |
54 |
36 |
13 |
3 |
— |
2 |
4 |
|
Philadelphia, PA |
U |
U |
U |
U |
U |
U |
U |
|
|
Dallas, TX |
214 |
112 |
66 |
25 |
6 |
5 |
8 |
|
Pittsburgh, PA |
U |
U |
U |
U |
U |
U |
U |
|
|
El Paso, TX |
68 |
46 |
14 |
6 |
— |
2 |
1 |
|
Reading, PA |
35 |
24 |
6 |
3 |
1 |
1 |
— |
|
|
Fort Worth, TX |
U |
U |
U |
U |
U |
U |
U |
|
Rochester, NY |
150 |
114 |
25 |
8 |
1 |
2 |
9 |
|
|
Houston, TX |
473 |
304 |
114 |
29 |
17 |
9 |
27 |
|
Schenectady, NY |
23 |
20 |
2 |
1 |
— |
— |
1 |
|
|
Little Rock, AR |
102 |
63 |
28 |
5 |
3 |
3 |
10 |
|
Scranton, PA |
20 |
14 |
6 |
— |
— |
— |
— |
|
|
New Orleans, LA |
39 |
29 |
6 |
2 |
1 |
1 |
— |
|
Syracuse, NY |
47 |
37 |
9 |
1 |
— |
— |
1 |
|
|
San Antonio, TX |
279 |
176 |
67 |
20 |
6 |
10 |
10 |
|
Trenton, NJ |
12 |
6 |
5 |
1 |
— |
— |
1 |
|
|
Shreveport, LA |
78 |
46 |
20 |
8 |
4 |
— |
5 |
|
Utica, NY |
22 |
15 |
7 |
— |
— |
— |
— |
|
|
Tulsa, OK |
115 |
82 |
23 |
6 |
4 |
— |
8 |
|
Yonkers, NY |
20 |
20 |
— |
— |
— |
— |
— |
|
|
Mountain |
905 |
615 |
185 |
76 |
18 |
11 |
38 |
|
E.N. Central |
1,758 |
1,158 |
387 |
126 |
62 |
25 |
88 |
|
|
Albuquerque, NM |
129 |
90 |
28 |
9 |
2 |
— |
4 |
|
Akron, OH |
50 |
29 |
11 |
8 |
2 |
— |
2 |
|
|
Boise, ID |
43 |
32 |
4 |
5 |
1 |
1 |
1 |
|
Canton, OH |
23 |
13 |
4 |
5 |
1 |
— |
1 |
|
|
Colorado Springs, CO |
27 |
23 |
3 |
1 |
— |
— |
4 |
|
Chicago, IL |
262 |
169 |
61 |
16 |
14 |
2 |
19 |
|
|
Denver, CO |
U |
U |
U |
U |
U |
U |
U |
|
Cincinnati, OH |
65 |
36 |
17 |
6 |
3 |
3 |
1 |
|
|
Las Vegas, NV |
306 |
217 |
55 |
26 |
5 |
3 |
14 |
|
Cleveland, OH |
315 |
241 |
51 |
16 |
4 |
3 |
9 |
|
|
Ogden, UT |
35 |
26 |
4 |
4 |
1 |
— |
3 |
|
Columbus, OH |
U |
U |
U |
U |
U |
U |
U |
|
|
Phoenix, AZ |
187 |
102 |
50 |
21 |
7 |
7 |
2 |
|
Dayton, OH |
124 |
94 |
20 |
5 |
3 |
2 |
8 |
|
|
Pueblo, CO |
9 |
6 |
3 |
— |
— |
— |
— |
|
Detroit, MI |
149 |
67 |
58 |
11 |
10 |
3 |
5 |
|
|
Salt Lake City, UT |
U |
U |
U |
U |
U |
U |
U |
|
Evansville, IN |
40 |
30 |
8 |
2 |
— |
— |
3 |
|
|
Tucson, AZ |
169 |
119 |
38 |
10 |
2 |
— |
10 |
|
Fort Wayne, IN |
91 |
65 |
18 |
6 |
1 |
1 |
2 |
|
|
Pacific |
1,649 |
1,136 |
365 |
85 |
32 |
30 |
116 |
|
Gary, IN |
7 |
3 |
3 |
1 |
— |
— |
— |
|
|
Berkeley, CA |
12 |
8 |
2 |
2 |
— |
— |
1 |
|
Grand Rapids, MI |
60 |
37 |
16 |
3 |
2 |
2 |
4 |
|
|
Fresno, CA |
122 |
79 |
29 |
7 |
4 |
3 |
9 |
|
Indianapolis, IN |
187 |
114 |
51 |
11 |
8 |
3 |
14 |
|
|
Glendale, CA |
24 |
22 |
2 |
— |
— |
— |
1 |
|
Lansing, MI |
50 |
33 |
9 |
5 |
2 |
1 |
6 |
|
|
Honolulu, HI |
85 |
67 |
16 |
1 |
1 |
— |
12 |
|
Milwaukee, WI |
65 |
35 |
15 |
7 |
8 |
— |
— |
|
|
Long Beach, CA |
72 |
43 |
23 |
4 |
1 |
1 |
9 |
|
Peoria, IL |
U |
U |
U |
U |
U |
U |
U |
|
|
Los Angeles, CA |
238 |
146 |
63 |
17 |
8 |
4 |
21 |
|
Rockford, IL |
57 |
40 |
10 |
4 |
2 |
1 |
2 |
|
|
Pasadena, CA |
30 |
23 |
5 |
1 |
— |
1 |
3 |
|
South Bend, IN |
46 |
35 |
7 |
4 |
— |
— |
2 |
|
|
Portland, OR |
109 |
76 |
23 |
5 |
4 |
1 |
4 |
|
Toledo, OH |
108 |
71 |
21 |
11 |
1 |
4 |
7 |
|
|
Sacramento, CA |
249 |
171 |
56 |
15 |
3 |
4 |
12 |
|
Youngstown, OH |
59 |
46 |
7 |
5 |
1 |
— |
3 |
|
|
San Diego, CA |
167 |
119 |
31 |
8 |
2 |
6 |
9 |
|
W.N. Central |
510 |
340 |
120 |
28 |
10 |
11 |
40 |
|
|
San Francisco, CA |
113 |
83 |
24 |
4 |
1 |
1 |
11 |
|
Des Moines, IA |
— |
— |
— |
— |
— |
— |
— |
|
|
San Jose, CA |
196 |
138 |
41 |
7 |
5 |
5 |
11 |
|
Duluth, MN |
37 |
28 |
7 |
2 |
— |
— |
4 |
|
|
Santa Cruz, CA |
33 |
24 |
6 |
2 |
1 |
— |
— |
|
Kansas City, KS |
14 |
7 |
5 |
1 |
— |
1 |
1 |
|
|
Seattle, WA |
U |
U |
U |
U |
U |
U |
U |
|
Kansas City, MO |
62 |
42 |
13 |
4 |
2 |
1 |
1 |
|
|
Spokane, WA |
63 |
43 |
17 |
1 |
— |
2 |
3 |
|
Lincoln, NE |
45 |
36 |
9 |
— |
— |
— |
6 |
|
|
Tacoma, WA |
136 |
94 |
27 |
11 |
2 |
2 |
10 |
|
Minneapolis, MN |
55 |
33 |
15 |
2 |
2 |
3 |
7 |
|
|
Total§ |
10,557 |
7,018 |
2,412 |
717 |
238 |
169 |
548 |
|
Omaha, NE |
101 |
73 |
22 |
3 |
1 |
2 |
7 |
|
|
|
|
|
|
|
|
|
|
|
St. Louis, MO |
67 |
35 |
22 |
5 |
3 |
1 |
5 |
|
|
|
|
|
|
|
|
||
|
St. Paul, MN |
57 |
44 |
9 |
3 |
— |
1 |
3 |
|
|
|
|
|
|
|
|
||
|
Wichita, KS |
72 |
42 |
18 |
8 |
2 |
2 |
6 |
|
|
|
|
|
|
|
|
||
|
U: Unavailable. —: No reported cases. * Mortality data in this table are voluntarily reported from 122 cities in the United States, most of which have populations of >100,000. A death is reported by the place of its occurrence and by the week that the death certificate was filed. Fetal deaths are not included. † Pneumonia and influenza. § Total includes unknown ages. |
|||||||||||||||||
MMWR and Morbidity and Mortality Weekly Report are service marks of the U.S. Department of Health and Human Services.
Use of trade names and commercial sources is for identification only and does not imply endorsement by the U.S. Department of
Health and Human Services.
References to non-CDC sites on the Internet are
provided as a service to MMWR readers and do not constitute or imply
endorsement of these organizations or their programs by CDC or the U.S.
Department of Health and Human Services. CDC is not responsible for the content
of pages found at these sites. URL addresses listed in MMWR were current as of
the date of publication.
All HTML versions of MMWR articles are generated from final proofs through an automated process. This conversion might result in character translation or format errors in the HTML version. Users are referred to the electronic PDF version (https://www.cdc.gov/mmwr) and/or the original MMWR paper copy for printable versions of official text, figures, and tables.
Questions or messages regarding errors in formatting should be addressed to mmwrq@cdc.gov.