|
|
|
|
|
|
|
|
|
|
|
|
|
|
|
|
|
||||
| ||||||||||
|
|
|
|
|
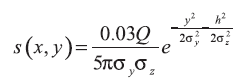
Persons using assistive technology might not be able to fully access information in this file. For assistance, please send e-mail to: mmwrq@cdc.gov. Type 508 Accommodation and the title of the report in the subject line of e-mail. Simulation and Other Evaluation ApproachesSimulation for Assessing Statistical Methods of Biologic Terrorism SurveillanceKen P. Kleinman,1 A. Abrams,1 K. Mandl,2 R. Platt1,3 1Harvard Medical School, Harvard Pilgrim Health Care, and CDC Eastern Massachusetts Prevention Epicenter and HMO Research Network Center for Education and Research in Therapeutics, Boston, Massachusetts; 2Children's Hospital Boston, Boston, Massachusetts, and Harvard Medical School, Boston, Massachusetts; 3Brigham and Women's Hospital, Harvard Medical School, Boston, Massachusetts Corresponding author: Ken P. Kleinman, Harvard Medical School, Department of Ambulatory Care and Prevention, 133 Brookline Ave., 6th Floor, Boston, MA 02215. Telephone: 617-509-9935; Fax: 617-859-8112; E-mail: ken_kleinman@harvardpilgrim.org. Disclosure of relationship: The contributors of this report have disclosed that they have no financial interest, relationship, affiliation, or other association with any organization that might represent a conflict of interest. In addition, this report does not contain any discussion of unlabeled use of commercial products or products for investigational use. AbstractIntroduction: Multiple systems have been developed that use surveillance of health-care encounters to provide early warning of a terrorist attack. Limited practical experience and the absence of adequate theoretical assessments have precluded determining which alarm-generating algorithms should be preferred. In the absence of practical and theoretical results, choosing a particular statistical algorithm can be difficult. One way to evaluate algorithms is through simulation. Objectives: This report describes conceptual features of an example simulation based on the dispersal of anthrax spores and presents results based on the example simulation. Methods: A simulation was implemented based on the dispersal of anthrax spores from a crop-dusting plane. Simulated cases were then included into an observed data stream. Detection approaches included SaTScan™ and small area regression and testing (SMART) scores. An evaluation metric was developed for comparison of results. In addition, a simulation of a separate data stream was added; and then separate and combined surveillance data were compared. Results: In the simulation in which a single data stream was used, the two statistical approaches were substantially similar in performance. The combined surveillance based on two data streams is superior to surveillance based on either stream separately. Conclusion: The other potential uses of such a system are considered. These uses include the comparison of different data sources (e.g., outpatient versus emergency department and evaluating the impact of potential changes to the surveillance system, and increasing the population under surveillance). Simulation is a valuable technique for evaluating and planning for syndromic surveillance. IntroductionSince the attacks on the World Trade Centers on September 11, 2001, increasing attention has been paid to early detection of biologic terrorism attacks (1,2). Assuming biologic agents are not detected directly in the environment, the first indicator of a terrorist attack might be persons becoming ill. Surveillance systems designed to detect increased numbers of ill persons, consistent with exposure to these agents, have been developed (3--7). Key to these systems is the technique used to decide whether "too many" ill persons have been observed. However, despite an increasing number of statistical (8,9) and data mining (5) techniques, limited comparative work has been conducted to assess their relative strengths. Theoretical comparisons are probably not possible in realistic settings, and practical experience is limited by small numbers of attack-like events. Thus, simulation is an important route to evaluation. Unfortunately, most simulations published to date have been too simple for meaningful analysis, except for a previously published analysis of a system generated by an epidemic simulation model (10). The objective of this report is to present a simulation structure developed in the setting of an outpatient surveillance system (11,12). Simulation is only of cases generated by attacks, as opposed to cases arising both from attacks and natural disease. In contrast to the system generated by the epidemic simulation model (10), the outpatient system is simple in that it can be replicated using data likely to be available in many contexts. Thus, the simulation described in this report can be transferred to another data setting with ease. Simulations can be used to determine the cost-benefit ratio of the surveillance system, to compare the relative value of different data sources and other features, and to evaluate statistical methods. Thus, it can be used to help determine the value of syndromic surveillance. MethodsOutpatient Surveillance SystemSimulation was performed by using a surveillance system that relies on data collected as part of outpatient visits near Boston, Massachusetts (11,12). When insured patients visited a clinic, their health-care provider created an electronic medical record. At the close of the visit, the provider entered International Classification of Diseases, Ninth Revision (ICD-9) (13) codes that described the patient's condition. Each outpatient visit was classified into broad groups or syndromes of ICD-9 codes (e.g., lower gastrointestinal or neurologic symptoms). The intended effect of these groupings is that a patient's condition will likely be classified as a given syndrome, despite variability in coding practices among providers. Next, a census location and ZIP code, based on the patient's health maintenance organization record, were attached to the encounter. Finally, for privacy reasons, patient identities were removed and only the number of patients in each geographic region (e.g., census tract or ZIP code) was recorded. The count of each syndrome in each region was used for analysis. For example, the respiratory syndrome includes 171 ICD-9 codes, including those for bronchitis, cough, and pneumonia. This syndrome is of particular interest because a case of inhalational anthrax identified in the prodromal phase would probably receive an ICD-9 code in this group (11). Conceptual SimulationIn concept (Figure 1), the first step of the simulation is to determine who becomes ill. For simulation of an anthrax attack, each person is exposed to a number of spores; this number is a function of the total number of spores released by the terrorist and what proportion of spores fall where the person is located. For each spore to which a person is exposed, a certain probability exists that they will become ill. The second step is to determine when they become ill. The time from infection to initial symptoms is variable. For each simulated infected person, the day on which their symptoms appear must be simulated. This day of initial symptoms depends on the day of the release of spores and on the distribution of symptom onset times. The third step is to determine, among persons eligible for surveillance, the probability of seeking care at a clinic and the time that care was sought. For infected persons who are eligible for surveillance, some probability exists that they will go to the clinic and therefore become part of the observed count for respiratory illness. They also visit the clinic at a simulated time after symptom onset. Implementation of the Conceptual SimulationIn our implementation of the conceptual simulation, anthrax spores were assumed to have been dropped from the height of a crop-dusting plane (14). Exposures occurred only in the ZIP code of residence and to all residents of each ZIP code. Time was treated as discrete in days. These choices make the simulation simpler and mirror the nature of the underlying surveillance system. To approximate the total number of persons living in each area, U.S. Census data were used. Persons in each area were randomly chosen to be included in the surveillance system. Because the exact location of the real persons under surveillance or of the other persons within each area was unknown, locations were chosen for them. Approximately 100 locations were chosen within each ZIP code. The population under surveillance and the remaining persons were distributed among these points equally for the purposes of calculating the number of spores to which persons were exposed. Simulating Illness Whether a simulated person becomes ill depends on how many spores they are exposed to and on the probability that each spore makes them ill. This step is the most complicated part of the simulation. The number of spores that fall over any particular area on the map is a function of multiple parameters. The first parameter is the point from which the dispersal starts. The simulated release could begin at any point on the map. Reasonable distributions across space for this point include a uniform distribution, distributions based on population patterns and wind patterns, and distributions based on perceived levels of surveillance sensitivity. The map was stratified into an urban region around Boston and a suburban region; within each region, release points were generated from a spatially uniform distribution. The spores could all be released at a single point on the map or along a line or curve mimicking a flight path. These cases are described as point-source versus line-source exposure. However, defining a point-source release as a release with length 0 would be more flexible. The length of release could be chosen from any random function with positive value, if one had some reason to expect various lengths. A length of 0 is used in this implementation. Finally, the number of spores falling at a given spot depends on how they fall. In this implementation, the anthrax spores are assumed to fall according to a Gaussian plume (15) function. This process is a flexible function, which defines for a given point downwind the proportion of released spores that will fall at any given spot. This function has been used to describe the concentration of spores in the context of an accidental release of anthrax (14,16). The Guassian plume in its most general form (15) is simplified in this implementation by making constant the breathing rate (an estimated value of 0.03), the windspeed (5 m/sec = 18 kph), and the height above the ground (0), and inserting these values into the general equations. Inserting these constants into the general form generates the simplified function
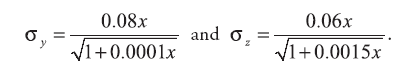
where s(x,y) is the number of spores inhaled by a person x meters downwind and y meters in the crosswind direction from the release point. Q is the number of spores released, and h is the height of the release. Parameters also are available to represent the height of release and the weather conditions. These parameters can be chosen randomly. Instead, for the weather conditions, two different sets of parameters are used: those derived from the accidental release (14,16) and the parameters described as Class A (17). For the Sverdlovsk parameters (14), these are
For the Class A weather patterns (17), they are
The height is set at the height of a typical cropdusting plane, 100 meters (14). The resulting spore distributions are illustrated (Figure 2). The number of spores falling at a given spot depends on how many spores were released. The approximate number of spores of anthrax per kilogram is 1015 (14). Without any specific information regarding the number of spores a terrorist can obtain, almost any positive-value distribution could be used to simulate the number of spores. The implementation described in this report includes 1015 spores. The starting point, length and direction of dispersal, shape, and the number of spores together identify the number of spores that fall at any spot. This calculation was made for each point at which persons are assigned to live. The number of spores a person is exposed to is equal to the number of spores falling at their assigned location. The other component describing the probability that each simulated person becomes ill is the probability of illness per spore. Estimates that result in probabilities of illness per spore ranging from 6.9 × 10⁻⁷ to 1.2 × 10⁻⁴ have been previously described (18). A distribution of probabilities per spore could also be chosen; a rescaled beta distribution might be an appropriate choice in this instance. In addition, the probability of illness might depend on individual characteristics (e.g., age) that are not available in the current application. The anthrax available to terrorists might be less functional than that indicated by the accidental release. Simulations were stratified to include five different values of probability of illness per spore: 10-10, 5 × 10⁻¹⁰, 10-9, 5 × 10⁻⁹, and 10-8. This range was chosen to incorporate both cases in which few and most simulated attacks could be detected. An alternative approach to achieve this goal would be to use the derived probabilities (18) but to reduce the assumed quantity of anthrax spores released. The probability of a person being affected was calculated by using the number of spores and the probability of illness per spore. The probability of illness per spore was treated as independent of the number of spores. The binomial distribution was used to calculate the probability of each person becoming ill as 1- the probability no spore makes them ill = 1 - (1 - probability of illness per spore)number of spores. If data suggested that the probability of illness depended on the number of spores present, this individual-dependent probability could be incorporated. Timing of Illness Patterns exist across the year and weekdays for respiratory syndrome counts (12); a distribution of simulated releases across the calendar needs to be chosen. Some reasonable choices would be uniform across the calendar, uniform within month but different probabilities by month, uniform within weekday but different by day, or some continuous function of the day of the year. The choice could be made to mimic the expected behavior of terrorists. Simulations were stratified by day across the entire calendar, noting that other distributions can be constructed by bootstrap sampling of simulated attacks. The timing of symptom onset has been described previously (19). The log time to onset has an approximately normal distribution, with the mean corresponding to 14.2 days; median, 11.0 days; and standard deviation, 0.713 (log scale). A time of onset was simulated according to this distribution, by using the largest integer included. Timing of Entry into Surveillance System In the evaluation in this report, the number of persons in each ZIP code included in the surveillance system was known. This number could be varied as well (e.g., to allow comparison of different potential systems or of improvements to an extant system). Only those simulated persons eligible for surveillance who become ill and go to the clinic are added to the evaluation data set. Each person can be seen as having some probability for seeking care; this probability might vary according to individual characteristics (e.g., age, sex, and ethnic/cultural background). Obtaining individual characteristics of the patients under surveillance was not possible, so a fixed value of 0.2 was used for the probability of an eligible ill person entering the evaluation data set. This value is derived from the 2001 anthrax release in the United States, when two of the first 10 confirmed case-patients went to their physician before being admitted to the ED (20). Persons might visit the clinic any time after the onset of symptoms. Increasing the probability of a clinic visit as the severity of symptoms increased would be feasible, possibly including probabilities that increase at different rates, depending on individual characteristics. The assumption was made that all patients visited the clinic on the day of symptom onset. Extension to an Additional Data StreamHistorical data are available from a pediatric ED in Boston that also measures the count by ZIP code of respiratory syndrome visits (21,22). Extending the simulation to include simulated visits to the pediatric ED is straightforward. All persons aged <18 years are included in the surveillance; pediatric status was randomly assigned to simulated persons according to the proportion of children reported by the state. Going to the pediatric ED is simulated as a decreasing probability with distance from the facility. One less the inverse normal probability was used with mean 0 and variance 49 (km), implying that a child located 14 km from the pediatric ED had approximately a 2.5% chance of being examined. The day of the pediatric ED visit is simulated as 1 (p = 0.15), 2 (p = 0.55), or 3 (p = 0.30) days after symptom onset. Compared with the first 10 terrorism-related inhalational anthrax cases in 2001, this probability timing structure is generous to the ED; only four of 10 patients contacted the ED within 3 days of symptom onset (20). However, parents might bring children to the ED sooner than an adult would go. Example Evaluation and MetricsFor the outpatient surveillance, two statistical methods were compared: the small area regression and testing (SMART) score and a SaTScan approach (9,23,24). In the SMART score, generalized linear models are used to establish the expected count per ZIP code per day, adjusting for seasonal, weekly, and temporal trends, and holiday status (23). Then, based on the theoretical distribution of case counts and after correcting for multiple testing, the SMART score generates a recurrence interval for each ZIP code each day; the recurrence interval is the length of follow-up required to expect one count as unusual as the observed count. SaTScan identifies unusual clusters of ZIP codes each day (9). Every possible combination of ZIP codes within a circular area around each ZIP code is considered. Each possibility is ranked by likelihood to find the most unusual cluster. Then, a Monte Carlo step determines whether that cluster is unusual in the absolute sense among clusters expected by chance allocation of the cases. This step results in a recurrence interval previously described. The input to the SaTScan is adjusted by using the SMART scores to account for the trends described previously (24). To illustrate the dual-stream outpatient and pediatric ED simulation, only SMART scores were used. Results for the outpatient and pediatric ED data streams are illustrated separately, and the results of a combined surveillance that incorporates signals from each stream are demonstrated. A combined p value is calculated by summing the p value from each stream, squaring the sum, and dividing by two, assuming that the sum is <1 (25). This combined p value was calculated for each ZIP code and converted to a recurrence interval as previously described. The conditional receiver operating characteristic (ROC) curve was developed for use in this evaluation and is introduced in this report. The conditional ROC is defined as the ROC curve with respect to attacks generated by the simulation. The sensitivity, which is the probability of detecting an attack, is calculated as the proportion of simulated attacks detected at a given detection threshold. The probability of a false anthrax alarm is calculated as the proportion of days with alarms at that threshold when a simulated attack was not added. One less this quantity is used as the specificity in the ROC curve. Note that the different sources of information regarding the sensitivity and the specificity make the conditional ROC curve somewhat different from the usual (unconditional) ROC curve. In addition, the proportion of detected events, by day of detection, is illustrated. Detection requires that the signal, which is made up of some set of ZIP codes, includes at least one ZIP code with at least one simulated case. ResultsAn example of the effects of a single simulated release in the outpatient data is illustrated (Figure 3). In this example, the release was in the urban area, the spores had a 10-8 probability of causing illness, and the shape was from the accidental release. Affected ZIP codes indicate no or little response on the day of or day after release, but by day 3 or 4, a noticeable difference was observed between the underlying data and the data with the added cases. The two methods are similar in their diagnostic value with respect to the simulated attacks. The area for the SMART score is 0.93 and for SaTScan, 0.94, which suggests that the SaTScan is slightly superior in this context (Figure 4). With 1,095 total simulations, SaTScan identified 85% of attacks within 9 days, and the SMART score approach identified 83% (Figure 5). SaTScan identified 57% within 4 days, and the SMART score approach identified only 50% in that time frame. The pediatric ED surveillance detects more attacks than the outpatient surveillance for any proportion of false positives (Figure 6). The combined surveillance is slightly better than the pediatric ED. The areas under curves are 0.98, 0.93, and 0.99 for the pediatric ED, outpatient, and combined surveillance, respectively. DiscussionThe results of this report demonstrate how the simulation can be used to compare statistical methods and different data sources. With a focused spore dispersal and a high probability of infection, SMART scores are slightly inferior to SaTScan with respect to detecting anthrax attacks, although both methods perform effectively. Similarly, outpatient surveillance performs slightly less effectively than pediatric ED or combined surveillance (Figure 6). A potential use for the simulation is to assess the value of different levels of coverage in the surveillance system. For example, approximately 10% of residents are included in the outpatient-based surveillance described in this report. Increasing that proportion to determine whether the return would be worth the investment might be possible. Running the simulation with different levels of coverage would allow a comparison to be made. And coverage could be a parameter in the model. As with the ED example, hospital admissions, prescriptions, or over-the-counter pharmaceutical sales could be added. Including them in the simulation would allow comparison of the statistical methods for the multistream surveillance as well as an assessment of their relative utility. Although the variable latency of the disease onset includes times as late as 60 days after exposure, differences in statistical algorithms a substantial period after exposure are not useful; a clinician will generate a laboratorybased diagnosis of anthrax substantially sooner than 60 days after release. The date of clinical detection might be modeled as a probability per patient contact or as an increasing probability with the number of affected persons. The number of ill persons each day was recorded by area through the 10th day; the assumption was that a clinical diagnosis would be initiated by that time. However, the number of ill persons overall were retained from >11 days. ConclusionThis report presented a conceptual discussion and an implementation of simulating an anthrax attack. The simulation will allow various algorithms used to detect such attacks to be compared, which is otherwise difficult. Although the conceptual framework is general, implementation choices can simplify the simulation to suit different purposes (e.g., statistical comparisons or emergency planning). Simulations can be a valuable part of evaluating surveillance systems. They can be used to compute comparisons of statistical and data mining algorithms and can help guide public health officials in evaluating and planning surveillance systems. Acknowledgments The authors thank M. Kulldorff and K. Yih, both of Harvard Medical School and Harvard Pilgrim Health Care, for their comments and insights in the work reported. References
Figure 1  Return to top. Figure 2 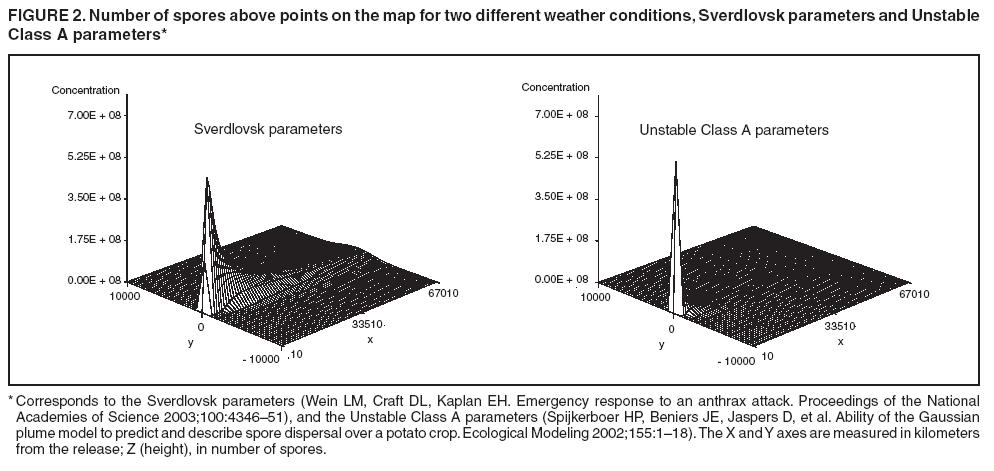 Return to top. Figure 3 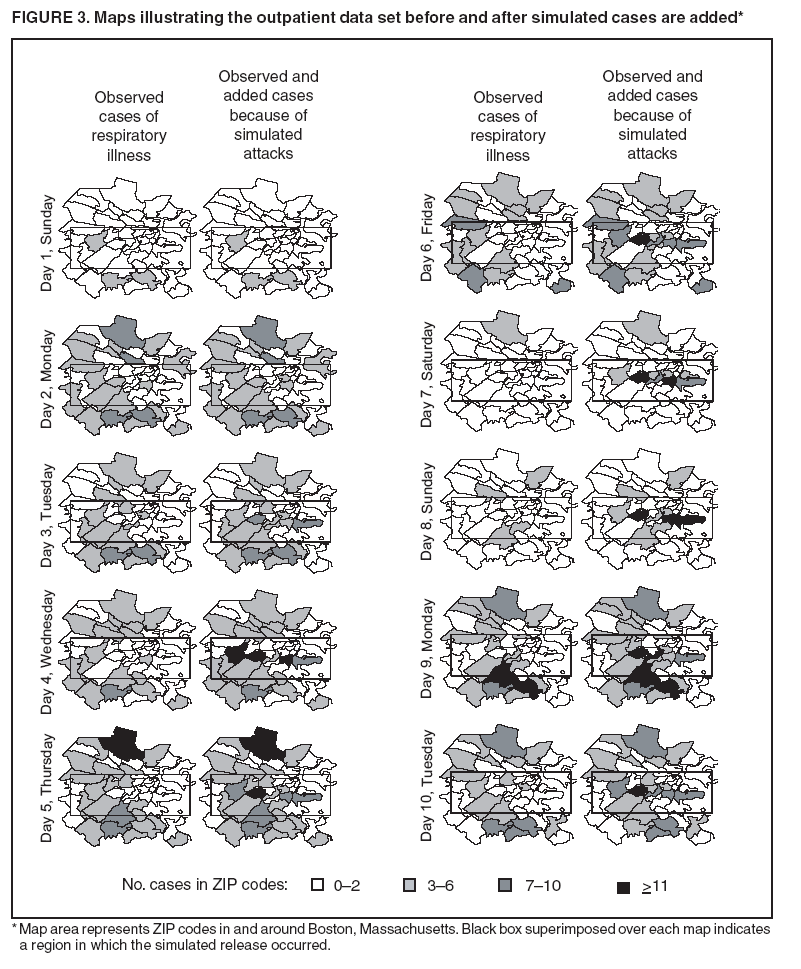 Return to top. Figure 4 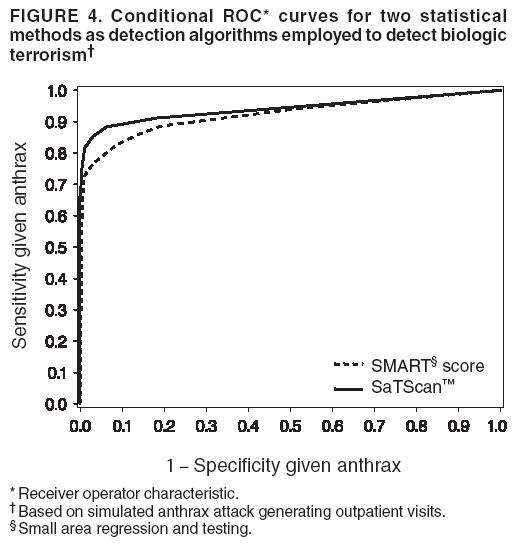 Return to top. Figure 5  Return to top. Figure 6  Return to top.
All MMWR HTML versions of articles are electronic conversions from ASCII text into HTML. This conversion may have resulted in character translation or format errors in the HTML version. Users should not rely on this HTML document, but are referred to the electronic PDF version and/or the original MMWR paper copy for the official text, figures, and tables. An original paper copy of this issue can be obtained from the Superintendent of Documents, U.S. Government Printing Office (GPO), Washington, DC 20402-9371; telephone: (202) 512-1800. Contact GPO for current prices. **Questions or messages regarding errors in formatting should be addressed to mmwrq@cdc.gov.Date last reviewed: 8/5/2005 |
|||||||||
|