|
|
|
|
|
|
|
|
|
|
|
|
|
|
|
|
|
||||
| ||||||||||
|
|
|
|
|
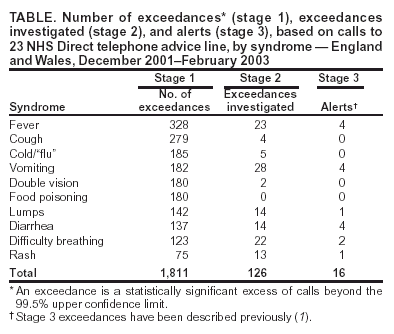
Persons using assistive technology might not be able to fully access information in this file. For assistance, please send e-mail to: mmwrq@cdc.gov. Type 508 Accommodation and the title of the report in the subject line of e-mail. National Symptom Surveillance Using Calls to a Telephone Health Advice Service --- United Kingdom, December 2001--February 2003
Duncan L. Cooper,1 G. Smith,1 M. Baker,2 F. Chinemana,3 N. Verlander,4 E. Gerard,3 V. Hollyoak,5 R. Griffiths6 1Health Protection Agency West Midlands, Birmingham, England; 2Royal College of General Practitioners, London, England;
Corresponding author: Duncan L. Cooper, Health Protection Agency West Midlands, Floor 2, Lincoln House, Heartlands Hospital, Birmingham, England B9 5SS. Telephone: 0121-773-7077; Fax: 0121-773-1407; E-mail: Duncan.Cooper@HPA.org.uk. AbstractIntroduction: Recent terrorist activity has highlighted the need to improve surveillance systems for the early detection of chemical or biologic attacks. A new national surveillance system in the United Kingdom (UK) examines symptoms reported to NHS Direct, a telephone health advice service. Objectives: The aim of the surveillance system is to identify an increase in symptoms indicative of early stages of illness caused either by a deliberate release of a biologic or chemical agent or by common infections. Methods: Data relating to 10 key syndromes (primarily respiratory and gastrointestinal) are received electronically from 23 call centers covering England and Wales. Data are analyzed daily and statistically significant excesses, termed exceedances, in calls are automatically highlighted and assessed by a multidisciplinary team. Results: During December 2001--February 2003, a total of 1,811 exceedances occurred, of which 126 required further investigation and 16 resulted in alerts to local or national health-protection teams. Examples of these investigations are described. Conclusion: Surveillance of call-center data has detected substantial levels of specific syndromes at both national and regional levels. Although no deliberate release of a biologic or chemical agent has been detected thus far by this or any other surveillance system in the UK, the NHS Direct surveillance system continues to be refined. IntroductionRecent terrorist activity has highlighted the need to improve surveillance systems for early detection of chemical or biologic attacks. A new United Kingdom (UK) surveillance system operated by the National Health Service (NHS) examines syndromes reported to NHS Direct, a national telephone health advice service (1). NHS Direct is a nurse-led helpline that provides the public with rapid access to professional health advice and information about health, illness, and NHS (2). NHS Direct is open 365 days/year and serves the entire population of England and Wales. NHS Direct nurses use clinical decision support software, the NHS Clinical Assessment System (NHS CAS), to respond to calls. NHS CAS contains >200 clinical algorithms that form tree-like structures of questions relating to the symptoms of the person about whom the call is made. The majority of calls result in a call outcome, either advice for self-care, a routine doctor referral, an urgent doctor referral, an emergency department (ED) referral, or a paramedic dispatch. Data derived from NHS Direct can be of value in disease surveillance. When a deliberate release of a harmful agent causes an illness with an extended, mild, prodromal phase, certain persons are likely to contact NHS Direct before contacting any other health service. These contacts provide an opportunity to identify an increase in illness before it is identified by other primary- or secondary-care services. The aim of the surveillance system described here is to identify an increase in symptoms indicative of the early stages of illness caused by the deliberate release of a biologic or chemical agent, or by common infections. This project builds on existing surveillance of influenza-like-illness and gastrointestinal symptoms that uses NHS Direct call data (3--5). MethodsDaily call data relating to 10 syndromes (cold/"flu," cough, diarrhea, difficulty breathing, double vision, eye problems, lumps, fever, rash, and vomiting) are received electronically by the Health Protection Agency (HPA) from all 23 NHS Direct sites in England and Wales. (Beginning April 2003, eye problems replaced food poisoning as a syndrome category.) These data are analyzed daily by a surveillance team established in November 2001 and consisting of HPA and NHS Direct staff. The 10 syndromes were selected as indicative of the early stages of illnesses caused by biologic or chemical weapons. Data are categorized by NHS Direct site, symptom, age group, and call outcome. NHS Direct nurses triage rather than diagnose illness in callers. Upper confidence limits (99.5% level) of calls for each syndrome, as a percentage of daily total calls, are constructed for each NHS Direct site. These confidence limits are derived from a standard formula for percentages (6) with the baseline numbers of total calls and symptom calls adjusted for seasonal effects (winter: December--February; spring: March--May; summer: June--August; autumn: September--October). A daily percentage of calls exceeding the 99.5% upper confidence limit is termed an exceedance. In addition to confidence-interval analyses, control charts are constructed for five of the 10 syndromes (cold/"flu", cough, fever, diarrhea, and vomiting) at the 10 NHS Direct sites serving five major urban centers (London, Manchester, Leeds, Birmingham, and Newcastle). Baselines for the control charts are calculated by assuming that the number of syndromic calls follows a Poisson distribution with the total number of calls as an offset. A model is fitted to each site and each symptom separately, using data from December 2001. Each model always includes a public holiday and seasonal term. When necessary, a day of the week (weekday, Saturday, or Sunday) and a linear long-term trend factor are also fitted. Scaling is performed to account for overdispersion. A normal approximation is not used to calculate the 99.5% upper control-chart limit of calls for each syndrome as it yields a greater percentage of exceedances than would be expected (i.e., >0.5%). Instead, a transformation to approximate normality with zero mean is performed and transformed back to the original scale. For control charts, the following formula for the 99.5% upper limit of syndromic calls is used:
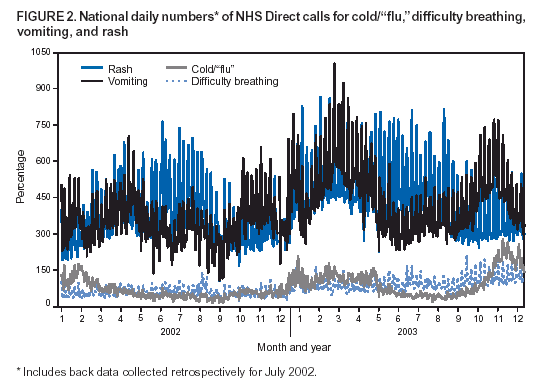
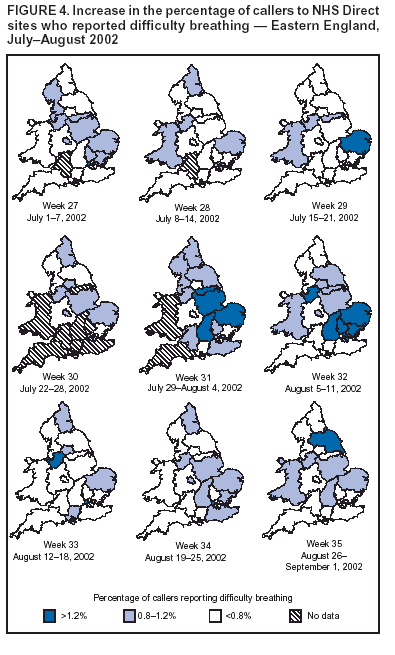
where N is given by the expected value divided by 1 less than the scale parameter; p is equal to the scale parameter minus 1; and za is the 100*(1--a)th centile of the normal distribution. Ad-hoc choices of z are made to achieve the desired number of purely random exceedances (0.5%). The upper 99.5% control-chart limit of calls for each syndrome, as a percentage of total calls, is calculated daily. Exceedances in calls for any of the 10 syndromes are automatically highlighted (for the confidence-interval and control-chart method) and assessed by the surveillance team (stage 1). If no reasonable explanation for the exceedance can be found, additional line listings of call details (including the call identification [ID] number and the caller's residential postcode) are requested for the date of the exceedance and for the current date (stage 2). The call ID number, which should be a unique number, is used to identify duplicate call records. Requesting calls for the current date (which will be complete up to the hour the request is made) is critical for monitoring what might be an evolving situation. If current call data indicate persistent statistical excesses (i.e., exceeding the 99.5% upper confidence limit) for a particular syndrome, a geographic information system can be used to map call data, although this procedure is not routine for all exceedances. NHS Direct sites can export calls to other sites during periods of peak demand. A percentage of calls handled by NHS Direct sites (usually <10%) might therefore originate from outside their catchment areas. Catchment areas are based on local telephone area codes. When the surveillance team determines that information provided by line listings necessitates further investigation (stage 2), the team generates an alert by passing call information to the relevant local or national public health teams for follow-up (stage 3). If the exceedance is suspected to represent a serious public health threat, the NHS Direct medical adviser can contact callers to obtain further clinical information. Weekly bulletins summarizing NHS Direct call activity are disseminated to relevant local and national health-protection colleagues. ResultsWhen the surveillance of 10 syndromes began in December 2001, call data were collected from approximately one-half of the total 23 NHS Direct sites. Subsequently, the mean number of NHS Direct sites providing daily call data increased from 12 sites in December 2001 to all 23 during October 2003 (Figure 1). A sudden decrease in the number of sites providing call data in July 2002 was attributable to surveillance staff absences. No constant differences in the level of data provision existed between the regions. During December 2001--February 2003, a total of 1,811 confidence-limit exceedances occurred (stage 1), of which 126 (7%) required further investigation (stage 2) and 16 (1%) resulted in alerts (stage 3) (Table). Exceedance investigations did not progress to alerts when 1) the observed increase in calls was a single-day exceedance only (46% of stage 2 investigations), 2) duplicate call records caused the exceedance (20%), or 3) the call data did not cluster geographically (15%). An overview of the national daily numbers and percentages of calls for four syndromes is provided (Figures 2 and 3). As expected, a seasonal pattern of higher activity during the winter emerged for certain syndromes (e.g., cold/"flu" and vomiting), both in the numbers and percentages of calls. The numbers of calls for all 10 syndromes increased during weekends and on public holidays, when many routine primary-care services are closed. The percentage of calls regarding certain syndromes also increased during weekends (e.g., rash) and on public holidays (e.g., cough and vomiting). During early August 2002, daily exceedances of callers reporting difficulty breathing occurred at eight of nine NHS Direct sites within the Thames basin and East Anglia. These exceedances accompanied a general increase in callers reporting difficulty breathing in eastern parts of Central and Southern England (Figure 4). This increase was preceded by elevated ozone levels and thunderstorms in this part of England. The timing and effect of these climatic and environmental conditions on call data are being analyzed. This detection of a sudden increase in calls has also generated new operational links between environmental health professionals in the Health Protection Agency and other central government departments. In January 2003, traces of the chemical poison ricin were found in a North London apartment. In response, the surveillance team was asked to enhance symptom surveillance of call data collected from the five NHS Direct sites in London. Data were collected on four syndromes (Figure 5) and updated every 2 hours. Call data were also mapped by place of residence, as this might have provided the first clue that a deliberate release could have occurred at a particular location. NHS Direct data and other data sources have demonstrated no evidence thus far of any deliberate release of biologic or chemical agents within the UK. ConclusionsThis syndromic surveillance system is the only such system covering the entire population of England and Wales. Although the majority of exceedances do not result in subsequent investigation, when action is taken, health-protection teams are usually informed within 24--48 hours of calls being received by NHS Direct. Only 2 years of data have been collected, and the establishment of baselines and refinement of statistical methodology continue. Although no deliberate release of chemical or biologic agents has been detected, this surveillance system has detected elevated levels of activity in specific symptoms at both national and regional levels. After an initial period in which duplicate call records led to investigation of exceedances that later proved spurious, data quality was improved. The surveillance now covers the entire population of England and Wales and is conducted daily. Although geographic locations of calls are available on request, the geographic resolution of the initial daily analysis (to identify exceedances) is at a site level. This means localized, subsite-level outbreaks might be overlooked. The surveillance team is investigating ways to collect and analyze call data by smaller geographic units. Consistent and timely data returns have been achieved by concentrating on collecting routine NHS Direct data with minimal disruption to the data providers' work patterns and by ensuring continual feedback to all staff within the surveillance network. The annual operating cost of the surveillance system is <$200,000. Providing these surveillance data is now an integral part of NHS Direct's objectives and is a priority within the service; this was essential in January 2003 when real-time surveillance was needed to address a perceived threat of a ricin release. Analysis of the surveillance data in that instance helped to determine that no deliberate release had occurred. A recent government strategy document announced a three-fold expansion of NHS Direct call-handling capacity over the next 3--4 years, with an equivalent increase in call volumes also expected (from 6 to 16 million calls/year in England) (7). This volume compares with approximately 14 million visits/year to EDs in England (8) and 190 million consultations with primary-care physicians (9). The increase in NHS Direct call volumes should improve the representativeness of the call data and the potential for early identification of disease outbreaks. The value of surveillance of NHS Direct data in complementing existing surveillance for common infections (e.g., influenza) is being established (1,3,4). Whether the NHS Direct syndromic surveillance system will ultimately provide early warning of a chemical or biologic attack will only be demonstrated if such an event occurs. Acknowledgments NHS Direct sites and the NHS Direct Health Intelligence Unit provided surveillance data for this research. References
Figure 1 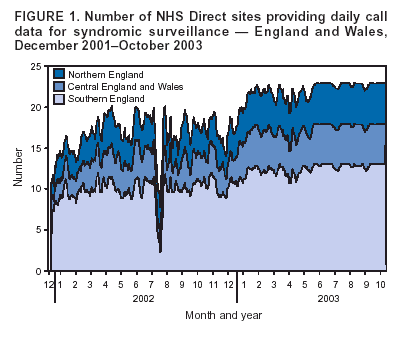 Return to top. Figure 2
All MMWR HTML versions of articles are electronic conversions from ASCII text into HTML. This conversion may have resulted in character translation or format errors in the HTML version. Users should not rely on this HTML document, but are referred to the electronic PDF version and/or the original MMWR paper copy for the official text, figures, and tables. An original paper copy of this issue can be obtained from the Superintendent of Documents, U.S. Government Printing Office (GPO), Washington, DC 20402-9371; telephone: (202) 512-1800. Contact GPO for current prices. **Questions or messages regarding errors in formatting should be addressed to mmwrq@cdc.gov.Page converted: 9/14/2004 |
|||||||||
This page last reviewed 9/14/2004
|