|
|
|
|
|
|
|
|
|
|
|
|
|
|
|
|
|
||||
| ||||||||||
|
|
|
|
|
Persons using assistive technology might not be able to fully access information in this file. For assistance, please send e-mail to: mmwrq@cdc.gov. Type 508 Accommodation and the title of the report in the subject line of e-mail. Benchmark Data and Power Calculations for Evaluating Disease Outbreak Detection MethodsMartin Kulldorff,1 Z. Zhang,2 J. Hartman,3,4 R. Heffernan,3 L. Huang,2 F.
Mostashari3
Corresponding author: Martin Kulldorff, Department of Ambulatory Care and Prevention, Harvard Medical School and Harvard Pilgrim Health Care, 133 Brookline Avenue, 6th Floor, Boston, MA 02215. Telephone: 617-509-9757; Fax: 617-859-8112; E-mail: martin_kulldorff@hms.harvard.edu. AbstractIntroduction: Early detection of disease outbreaks enables public health officials to implement immediate disease control and prevention measures. Computer-based syndromic surveillance systems are being implemented to complement reporting by physicians and other health-care professionals to improve the timeliness of disease-outbreak detection. Space-time disease-surveillance methods have been proposed as a supplement to purely temporal statistical methods for outbreak detection to detect localized outbreaks before they spread to larger regions. Objective: The aims of this study were twofold: 1) to design and make available benchmark data sets for evaluating the statistical power of space-time early detection methods and 2) to evaluate the power of the prospective purely temporal and space-time scan statistics by applying them to the benchmark data sets at different parameter settings. Methods: Simulated data sets based on the geography and population of New York City were created, including effects of outbreaks of varying size and location. Data sets with no outbreak effects were also created. Scan statistics were then run on these data sets, and the resulting power performances were analyzed and compared. Results: The prospective space-time scan statistic performs well for a spectrum of outbreak models. By comparison, the prospective purely temporal scan statistic has higher power for detecting citywide outbreaks but lower power for detecting geographically localized outbreaks. Conclusions: The benchmark data sets created for this study can be used successfully for formal statistical power evaluations and comparisons. If an anomaly caused by an outbreak is local, purely temporal surveillance methods might be unable to detect it, in which case space-time methods would be necessary for early detection. IntroductionEarly detection of disease outbreaks enables public health officials to implement disease control and prevention measures at the earliest possible time (1--3). For an infectious disease, improvement in detection timeliness by even 1 day might enable public health officials to control the disease before it becomes widespread. Real-time, geographic, early outbreak-detection systems have been used in New York City (NYC) (4--8), the greater Washington, D.C., area (9), Salt Lake City, Utah (10), and other locations (11). Because the onset of a disease outbreak is unpredictable, early detection methods need to continuously evaluate different incoming data streams (e.g., ambulance dispatches, emergency department [ED] visits, pharmacy sales, or health insurance claims). Furthermore, because early evidence of an outbreak might be localized, systems need to monitor multiple locations simultaneously because neither the extent nor geographic pattern of the outbreak is yet known. The majority of traditional disease-surveillance methods are purely temporal in nature in that they seek anomalies in time-series data without using spatial information (12). Although temporal methods are important and can be used simultaneously for multiple areas, they do not take into account geographic location and might be unable to quickly detect localized outbreaks that do not conform to predefined areas. For this reason, different space-time early detection methods have been proposed (13--17). Research in this area is ongoing, and new or refined methods will likely be proposed soon. The effectiveness of these new methods will then have to be evaluated and compared with current methods. When evaluating an outbreak-detection method, investigators should have knowledge of the method's ability to detect true outbreaks and the number of false alerts likely to result. The first aim of this study was to create simulated benchmark data sets that can be used for rigorous evaluation of the statistical power of early outbreak-detection methods, an important complement to other evaluations that use real data sets with known outbreaks or real data sets with spiked outbreaks in which additional artificial cases are added to the real cases. The second aim was to estimate and compare the power of prospective purely temporal scan statistics with different versions of the prospective space-time scan statistics (14) that are used daily by the syndromic surveillance program of the NYC Department of Health and Mental Hygiene. MethodsBenchmark DataA collection of public benchmark data sets for statistical power comparisons was established to enable evaluation and comparison of early detection methods as they are developed. Geographic coordinates (representing the approximate center of each zip code) and population numbers for 176 NYC zip codes were used for these data sets. A total of 134,977 benchmark data sets with a random number of cases of a hypothetical disease or syndrome were generated under either the null model or one of 35 alternative models, including a citywide outbreak with a relative risk of 1.5 and 34 geographically localized outbreaks in one of 17 different locations with either a high or modest excess risk. Three different sets of data sets were then generated under the null model and under each of the 35 alternative models, each with 31, 32, and 33 days, respectively. For each of the three null-model scenarios, with 31, 32, and 33 days, respectively, 9,999 random data sets were generated. For each of the 3 sets of 35 alternative models, defined by the number of days in the data and the location and relative risk of the outbreak, 1,000 random data sets were generated. For each data set, the total number of randomly allocated cases was 100 times the number of days (i.e., 3,100 cases in the data sets containing 31 days, 3,200 cases in the data sets with 32 days, and 3,300 cases in the data sets with 33 days). The number 100 was chosen to reflect the occurrence rate of certain syndromes common to the NYC ED-based syndromic surveillance system. Under the null model, each person living in NYC is equally likely to contract the disease, and the time of each case is assigned with equal probability to any given day. Thus, each case was randomly assigned to zip code z and day d with probability proportional to rzd = popz, where popz is the population of zip code z. For the alternative models, one or more zip codes were assigned an increased risk on day 31 and, when applicable, on days 32 and 33 as well. For these zip code and day combinations, rzd was multiplied by an assigned relative risk. For all other zip code and day combinations, rzd did not change. Each case was then randomly assigned with probabilities proportional to the new set of rzd to generate data under the alternative models. Six alternative models in which the outbreak affected only one zip code were evaluated. The six zip codes varied in size and location. Next, six additional alternative models were considered, with the outbreak centered at the same six zip codes but also including four to nine neighboring areas. Seven additional alternative models, with outbreaks in the Rockaways region, along the Hudson River, and throughout each of the five NYC boroughs were also examined (Figure 1). For each of the alternative models, the relative risk of the outbreak was assigned on the basis of the outbreak area's total population, with more populous areas assigned a lower relative risk. This was done so that the power was 99% to detect a signal at the a = 0.05 level when a Poisson distribution was used to compare the observed relative risk within the outbreak area with the remaining zip codes by using only 1 day of data with a total of 100 cases. This approach permits evaluation of the relative strength of methods for detecting different cluster types to be evaluated. For example, if a method has 85% power to detect an outbreak in one zip code and 80% power to detect a borough outbreak, the method is relatively more efficient at detecting smaller outbreaks. In addition to the relative risks created by using the 99% rule, a second group of data sets was created and evaluated by using the same rule but with 90% power. An alternative model with a citywide outbreak was also considered, with a relative risk of 1.5 in all zip codes during days 31, 32, and 33. By using the same simulated data when comparing methods, the variance of the power-estimate differences is kept to a minimum (18). Availability of the simulated data sets (http://www.satscan.org/datasets) will enable new methods to be thoroughly evaluated and compared with minimal effort. For statistical reasons, completely separate data sets with 31, 32, and 33 days, respectively (rather than one data set from which one could then use the desired number of days) were created to obtain proper power estimates. The majority of methods for conducting statistical evaluation of geographic clusters are based on Monte Carlo hypothesis testing (19), whereby the test statistic for the real data set is compared with the value of the test statistic for simulated data sets generated under the null hypothesis, after conditioning on the total number of cases observed. That is, the critical values for the likelihood ratio or any other type of test statistic are calculated conditioned on the total number of cases in the data set, so that only their geographic and temporal distribution are evaluated but not the total count observed. If only one data set was used for all three periods, the total number of cases during the first 31 days must be fixed to condition on the total number of cases in the 31-day analysis, but the total number of cases during the first 32 days must also be fixed to condition on the total number of cases in the 32-day analysis. However, if both of those are fixed, then the number of cases during day 32 is also fixed, which cannot be done because one should condition only on the total number of cases during the whole study period but not on individual days within that period. Prospective Space-Time Scan StatisticThe benchmark data sets were used to estimate the power of the prospective space-time scan statistic (14). In brief, the prospective space-time scan statistic imposes a cylindrical window on the map and lets the center of the circular base move over the region, so that, at different positions, the window includes different sets of neighboring zip codes. For each circle center, the circle's radius is varied continuously from zero up to a maximum radius so that the window never includes, for example, >50% of the total population at risk. Thus, the window remains flexible, both in location and size. In addition, the height of the cylinder, representing time, is flexible such that the window might contain one or more days up to an upper limit. Hence, the window could cover a geographically small outbreak in a single zip code having lasted multiple days (a long and narrow cylinder), a geographically large outbreak affecting the entire city but present only during the last day (a short and fat cylinder), or any other combination of geographic size and temporal length. In total, the method creates thousands of distinct windows, each with a different set of neighboring zip codes and days within it, and each a possible candidate for containing a disease outbreak. Only those cylinders that reach all the way to the end of the study period are considered. In mathematical notation, let [B,E] represent the time interval for which data exist, and let s and t represent the start and end dates of the cylinder, respectively. All cylinders for which B < s < t = E are then considered. Different parameter options can be chosen in terms of the maximum geographic and temporal cluster size being considered; this study evaluated five different combinations. Conditioning on the observed total number of cases, N, the definition of the space-time scan statistic S is the maximum likelihood ratio over all possible cylinders Z,
where L(Z) is the maximum likelihood for cylinder Z, expressing how likely the observed data are when allowing for different risk inside and outside the cylinder, and where L0 is the likelihood function under the null model. Let nZ represent the number of cases in cylinder Z. Using a Poisson model for the observed number of counts, let µ(Z) be the expected number under the null model, so that µ(A) = N for A, the total region under study. Then,
if nz > µ(Z) and L(Z)/L0 = 1. Details about the mathematical formulas, including derivations as likelihood ratio tests, have been published elsewhere (20). The cylinder for which this likelihood ratio is maximized identifies the most likely cluster. Its p-value is obtained through Monte Carlo hypothesis testing (19). The prospective space-time scan statistic can be implemented by using different parameter options. As the standard analytic option, 50% of the population was used as the upper limit on the geographic cluster size, and a period of 3 days was used as the upper limit on the temporal cluster size. The possibility of citywide outbreaks was also considered by including purely temporal clusters containing 100% of the population in addition to the 50% maximum size. No adjustment was made for the time-repeated analyses conducted daily. For selected alternative outbreak models, the power of the prospective space-time scan statistic was evaluated for the following changes in parameter options: 1) not including purely temporal clusters; 2) setting the maximum geographic cluster size at 5% of the population rather than 50%; 3) setting the maximum temporal cluster size at 1 and 7 days, respectively, rather than 3 days; and 4) adjusting for the multiple testing stemming from the repeated daily analyses such that only one false alert would be expected per year (14). Purely Temporal Scan StatisticThe purely temporal scan statistic is mathematically a special case of the space-time scan statistic, in which counts from the entire surveillance area are aggregated so that no spatial information remains. Hence, the window is defined only by its temporal length, which could be one or more days. As with the prospective space-time scan statistic described previously, only those windows for which B < s < t = E were considered. A period of 3 days was used as the maximum temporal length. Power EstimationsThe power estimations were conducted as follows. First, for the random data sets generated under the null model, the log likelihood ratio (LLR) was obtained for all cylindrical window locations and sizes, and its maximum noted, to obtain the maximum LLR for each simulated data set. A critical value corresponding to a 0.05 significance level was computed by identifying the 500th highest maximum LLR from among the 9,999 random data sets generated under the null model. Then, the estimated power for a particular alternative model was calculated as the percentage of the 1,000 random data sets for which the maximum LLR exceeds the critical value. Separate critical values were obtained for each number of days considered (31, 32, and 33) and for each of the different analytic options used. However, as long as the number of days and the analytic options are the same, the same critical value can be used for different alternative outbreak models. All calculations were performed by writing additional routines for the SaTScan™ software (21). ResultsFor the standard parameter options, the estimated powers for the different alternative models and different relative risks are provided (Tables 1 and 2). The power was good for both small and large outbreak areas. As expected, the power was higher when more days had elapsed since the start of the outbreak. The increase in power was rapid. The power was approximately the same for outbreaks of different sizes. The major exception was the Hudson River outbreak, for which the lower power was caused by using a circular geographic window to capture a long and narrow outbreak. The same loss of power was not seen in the similarly shaped Rockaways region, possibly because that region has fewer zip codes than the Hudson River outbreak region. For selected alternative outbreak models, the estimated powers for each parameter option are provided, as well as for the purely temporal scan statistic (Table 3). Setting the maximum temporal cluster size to 1 day increased the power to detect the outbreak during the first day, at the expense of decreased power during subsequent days. Adjusting for previous analyses reduces the power, a consequence of the unavoidable trade-off between power and the number of false positives. Hence, the choice of whether to adjust for previous analyses is similar to a choice of whether to use 0.01 instead of 0.05 as the α level. Both approaches will reduce the number of false alerts but also reduce the power to detect true outbreaks. The purely temporal scan statistic has considerably higher power for citywide outbreaks but does not perform well for localized outbreaks. Certain power estimates were unexpected. For example, for an outbreak in a single zip code, the power would be expected to be higher with an upper limit of 5% rather than 50% on the geographic cluster size. However, for outbreak model A, the power is 0.86 in both cases (Table 3). The power is depicted as a function of the false-detection rate (α level) (Figure 2, top). The number of cases in the outbreak is always an integer, and if the outbreak area is limited, only a limited number of integer values are possible in the true outbreak area. Thus, the power function takes discrete jumps at certain a levels, and the location of the jump varies for different analytic options. Hence, for certain values of a, one method might be superior to another even though both methods have almost the same power at other a levels. The locations of these jump points are different for different single zip code outbreaks. As the number of zip codes in an outbreak area increases, this phenomenon disappears, such that the power functions are much smoother for model A with four neighbors (Figure 2, middle) and for Manhattan (Figure 2, bottom). DiscussionOne goal of developing the benchmark data sets was to enable quick and simple comparison of new early detection methods with methods proposed previously. Inventors of new methods will hopefully make use of this opportunity. Pending evaluation of emerging methods, different parameter options of the prospective space-time scan statistic have been evaluated. An important consideration when using the prospective space-time scan statistic is whether to include purely temporal cluster windows for detection of citywide outbreaks. Including this option increases the power for a citywide outbreak only marginally while minimally decreasing the power for the localized outbreak models (Table 1). In the majority of situations, purely temporal clusters should be included as an analysis option. For the same reason, using 50% as the upper limit in cluster size minimizes assumptions about the geographic cluster size. The choice of maximum temporal-window size is less clear. Making the temporal window too small can substantially reduce the power to detect slowly emerging disease outbreaks. At the same time, these methods are meant for the rapid detection of disease outbreaks, and, depending on the disease, late detection of an outbreak might not provide any public health benefit. Compromise is needed and should be determined by the nature of the surveillance setting. For the majority of these power evaluations, no adjustment was made for repeated analyzes performed daily. If such an adjustment were made, instead of keeping the false-alert rate at 5% for any given day (one false alert every 20 days), it could be set so that under the null model only one false alert/year (or per any other period) would be expected. As a result, the power would automatically decrease (Table 3). This decrease in power is attributable not to the method's strengths or weaknesses but to the ever-present trade-off between power and the number of false alerts. All power comparisons must use identical false-detection rates to be valid. This study is subject to at least three limitations. First, the alternative outbreak models used for the benchmark data sets represent only a subset of the potential geographic and temporal features of actual disease outbreaks. As such, this study is a first step in creating different outbreak models for evaluating and comparing the statistical power of different outbreak-detection methods. For example, rather than a sudden increase in relative risk followed by a constant excess risk level in the outbreak area, one could construct outbreak models in which the relative risk increased gradually. Moreover, rather than simulating outbreaks that are geographically static in time, an outbreak might first be spatially limited and then expand to neighboring zip codes, or it might start in one place and then gradually move to other areas of the city. Second, this study examined data only for New York City. Simulated benchmark data sets for methods evaluation should be based on real geographic areas with realistic numbers for the underlying population at risk; NYC was selected for this study because it is where the investigators conduct outbreak surveillance. However, effective surveillance methods should work for different geographic areas and for different distributions of the population at risk. Evaluating outbreak-detection methods for geographic areas other than NYC would be valuable. Finally, although these power estimates do capture the timeliness of a signal, they do not reflect its spatial accuracy. Only rarely will detected and true clusters coincide 100%, but the overlap might be better or worse for different methods. ConclusionsThe prospective space-time scan statistic performed well for all alternative models considered. Power was lowest for the Hudson River outbreak but remained surprisingly good considering that a circular window was used to detect a long and narrow cluster. The low power of the purely temporal method to detect localized outbreaks provides a strong argument for using space-time surveillance methods for early outbreak detection, if the outbreak is expected to be localized. However, the purely temporal scan statistic performs substantially better at detecting a citywide outbreak, even when compared with a space-time method that includes the purely temporal outbreak as one parameter option. This is because less multiple testing needs adjustment when the multiple circles used to define localized outbreaks are not used, and an unavoidable trade-off exists between maximizing the power to detect localized versus citywide outbreaks. Acknowledgments This research was funded by the Alfred P. Sloan Foundation. The authors thank two anonymous reviewers for their valuable comments. References
Table 1 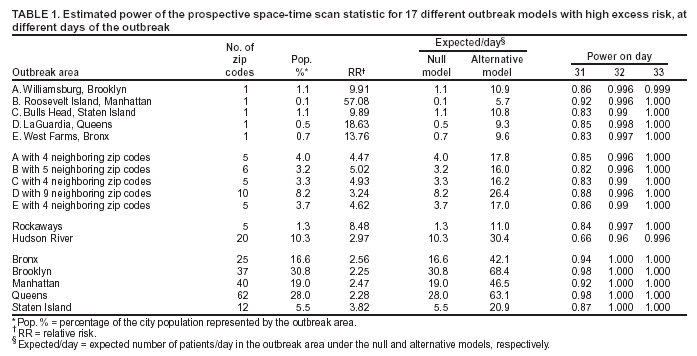 Return to top. Figure 1 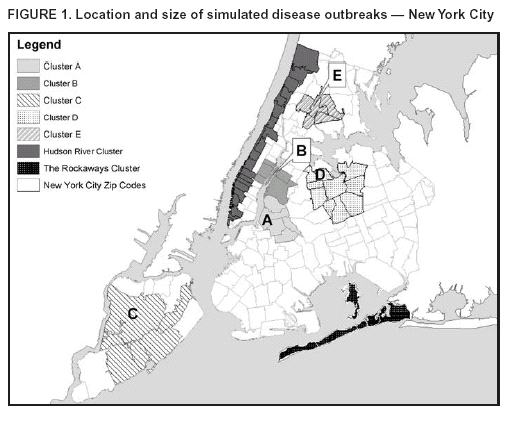 Return to top. Figure 2  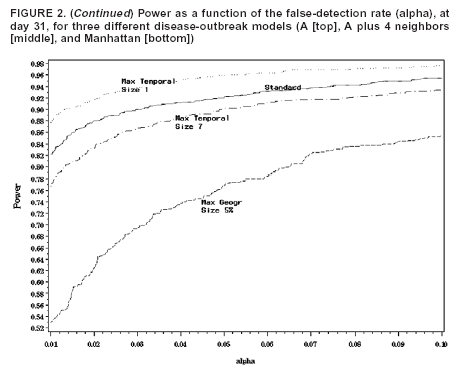 Return to top. Table 3 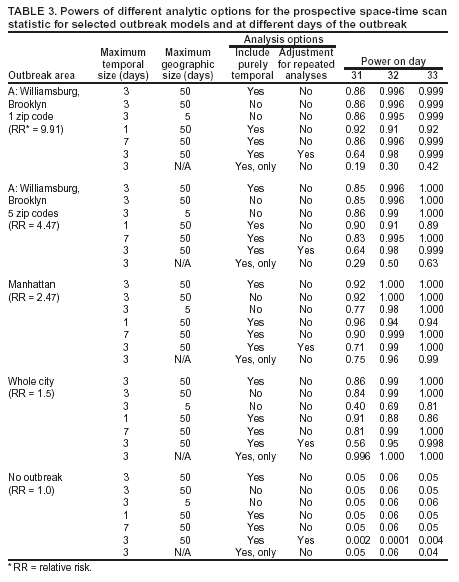 Return to top.
All MMWR HTML versions of articles are electronic conversions from ASCII text into HTML. This conversion may have resulted in character translation or format errors in the HTML version. Users should not rely on this HTML document, but are referred to the electronic PDF version and/or the original MMWR paper copy for the official text, figures, and tables. An original paper copy of this issue can be obtained from the Superintendent of Documents, U.S. Government Printing Office (GPO), Washington, DC 20402-9371; telephone: (202) 512-1800. Contact GPO for current prices. **Questions or messages regarding errors in formatting should be addressed to mmwrq@cdc.gov.Page converted: 9/14/2004 |
|||||||||
This page last reviewed 9/14/2004
|