|
|
|
|
|
|
|
|
|
|
|
|
|
|
|
|
|
||||
| ||||||||||
|
|
|
|
|
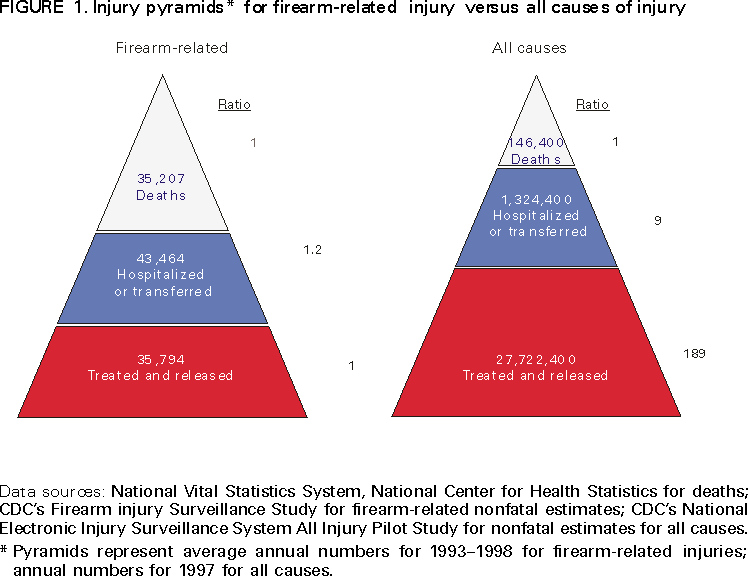
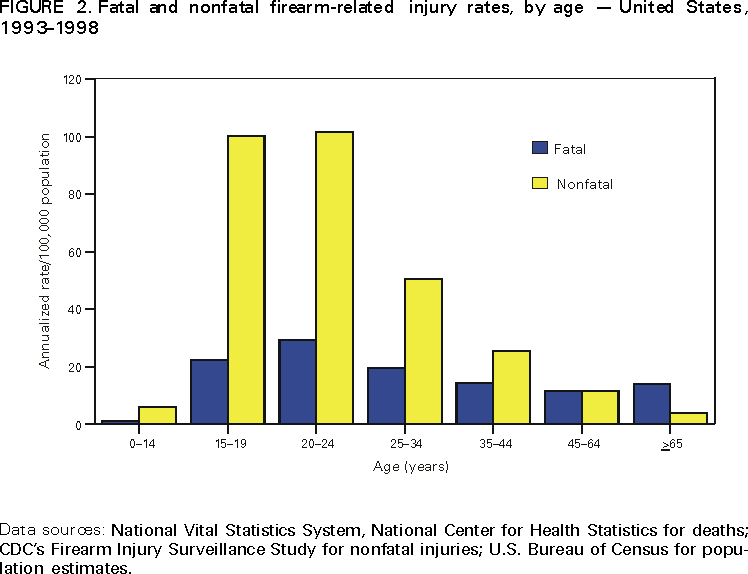
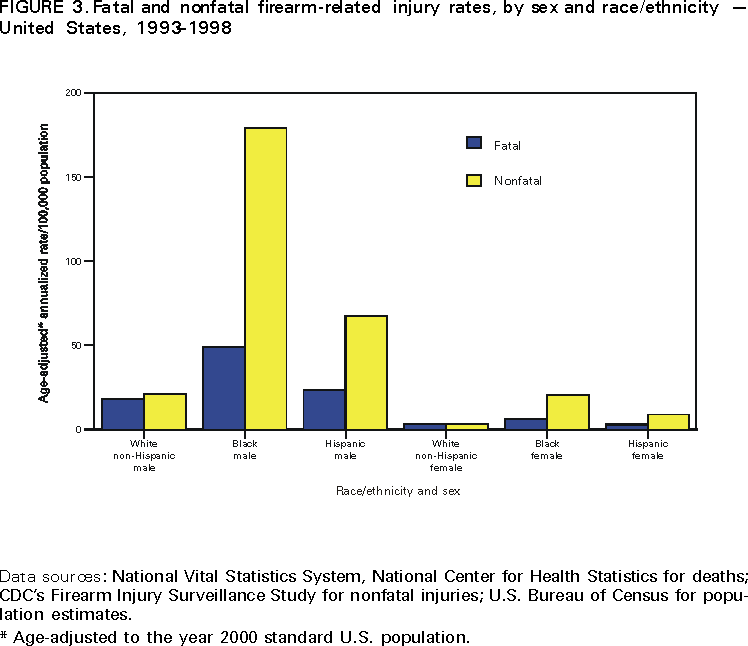
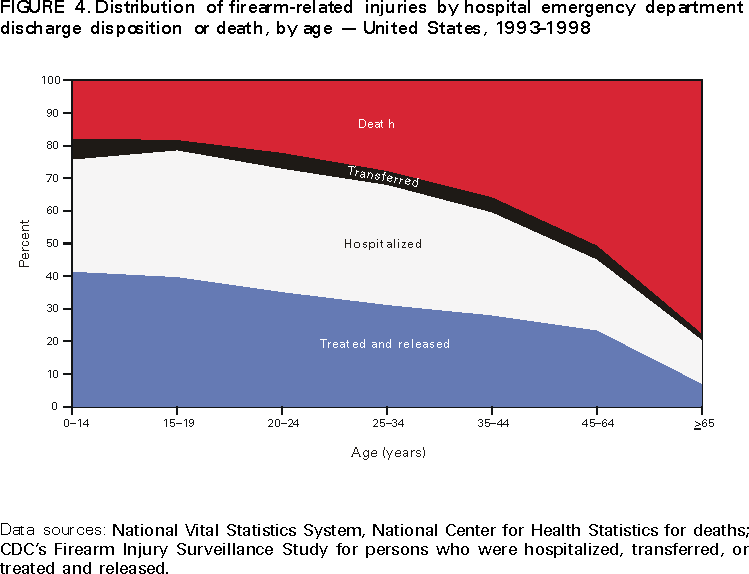
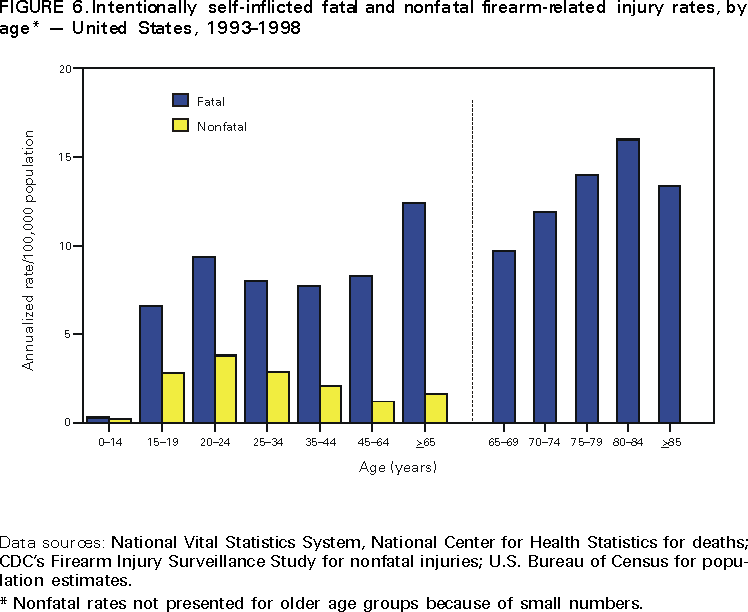
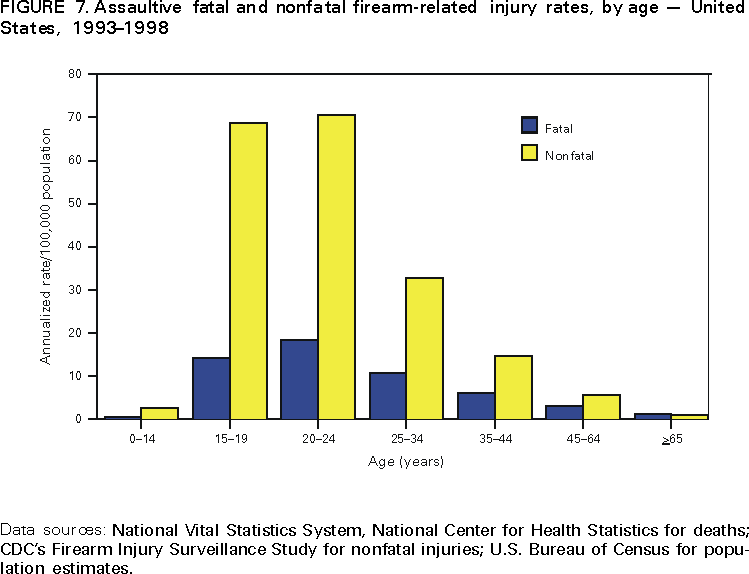
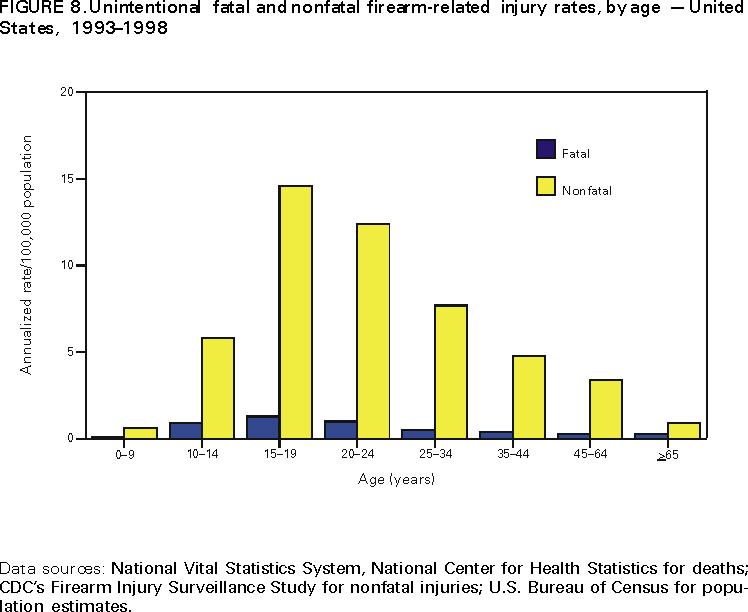
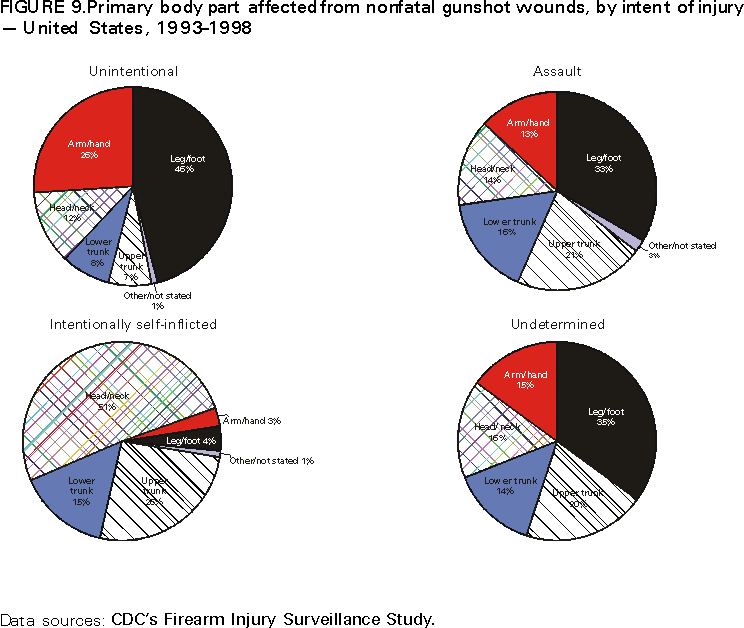
Persons using assistive technology might not be able to fully access information in this file. For assistance, please send e-mail to: mmwrq@cdc.gov. Type 508 Accommodation and the title of the report in the subject line of e-mail. Surveillance for Fatal and Nonfatal Firearm-Related Injuries --- United States, 1993--1998Karen E. Gotsch1 AbstractProblem/Condition: Firearm-related injuries are the second leading cause of injury-related death in the United States. Reporting Period: January 1993--December 1998. Description of the Systems: Data presented in this report regarding nonfatal injuries are from the National Electronic Injury Surveillance System of the U.S. Consumer Product Safety Commission. National estimates of nonfatal firearm-related injuries were derived using weighted data for patients treated in a nationally representative, stratified probability sample of U.S. hospital emergency departments (EDs). Death data presented in this report are from CDC's National Vital Statistics System, which includes information from all death certificates filed in the 50 states and the District of Columbia. Population data for calculating rates were obtained from the U.S. Bureau of the Census. Results: During 1993--1998, an estimated average of 115,000 firearm-related injuries (including 35,200 fatal and 79,400 nonfatal injuries) occurred annually in the United States. Males were seven times more likely to die or be treated in a hospital ED for a gunshot wound than females. The proportion of firearm-related injuries that resulted in death increased from younger to older age groups. Approximately 68% of firearm-related injuries for teenagers and young adults aged 15--24 years were from interpersonal violence, and 78% of firearm-related injuries among older persons aged >65 years were from intentionally self-inflicted gunshot wounds. Black males aged 20--24 years had the highest average annual fatal (166.7/100,000 population) and nonfatal (689.4/100,000 population) firearm-related injury rates during the 6-year period. Although 51.4% of intentionally self-inflicted nonfatal wounds were to the head or neck, 71.8% of unintentional and 45.8% of assault-related nonfatal wounds were to the extremities. During the 6-year period, estimates are that quarterly fatal firearm-related injury rates declined 29.3%, and quarterly nonfatal firearm-related injury rates declined 46.9%. Firearm-related injury rates declined for intentionally self-inflicted, assault, and unintentional causes. Interpretation: Data in this report regarding trends in firearm-related injury rates during 1993--1998 indicate that both mortality and morbidity from gunshot wounds declined substantially in the United States. However, firearm-related injury continues to be a public health concern accounting for approximately 31,000 deaths and 64,500 nonfatal injuries treated in hospital EDs in 1998. Public Health Action: A state-based, national reporting system is needed to track the incidence, detailed circumstances, characteristics of the shooter and injured person, and long-term consequences of fatal and nonfatal firearm-related injuries. These data would be useful for the design, implementation, and evaluation of prevention programs aimed at reducing the burden of firearm-related injuries in the United States. INTRODUCTIONSince 1993, firearm-related injuries and deaths have been declining steadily (1--3). However, in 1998, firearm-related injuries remained the second leading cause of injury death in the United States (3), accounting for approximately 31,000 deaths. The majority of these fatal and nonfatal firearm-related injuries result from interpersonal violence and intentionally self-inflicted gunshot wounds, but approximately 15,000 unintentional gunshot wounds are treated in U.S. hospital emergency departments (EDs) each year (4). Although firearm-related injuries represent <0.5% of injuries treated in hospital EDs, they have an increased potential of death and hospitalization compared with other causes of injury (5--7). In 1994, treatment of gunshot injuries in the United States was estimated at $2.3 billion in lifetime medical costs, of which $1.1 billion was paid by the federal government (8). These factors emphasize the importance of firearm-related injuries as a public health concern. This report presents national data to characterize fatal and nonfatal firearm-related injuries occurring in the United States during 1993--1998 to supplement previous reports on long-term trends in firearm-related mortality rates (9,10). Data regarding firearm-related deaths from the National Center for Health Statistics' National Vital Statistics System (NVSS) are presented beside data regarding nonfatal firearm-related injuries treated in U.S. hospital EDs from the U.S. Consumer Product Safety Commission's National Electronic Injury Surveillance System (NEISS). These data collectively demonstrate that all segments of the U.S. population are affected by firearm-related injuries and that injury- and violence-prevention efforts are needed to reduce further the burden of these injuries on society. METHODSA firearm-related injury was defined as a gunshot wound or penetrating injury from a weapon that uses a powder charge to fire a projectile. This definition includes gunshot injuries sustained from handguns, rifles, and shotguns but excludes gunshot wounds from air-powered BB and pellet guns. National estimates of nonfatal firearm-related injuries were calculated using data collected during 1993--1998 from NEISS of the U.S. Consumer Product Safety Commission (CPSC). NEISS is a stratified probability sample of hospitals in the United States that have >6 beds and provide 24-hour emergency care (11,12). Through an interagency agreement between CPSC and CDC, information regarding all patients with gun-related injuries treated in NEISS hospital EDs has been collected since June 1992 (13,14). Nonfatal firearm-related gunshot cases represent those persons who were alive when discharged from the ED. The majority of deaths from firearm-related injuries occur at the scene, in route to the ED, or in the ED before hospitalization (6,13). Each eligible nonfatal case was assigned a sample weight. Sample weights were summed to provide national estimates of nonfatal firearm-related injuries. The sampling frame of NEISS remained the same for 1993--1996, and NEISS consisted of 91 U.S. hospital EDs randomly selected within each of four stratum (i.e., very large, large, medium, and small*) on the basis of the number of ED visits annually. In 1997, the sampling frame of NEISS was updated; a stratum was added for children's hospitals; and the number of NEISS hospitals was increased to 101 (15). During an 8-month overlap in 1997, gunshot cases were collected from both the old and new NEISS samples. Analysis of weighted data indicated that differences in the national estimates of firearm-related injuries based on these two samples were minimal (i.e., <1%) (CDC, unpublished data). These minimal differences indicate that trend analysis involving estimates of quarterly nonfatal rates during 1993--1998 were not substantially affected by the updated NEISS sample. Therefore, no statistical adjustments were made to account for the change in the sampling frame. Fatal firearm-related injuries were from NVSS of CDC's National Center for Health Statistics. NVSS provides a complete enumeration of all deaths in the United States (3). For this report, all deaths of residents of the United States with an International Classification of Diseases, 9th Revision (ICD-9) underlying cause of death codes of E922.0-E922.9, E955.0-E955.4, E965.0-E965.4, E985.0-E985.4, or E970 were included (16). Population estimates are from the U.S. Bureau of the Census. To derive average annual estimates of nonfatal firearm-related injuries, weighted data for each year during 1993--1998 were summed and divided by 6. To calculate the average annual rates, the estimates were summed for the 6 years, then divided by the sum of the population estimates for the same period and multiplied by 100,000. Similar calculations were made to derive average annual number of deaths and average annual mortality rates. To examine trends in nonfatal firearm-related rates by intent, the weighted cases with undetermined intent (i.e., 14.0% of nonfatal firearm-related injuries during the 6-year period) were allocated to one of three known intent categories: unintentional, assault/legal intervention, or intentionally self-inflicted injury. Weighted cases with undetermined intent were allocated within each quarter of each year on the basis of the weighted distribution of cases with known intent for each respective quarter. This method of allocation accounted for the quarterly variation in the percentage of weighted cases with undetermined intent (range: 7.1%--19.2%) and also for the seasonal variation observed among the cases with known intent. Although the percentage of firearm-related deaths with undetermined intent was minimal (i.e., 1.2% of deaths during the 6-year period), these cases were allocated in the same manner as the nonfatal estimates to maintain consistency. Linear regression was used to predict the percentage decline in fatal and nonfatal firearm-related injury rates presented in this report. The 95% confidence intervals calculated for these percentage declines accounted for the sample weights and stratified survey design. Race and ethnicity for nonfatal firearm-related cases from NEISS were obtained from ED records. The majority of cases were reported as either white, black, Hispanic, American Indian, or Asian. Nonfatal cases reported as white Hispanic were classified as Hispanic, and those reported as black Hispanic were classified as black.** Race/ethnicity categories for firearm-related deaths from NVSS were combined in a similar manner. For example, deaths specified as black Hispanic (i.e., 462 deaths or 0.2% of firearm-related deaths during the 6-year period) were classified as black. Numbers and rates of nonfatal and fatal firearm-related injuries are presented for the mutually exclusive categories of white non-Hispanic, black, Hispanic, and other or unknown categories. National estimates in the tables, figures, and text of this report are presented without 95% confidence intervals for brevity. However, unstable estimates are noted if the co-efficient of variation (CV) was >28%. Generalized relative standard error tables and formulas for both fatal and nonfatal firearm-related injuries are provided for data users to calculate 95% confidence intervals for specified point estimates (Appendix). RESULTSFatal and Nonfatal Firearm-Related Injuries, Overall and by Race/Ethnicity, Sex, and Disposition During 1993--1998, an estimated average of 115,000 firearm-related injuries occurred annually. Of these, approximately 30% resulted in death. This lethality rate is substantially higher than all causes of injury combined where <1% of cases were fatal (Figure 1). Both fatal and nonfatal firearm-related injury rates were highest among persons aged 15--24 years; black males in that age group had the highest risk (Figures 2,3; Tables 1--3). Fatal and nonfatal firearm-related injury rates for Hispanics were generally less than those for blacks, but higher than those for white, non-Hispanics (Figure 3; Tables 1--3). The firearm-related death rate for males was six times higher than that for females; the nonfatal firearm-related injury rate for males was eight times higher than that for females (Tables 1--3). The proportion of persons who died from firearm-related injuries increased with age (Figure 4). Of those who survived a gunshot wound and who were treated in a hospital ED, approximately 55% were hospitalized or transferred, and the other 45% were treated and released (Tables 2--4). Fatal and Nonfatal Firearm-Related Injuries, by Intent of Injury The proportion of persons with firearm-related injuries who died from intentionally self-inflicted gunshot wounds increased with age (Figure 5). For persons of all ages, the firearm-related suicide rate was four times higher than the nonfatal, self-inflicted injury rate (Table 5). Firearm-related suicide rates were highest among persons aged >65 years (Figure 6). A majority of firearm-related injuries for persons aged 15--44 years were caused by interpersonal violence (Figure 5). For persons in this age group, for every firearm-related homicide, 3--4 persons with nonfatal firearm-related injuries were treated in U.S. hospital EDs (Table 5). Assault-related fatal and nonfatal firearm-related injury rates were highest among persons aged 15--24 years (Figure 7; Table 5). Although unintentional injury accounts for <4% of firearm-related deaths, it accounts for 17% of nonfatal firearm-related injuries treated in U.S. hospital EDs. Unintentional fatal and nonfatal firearm-related injury rates are highest among persons aged 15--24 years and decrease consistently with age (Figure 8; Table 5). For persons aged <14 years, unintentional injury accounts for approximately 40% of nonfatal firearm-related injuries where the intent of the injury had been determined (Figure 5). Nonfatal Firearm-Related Injuries, by Injury Characteristics and Circumstances of the Incident Intentionally self-inflicted nonfatal injuries predominantly involved gunshot wounds to the head or neck (Figure 9; Table 6). In contrast, for firearm-related assaults and those of undetermined intent, approximately 15% were gunshot wounds to the head or neck, and >30% were gunshot wounds to the leg or foot. For unintentional nonfatal injuries, >70% were gunshot wounds to the legs or arms (Figure 9; Table 6). Additionally, >70% of unintentional nonfatal injuries were self-inflicted (Table 6). Other characteristics of overall nonfatal firearm-related injuries, in all intent categories, were
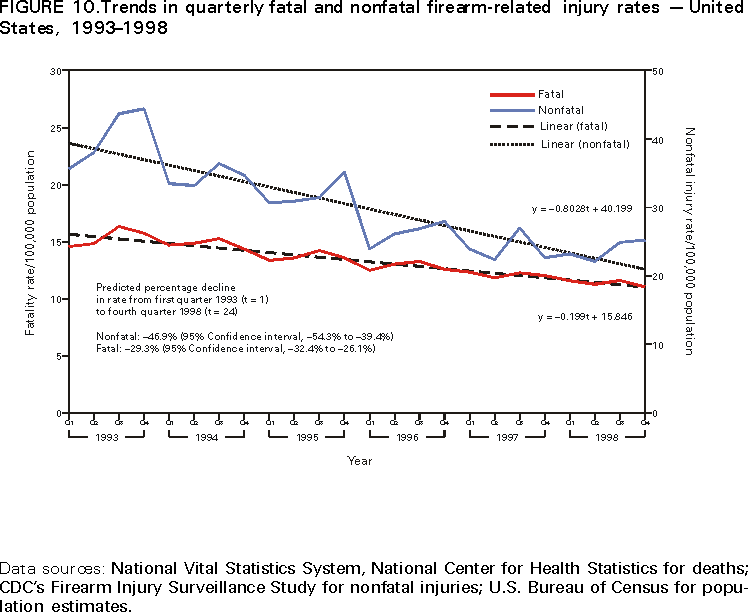
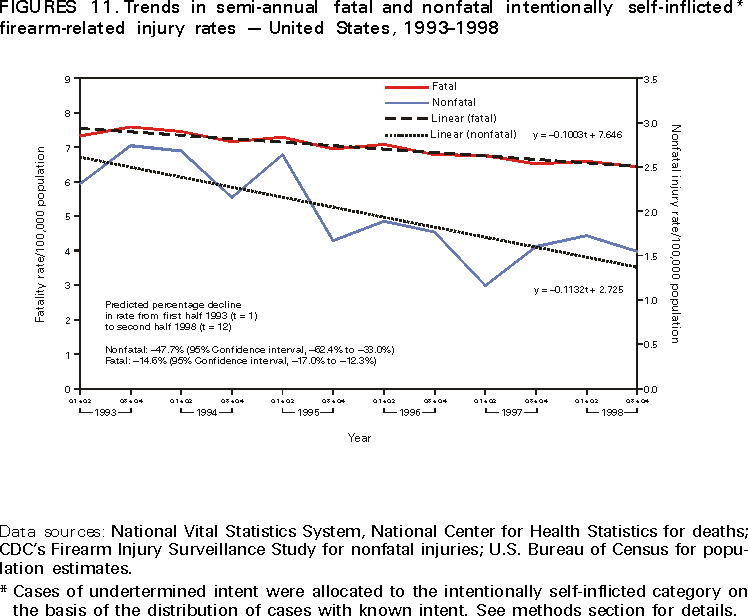
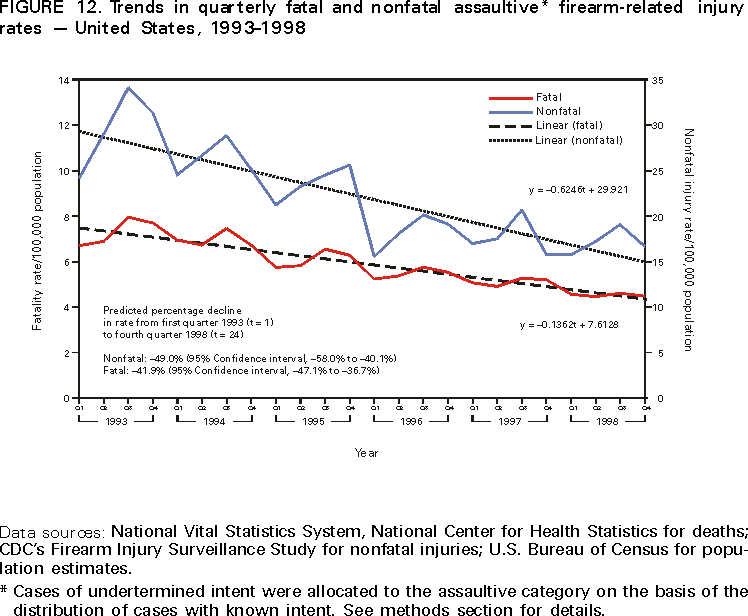
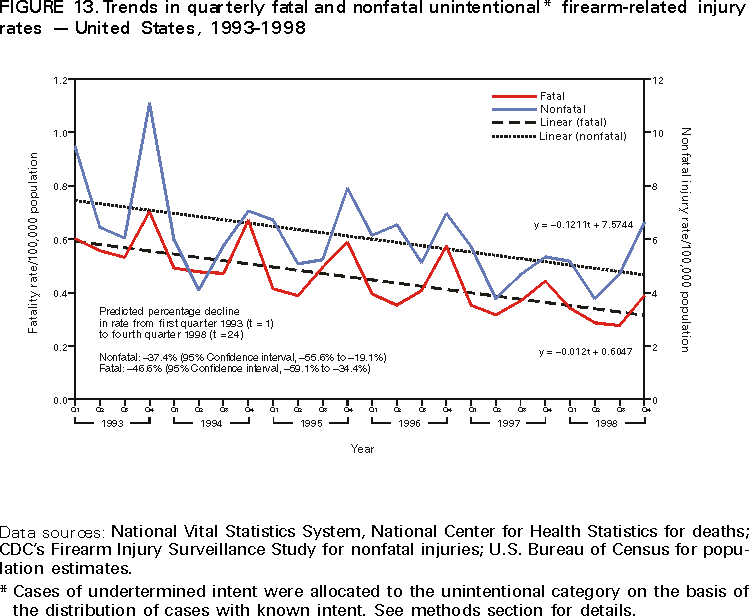
Temporal Trends in Fatal and Nonfatal Firearm-Related Injuries Based on linear regression analysis of quarterly rates, both fatal and nonfatal firearm-related injury rates declined significantly during 1993--1998. The fatality rate declined 29%, and the nonfatal rate declined 47% during this period (p < 0.01) (Figure 10). The extent of the decline in fatal and nonfatal rates varied by intent of injury. For firearm-related deaths, the suicide rate dropped approximately 15%, compared with 42% for the homicide rate and 47% for the unintentional rate (Figures 11--13).*** For nonfatal firearm-related injuries, the suicide attempt rate declined 48%, compared with 49% for the assault rate and 37% for the unintentional rate (Figures 11--13). DISCUSSIONIn this report, data from two national data systems, NVSS and NEISS, were used to provide a comprehensive 6-year representation of fatal and nonfatal firearm-related injuries in the United States. These data demonstrate that firearm-related injury rates steadily declined during 1993--1998, including unintentional, assault-related and intentionally self-inflicted injuries. Although firearm-related injuries among teenagers and young adults were predominantly associated with interpersonal violence, a majority of firearm-related injuries among older adults were intentionally self-inflicted. Nonfatal injuries that were intentionally self-inflicted predominantly involved wounds to the head or neck compared with other types of injury that were most often to the extremities. These self-inflicted gunshot wounds potentially represent more life-threatening injuries with long-term sequelae (6). Although black males aged 15--24 years had the highest fatal and nonfatal rates, firearm-related injuries occurred among all segments of the U.S. population as defined by race/ethnicity, age, and sex. Although fatal and nonfatal firearm-related injury rates have dropped substantially during 1993--1998, firearm-related injury continues to be a public health concern. In 1998, approximately 31,000 U.S. residents died from gunshot wounds, and another 64,000 were treated for nonfatal wounds in U.S. hospital EDs. In 1998, firearm-related injuries were the second leading cause of injury death in the United States after motor-vehicle--related deaths (3). Firearms were associated with 65.9% of homicides and 57.0% of suicides among U.S. residents. Although the percentage of firearm-related deaths that were unintentional was limited (i.e., <4% of deaths), approximately one fifth of nonfatal firearm-related injuries treated in U.S. hospital EDs were unintentional. Certain limitations are associated with using NEISS data to examine nonfatal firearm-related injuries in the United States. NEISS only provides national estimates and does not allow for estimating by region, state, or local jurisdictions. NEISS data are based solely on information provided in the ED record and are not linked to criminal justice, police, or other data sources to supplement or verify information regarding the intent of injury. Also, information regarding locale where the injury occurred, victim-offender relationship, and type of firearm involved was missing for approximately half of the NEISS cases. Limitations occur also in using NVSS data to examine fatal firearm-related injuries. NVSS data are based on information recorded on death certificates. Data on victim-offender relationship are rarely recorded. Space is provided on the death certificate to record locale where the injury occurred and type of firearm used, but these items might not be recorded. Public health efforts through surveillance, research, and prevention programs need to be expanded to further reduce firearm-related injuries. Efforts are under way to improve the availability of surveillance data on firearm-related injuries. CDC is collaborating with other public health organizations and federal agencies to implement the National Violent Death Reporting System, which will include information on all homicides and suicides, as well as all firearm-related deaths of known and undetermined intent. Only basic national- and state-level data are available regarding firearm-related deaths and injuries on which to base policies and practice. The benefits of a state-based, national reporting system to track the incidence and characteristics of a health condition have been well-established in other areas (e.g., infectious diseases and motor-vehicle safety). As a result, the Institute of Medicine has recommended a national data system for homicides and suicides that would provide objective data with which to monitor trends and evaluate the effectiveness of prevention programs and policies (17). Additionally, with funding from five private foundations, the Harvard Injury Control Research Center (HICRC) has launched the National Firearm Injury Statistics System (NFISS). HICRC is collaborating with the Medical College of Wisconsin, state and local grantees (i.e., Connecticut, Maine, Maryland, Michigan, Utah, and Wisconsin; and locally in Allegheny County [Pennsylvania], metropolitan Atlanta [Georgia], and San Francisco [California]); and others to design and pilot firearm-related injury-reporting systems at the state and local levels. NFISS builds on a model developed by the Medical College of Wisconsin and draws from four major reporting sources: death certificates, coroner/medical examiner reports, police supplementary homicide reports (and, in certain jurisdictions, incident reports), and crime laboratory data. NFISS collaborators have developed uniform data elements for fatal firearm-related injuries, which are detailed in a manual, and the software architecture for the system (18). The overall percentage decline in fatal and nonfatal firearm-related injury rates in the U.S. population during 1993--1998 is consistent with a 27% decrease in violent crime during the same time period (19). Since 1950, unintentional fatal firearm-related injury rates have declined. NEISS data also indicate a decline since 1993 in the rate of nonfatal unintentional firearm-related injuries treated in hospital EDs. The majority of these nonfatal injuries occurred among males aged 15--44 years, were self-inflicted, and were associated with hunting, target shooting, and routine gun handling (i.e., cleaning, loading, or unloading a gun) (4). Additional investigations should focus on factors that might have contributed to the decrease (e.g., gun safety courses and information campaigns, the proportion of the population that uses guns for recreational purposes, and legislation). Certain factors might have contributed to the decrease in both fatal and nonfatal assaultive firearm-related injury rates. Possible contributors include improvements in economic conditions; aging of the population; decline of the cocaine market; changes in legislation, sentencing guidelines, and law-enforcement practices; and improvements associated with violence prevention programs (20). However, the importance and relative contribution of each of these factors have not been determined, and the reasons are not known for the declines in firearm-related suicide and suicide attempt rates. Research to understand the trends in firearm-related homicides and injuries from assaults has focused on the role of the lethality of firearms, demographic changes, economic factors, imprisonment, and drug markets (20). Each of these factors might have played a role in the increases in firearm-related homicides occurring before 1993 and the declines, documented in this report, since that time (20). Research is needed to understand factors that contribute to racial and ethnic disparities in fatal and nonfatal firearm-related injuries and to identify prevention efforts to reduce these disparities. Evaluations of policies and programs that have the potential to further decrease these injuries are needed (21). AcknowledgmentsWe express our appreciation to the following CDC staff: Daniel M. Sosin, M.D., M.P.H., Jennifer H. Madans, Ph.D., and Lois A. Fingerhut, M.A., for their helpful review and comments; Patricia Holmgreen, M.S., and Kevin W. Webb for computer programming assistance; and Marilyn L. Kirk and Mary Ann Braun for preparing the figures. We also express appreciation to Arthur K. McDonald, M.A., Director, and Thomas J. Schroeder, M.S., Statistician and Project Officer, Division of Hazard and Injury Data Systems; and other staff of the U.S. Consumer Product Safety Commission for their diligence in providing high-quality surveillance data regarding nonfatal firearm-related injuries by using the National Electronic Injury Surveillance System. References
** On the ED record, frequently, only one entry is available for race or ethnicity, not for both. The classification scheme used in this report assumed that most white Hispanics were likely to be recorded on the ED record as Hispanic and most black Hispanics were likely to be recorded as black. ***Semiannual rates, rather than quarterly rates, were used for trend analysis of firearm-related suicides and suicide attempts because of the limited number of nonfatal firearm-related suicide attempts.
|
|||||||||
This page last reviewed 5/2/01
|