|
|
|
|
|
|
|
| ||||||||||
|
|
|
|
|
|
|
||||
| ||||||||||
|
|
|
|
|
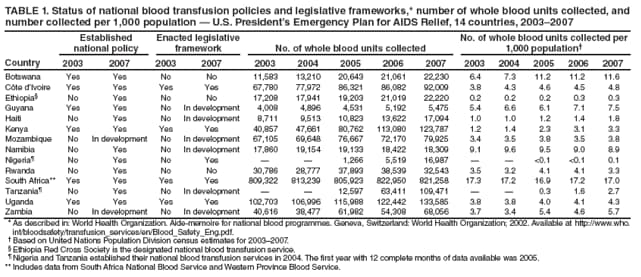
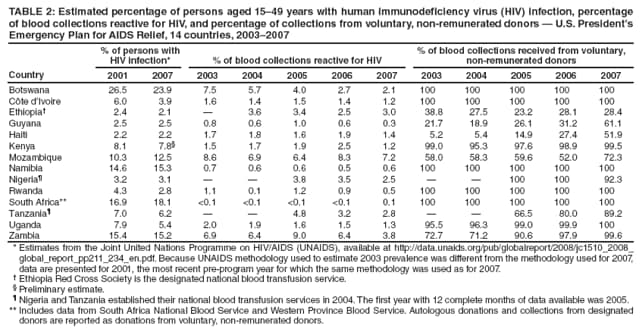
Persons using assistive technology might not be able to fully access information in this file. For assistance, please send e-mail to: mmwrq@cdc.gov. Type 508 Accommodation and the title of the report in the subject line of e-mail. Progress Toward Strengthening Blood Transfusion Services ---14 Countries, 2003--2007Nearly all persons transfused with human immunodeficiency virus (HIV)-infected blood become infected (1--3), and blood transfusions are a substantial source of HIV transmission in sub-Saharan Africa, especially among women and children (4,5). Since 2004, the U.S. President's Emergency Plan for AIDS Relief (PEPFAR) has provided technical and financial support to strengthen national blood transfusion services in 14 countries in Africa and the Caribbean with high prevalence of HIV infection.* PEPFAR has supported efforts to improve blood supply adequacy and safety by providing policy guidance, strengthening laboratory infrastructure, and enhancing blood donor recruitment and retention practices. To assess the progress made by these countries with PEPFAR support, CDC analyzed data collected by national blood transfusion services in the 14 countries during 2003--2007. This report summarizes the results of that analysis, which found that 1) national policies had been established in 12 of the 14 countries; 2) the number of whole blood units collected had increased in all 14 countries; 3) the percentage of collections from voluntary, non-remunerated donors† had increased; and 4) the percentage of collected blood units reactive for HIV had decreased in 13 of the 14 countries. Since the start of the PEPFAR initiative, progress toward improving safe and adequate supplies of blood has been made in the 14 countries with high prevalence of HIV infection. Global Blood SafetyGlobally, approximately 80 million units of blood are donated each year (6). Of this total, 2 million units are donated in sub-Saharan Africa, where the need for blood transfusions is great because of maternal morbidity, malnutrition, and a heavy burden of infectious diseases such as malaria. In 2004, blood collections in most of the 14 PEPFAR-supported countries did not satisfy clinical demand. Inadequacy of the blood supply in many African countries was compounded by inconsistent laboratory screening for HIV infection and collection of blood from donors at greater risk for HIV infection (6). Collections often were coordinated by hospital-based services that frequently relied on paid donors or replacement donors (e.g., family members of patients) who typically were at greater risk for HIV infection and, because of external pressures to donate, might not have revealed their behavioral risks for HIV during donor selection (4,7,8). HIV screening of donor blood in nonstandardized laboratories without quality assurance further increased the risk for transfusion-associated HIV transmission (4). In resource-limited settings, blood is collected most commonly in whole blood units. The World Health Organization (WHO) estimates that resource-limited countries should begin to fulfill baseline clinical demand if 10--20 whole blood units per 1,000 population are collected each year (9). To improve blood supply adequacy and transfusion safety, WHO has recommended that resource-limited countries adopt comprehensive national policies for national blood transfusion services§ (5). PEPFAR IndicatorsIn 2006, a team of international blood safety experts developed a set of indicators to support routine monitoring and evaluation of PEPFAR projects. Indicator data related to blood supply adequacy and safety are compiled by staff members at regional centers where blood is collected, screened, and distributed. Collectively, these regional centers make up each national blood transfusion service. On a regular basis, data are transferred to national blood transfusion service headquarters; these data are aggregated quarterly and shared with CDC, which uses them for ongoing programmatic evaluation. In 2008, national blood services in the 14 countries transferred data for the period 2003--2007¶ to CDC, where the data were analyzed by country and by year. The four indicators analyzed for this report address key elements in the WHO recommendations: 1) status of national policies and legislative frameworks for national blood transfusion services; 2) percentage of blood collections from voluntary, non-remunerated donors; 3) number of whole blood units collected and number collected per 1,000 population**; and 4) percentage of blood collections reactive for HIV. In 2003, national policies to ensure the adequacy and safety of the blood supply were in place in six of the 14 countries, and national blood transfusion services were operating under a legislative framework in four of the 14 countries. By 2007, national policies had been established in six more countries and were in development in the two remaining countries; legislative frameworks to support the national policies had been enacted in one additional country and were in development in six other countries (Table 1). During 2003--2007, national blood transfusion services in all 14 countries had increased total collections of whole blood units and, in 11 countries, had increased collection rates per 1,000 population. In 2003, collections in South Africa were already within the WHO-recommended range of 10--20 whole blood units per 1,000 population. By 2007, the collection rate in Botswana also was within that range (Table 1). In 2003, in five of the 14 countries, 100% of blood collections by national blood transfusion services were from voluntary, non-remunerated donors. By 2007, the number of countries meeting this criterion had increased to six. In addition, by 2007, the percentage of collections from such donors had increased in six other countries (Table 2). In 13 of the 14 countries, the percentage of collected blood units that were HIV reactive in 2007 had decreased from the first year of reporting (Table 2). Reported by: J Pitman, MPH, L Marum, MD, Global AIDS Program; S Basavaraju, MD, A McIntyre, PhD, EIS officers, CDC. Editorial Note:This report marks the first analysis of PEPFAR indicators to assess progress in blood supply adequacy and blood transfusion safety in the 14 resource-limited countries targeted by PEPFAR. By providing legislative authority to national blood transfusion services, governments have taken action to improve blood supply adequacy, avert transfusion-transmitted HIV infections, and sustain blood safety programs. Increases in the number of whole blood units collected by national blood transfusion services in all 14 countries indicate improved adequacy of blood supplies. Increasing the amount of blood supplied to health-care facilities also reduces the need for hospitals to collect from replacement donors, which reduces the risk for HIV transmission (8). In addition to implementing universal HIV screening of donated blood units, the risk for HIV transmission can be decreased further by restricting blood donations to volunteer, non-remunerated donors. Human error can occur during screening, laboratory false negatives for HIV can occur, and transmission from the donor can occur during the window period (i.e., the interval after infection during which an HIV test might be nonreactive because neither the p24 antigen nor antibodies are at detectable levels) (4). In certain countries, a decrease in the percentage of the population with HIV infection might have contributed to a decrease in the percentage of collected blood units reactive for HIV. However, the continued decrease in HIV reactivity among collected blood units in countries with high prevalence of HIV infection suggests that an improved process for selecting donors is in place. Since 2004, PEPFAR technical assistance has included training of blood donor recruiters and development of standardized behavioral risk questionnaires with more stringent criteria for excluding donors. These measures might have contributed to reductions in the percentage of collected blood units reactive for HIV even in countries where 100% of blood collections are from voluntary, non-remunerated donors. To improve safety further, national blood transfusion services are working to retain voluntary, non-remunerated donors through comprehensive behavioral and educational HIV prevention programs that encourage healthy lifestyles. One example is Club 25, in which participants pledge to donate blood 20 times by age 25 years or to make 25 lifetime donations.†† The findings in this report are subject to at least two limitations. First, totals of whole blood unit collections did not include blood units collected outside of national blood transfusion service networks. These outside collections are not quantifiable; as a result, national estimates of blood unit collections per 1,000 population likely are underestimated. Second, national blood services have different algorithms for screening donor blood, which include combined p24 antigen and HIV antibody assays and, in certain countries, nucleic acid testing. Although these assays have comparable sensitivities and specificities, they differ in window periods before detection of recent HIV infection (10). Screening assays with shorter window periods might identify more reactive units, resulting in higher percentages of HIV reactivity; however, the differences in window periods are relatively small and likely to produce only minimal effects on the results of this analysis. PEPFAR has supported efforts to address the WHO recommendations for national blood transfusion services, including facilitation of technical meetings, publication of country-specific blood safety program policies and guidelines, and collaborations with ministries of health to enact appropriate legislation. National blood transfusion services and donor recruitment organizations have worked together to increase collections of blood from voluntary, non-remunerated donors. Other efforts have focused on supplying laboratory equipment and providing training to standardize quality-assured HIV screening. National blood transfusion services now screen donor blood using combined p24 antigen and HIV antibody assays; Namibia and South Africa also screen using nucleic acid testing. Substantial progress has occurred toward improving blood transfusion services in the 14 PEPFAR-supported countries with high prevalence of HIV infection. With reauthorization of PEPFAR by Congress in July 2008, national blood transfusion services in the supported countries will continue to work toward improving the adequacy and safety of blood supplies. Acknowledgments This report is based on contributions by national blood transfusion services in 14 PEPFAR-supported countries and their respective CDC Global AIDS Program country offices and PEPFAR-funded technical assistance partners. References
* Botswana, Côte d'Ivoire, Ethiopia, Guyana, Haiti, Kenya, Mozambique, Namibia, Nigeria, Rwanda, South Africa, Tanzania, Uganda, and Zambia. PEPFAR has directly funded national blood transfusion services in all 14 countries though CDC cooperative agreements. † Persons who donate blood solely for altruistic reasons and who receive no compensation. Designation of voluntary, non-remunerated status was determined by blood center staff members based on national blood policy. § Key elements of WHO recommendations are 1) establishment of a nationally coordinated blood transfusion service empowered by a legislative framework; 2) collection of blood exclusively from voluntary, non-remunerated donors; 3) implementation of universal, quality-assured HIV screening of donor blood; and 4) reduction of unnecessary blood transfusions. ¶ Nigeria and Tanzania established their national blood transfusion services in 2004; the first year with 12 complete months of data available was 2005. In Ethiopia, data were available on blood collections and voluntary, non-remunerated donors beginning in 2003 and on HIV reactivity beginning in 2004. ** Based on United Nations Population Division census estimates for 2003--2007. †† Additional information available at http://www.ifrc.org/youth/activities/club25/index.asp and http://africanclub25society.com/main.htm. Table 1
All MMWR HTML versions of articles are electronic conversions from typeset documents. This conversion might result in character translation or format errors in the HTML version. Users are referred to the electronic PDF version (http://www.cdc.gov/mmwr) and/or the original MMWR paper copy for printable versions of official text, figures, and tables. An original paper copy of this issue can be obtained from the Superintendent of Documents, U.S. Government Printing Office (GPO), Washington, DC 20402-9371; telephone: (202) 512-1800. Contact GPO for current prices. **Questions or messages regarding errors in formatting should be addressed to mmwrq@cdc.gov.Date last reviewed: 11/26/2008 |
|||||||||
|