 |
|
|
|
|
|
|
| ||||||||||
|
|
|
|
|
|
|
||||
| ||||||||||
|
|
|
|
|
Persons using assistive technology might not be able to fully access information in this file. For assistance, please send e-mail to: mmwrq@cdc.gov. Type 508 Accommodation and the title of the report in the subject line of e-mail. Update: Influenza Activity --- United States, September 30, 2007--April 5, 2008, and Composition of the 2008--09 Influenza VaccineThis report summarizes U.S. influenza activity* since September 30, 2007, the start of the 2007--08 influenza season, and updates the previous summary (1). Low levels of influenza activity were reported from October through early December. Activity increased from mid-December and peaked in mid-February. Viral SurveillanceDuring September 30, 2007--April 5, 2008,† World Health Organization (WHO) and National Respiratory and Enteric Virus Surveillance System (NREVSS) collaborating laboratories in the United States reported testing 185,938 specimens for influenza viruses, and 34,380 (18.5%) tested positive (Figure 1). Of these, 25,456 (74.0%) were influenza A viruses, and 8,924 (26.0%) were influenza B viruses. A total of 7,715 (30.3%) of the 25,456 influenza A viruses have been subtyped: 2,110 (27.3%) were influenza A (H1N1) viruses, and 5,605 (72.7%) were influenza A (H3N2) viruses. The percentage of specimens testing positive for influenza first exceeded 10% during the week ending January 12 and peaked at 32.0% during the week ending February 16. For the week ending April 5, 13.2% of specimens tested for influenza were positive. Although influenza A (H1N1) viruses predominated through mid-January, the proportion of reported influenza viruses that were A (H3N2) viruses increased rapidly during January, and during the week ending January 26, influenza A (H3N2) became the predominant virus for the season overall. This season, more influenza A viruses than influenza B viruses have been identified in all surveillance regions. However, for weeks 13 and 14 (March 23--April 5), more influenza B than influenza A viruses were reported. Among influenza A viruses, influenza A (H3N2) has predominated in the East North Central, East South Central, Mid-Atlantic, New England, South Atlantic, West North Central, and West South Central regions, and influenza A (H1N1) has predominated in the Mountain and Pacific regions. Composition of the 2008--09 Influenza VaccineThe Food and Drug Administration's Vaccines and Related Biological Products Advisory Committee recommended that the 2008--09 trivalent influenza vaccine for the United States contain A/Brisbane/59/2007-like (H1N1), A/Brisbane/10/2007-like (H3N2), and B/Florida/4/2006-like viruses. This represents a change in all three components from the 2007--08 influenza vaccine formulation used in the United States. These recommendations were based on antigenic analyses of recently isolated influenza viruses, epidemiologic data, post-vaccination serologic studies in humans, and the availability of candidate vaccine strains and reagents. Antigenic CharacterizationStates are requested to submit a subset of their influenza virus isolates to CDC for further antigenic characterization. Since September 30, 2007, CDC has antigenically characterized 608 influenza viruses submitted by WHO collaborating laboratories in the United States: 290 influenza A (H1N1), 161 influenza A (H3N2), and 157 influenza B viruses. A total of 200 (69%) of 290 influenza A (H1N1) viruses were characterized as A/Solomon Islands/3/2006-like, the influenza A (H1N1) component of the 2007--08 influenza vaccine for the Northern Hemisphere, and 70 (24%) were characterized as A/Brisbane/59/2007-like, the recommended H1N1 component of the 2008--09 Northern Hemisphere vaccine. Thirty-five (22%) of the 161 influenza A (H3N2) viruses were characterized as A/Wisconsin/67/2005-like, the influenza A (H3N2) component of the 2007--08 influenza vaccine for the Northern Hemisphere. One hundred fifteen (71%) of the 161 viruses were characterized as A/Brisbane/10/2007-like, the recommended influenza A (H3N2) component for the 2008 Southern Hemisphere and 2008--09 Northern Hemisphere vaccines. Influenza B viruses currently circulating can be divided into two antigenically distinct lineages represented by B/Victoria/02/87 and B/Yamagata/16/88. Eight (5%) of the 157 influenza B viruses characterized belong to the B/Victoria lineage of viruses. Six (75%) of these viruses from the B/Victoria lineage were characterized as B/Malaysia/2506/2004-like, the influenza B component of the 2007--08 influenza vaccine. One hundred forty-nine (95%) of the 157 influenza B viruses characterized belong to the B/Yamagata lineage. Outpatient Illness SurveillanceFor the week ending April 5, 2008, the percentage of outpatient visits for influenza-like illness (ILI)§ reported by approximately 1,400 U.S. sentinel providers in 50 states, Chicago, the District of Columbia, New York City, and the U.S. Virgin Islands was 1.7%, which was below the national baseline of 2.2%.¶ This season, the percentage of outpatient visits for ILI exceeded the national baseline for 13 consecutive weeks. The percentage of outpatient visits for ILI first exceeded baseline during the week ending December 29 and peaked at 5.9% during the week ending February 16. The percentage of outpatient visits for acute respiratory illness (ARI)** reported by approximately 350 U.S. Department of Defense (DoD) and 800 Department of Veterans Affairs (VA) BioSense†† outpatient treatment facilities for the week ending April 5 was 2.2%, which was below the national baseline of 3.2%§§ (Figure 2). State-Specific Activity LevelsDuring the week ending April 5, 2008, influenza activity was reported as widespread¶¶ in six states (Connecticut, Maine, Maryland, New York, Pennsylvania, and Vermont) (Figure 3). In addition, regional activity was reported by 11 states (Alaska, California, Colorado, Hawaii, Illinois, Iowa, Massachusetts, New Jersey, North Dakota, Oregon, and Washington); local influenza activity was reported by 23 states (Alabama, Arizona, Georgia, Idaho, Indiana, Kentucky, Louisiana, Michigan, Minnesota, Montana, Nebraska, Nevada, New Hampshire, New Mexico, North Carolina, Ohio, Rhode Island, South Carolina, South Dakota, Texas, Utah, Virginia, and Wyoming); and sporadic activity was reported by the District of Columbia and 10 states (Arkansas, Delaware, Florida, Kansas, Mississippi, Missouri, Oklahoma, Tennessee, West Virginia, and Wisconsin). Activity peaked during weeks 7 and 8 (February 10--23), when 49 states reported widespread influenza activity and one state reported regional activity. Influenza-Associated Pediatric HospitalizationsPediatric hospitalizations associated with laboratory-confirmed influenza infections are monitored by two population-based surveillance networks, the Emerging Infections Program (EIP) and the New Vaccine Surveillance Network (NVSN). During November 4, 2007--March 22, 2008, the preliminary laboratory-confirmed influenza-associated hospitalization rate reported by NVSN for children aged 0--4 years was 5.61 per 10,000. During September 30, 2007--March 29, 2008, EIP sites reported a preliminary laboratory-confirmed influenza-associated hospitalization rate of 1.32 per 10,000 for children aged 0--17 years. For children aged 0--4 years, the rate was 3.47 per 10,000, and for children aged 5--17 years, the rate was 0.45 per 10,000. Differences in the rate estimates between the NVSN and the EIP systems likely result from the different case-finding methods and the different populations monitored.*** Pneumonia and Influenza-Related MortalityPneumonia and influenza (P&I) was listed as an underlying or contributing cause of death for 8.9% of all deaths reported through the 122 Cities Mortality Reporting System for the week ending April 5, 2008. This percentage was above the epidemic threshold of 6.9% for the week††† and marked the thirteenth consecutive week that the proportion of all deaths attributed to P&I was above the epidemic threshold (Figure 4). The proportion of deaths from P&I exceeded the epidemic threshold during week ending January 5 and peaked at 9.1% during the week ending March 15. Influenza-Related Pediatric MortalityDuring September 30, 2007--April 5, 2008, a total of 65 pediatric deaths among children aged <18 years associated with laboratory-confirmed influenza were reported from 26 states, New York City, and Chicago through the National Notifiable Diseases Surveillance System. The median age of decedents was 4.5 years (range: 1 month to 17.8 years). During the preceding three influenza seasons, the total number of influenza-related pediatric deaths reported to CDC ranged from 46 to 74. Resistance to Antiviral MedicationsDuring this influenza season, an increase in the number of influenza viruses resistant to the neuraminidase inhibitor, oseltamivir, has been observed. Among the 1,153 influenza A and B viruses tested during the 2007--08 influenza season, to date, 84 (8.3%) have been found to be resistant to oseltamivir. All the oseltamivir-resistant viruses have been influenza A (H1N1) viruses and have been determined to share the same genetic mutation that confers oseltamivir resistance. These 84 viruses represent 10.2% of the 824 influenza A (H1N1) viruses that have been tested, an increase from four (0.7%) of 588 influenza A (H1N1) viruses tested during the 2006--07 season. No resistance to oseltamivir has been identified among the 194 influenza A (H3N2) or the 135 influenza B viruses tested, and no antiviral resistance to zanamivir has been detected in any influenza A or B viruses. Resistance to adamantanes (amantadine and rimantadine) continues to be high among influenza A viruses. Of 261 influenza A (H3N2) viruses tested, 260 (99.6%) were resistant to adamantanes. Adamantane resistance among influenza A (H1N1) viruses also has been detected, but at a lower level. Of 729 influenza A (H1N1) viruses tested, 81 (11.1%) were resistant to adamantanes. The adamantanes have no activity against influenza B viruses. Based on the level of oseltamivir resistance observed in only one influenza A subtype (H1N1), persisting high levels of resistance to adamantanes in A (H3N2) viruses, and the predominance of A (H3N2) viruses circulating in the United States during the 2007--08 season with co-circulation of influenza B viruses, CDC continues to recommend the use of oseltamivir and zanamivir for the treatment or chemoprophylaxis of influenza (2). Use of amantadine or rimantadine is not recommended. Reported by: World Health Organization Collaborating Center for Surveillance, Epidemiology, and Control of Influenza; C Dao, MPH, L Blanton, MPH, S Epperson, MPH, L Brammer, MPH, L Finelli, DrPH, T Wallis, MS, T Uyeki, MD, J Bresee, MD, A Klimov, PhD, N Cox, PhD, Influenza Div, National Center for Immunization and Respiratory Diseases, CDC. Editorial Note:By some indicators, this influenza season has been more severe than the previous three seasons. Influenza activity in the United States remained low until January, peaked in mid-February, and decreased thereafter. For the week ending April 5, 2008, widespread activity was reported in six states, and regional activity was reported in 11 states, a decrease from mid-February, when 49 states reported widespread activity and one state reported regional activity. During peak activity of the previous three influenza seasons, the number of states reporting widespread or regional activity ranged from 41 to 49 states. During the 2007--08 season, the percentage of outpatient visits for ILI peaked at 5.9%, exceeded the national baseline for 13 consecutive weeks, and declined to 1.7% during the week ending April 5. During the previous three influenza seasons, the peak percentage of visits for ILI ranged from 3.2% to 5.4% and exceeded baseline levels for 14 to 16 consecutive weeks. To date, the percentage of deaths attributable to P&I peaked at 9.1% and exceeded the epidemic threshold for 13 consecutive weeks this season. For the week ending April 5, the proportion of deaths attributable to P&I was 8.9%. During the previous three seasons, the peak percentage of deaths attributable to P&I ranged from 7.7% to 8.9%, and the total number of weeks above the epidemic threshold ranged from 1 to 11 consecutive weeks. P&I mortality is higher this season than the previous three seasons, which were mild. The 2007--08 season is similar to the 2003--04 season, when the percentage of deaths attributable to P&I peaked at 10.4% and the number of consecutive weeks above the epidemic threshold was 9 weeks. Influenza A (H1N1) viruses predominated through mid-January, but influenza A (H3N2) viruses were more frequently identified than influenza A (H1N1) viruses since late January and have predominated overall. The majority of influenza A (H1N1) viruses were characterized as A/Solomon Islands/3/2006, the influenza A (H1N1) component of the 2007--08 influenza vaccine for the Northern Hemisphere. To date, the majority of influenza A (H3N2) and influenza B viruses were characterized as A/Brisbane/10/2007 and B/Florida/04/2006, respectively, the recommended influenza A (H3N2) and influenza B components of the 2008--09 influenza vaccine for the Northern Hemisphere. Clinical vaccine effectiveness cannot be accurately predicted using these data. A case-control study to estimate the effectiveness of trivalent inactivated influenza vaccine was conducted this season in Marshfield, Wisconsin. Preliminary results from subjects enrolled during January 21--February 8 show an overall vaccine effectiveness of 44%, suggesting that vaccination provided substantial protection against influenza-associated, medically attended illness in the study population, despite the suboptimal vaccine match (3). These preliminary results are similar to previous studies, which have shown that influenza vaccination provides measurable protection against influenza illness and influenza-related complications and death, even when vaccine strains are antigenically distinct from circulating strains (4--7). As a supplement to influenza vaccination, antiviral drugs have aided in the control and prevention of influenza. Recent studies have identified a considerable protective effect of oseltamivir treatment against complications associated with influenza (8), including death among older adults hospitalized with laboratory-confirmed influenza (9). This season, resistance to the influenza antiviral drug oseltamivir among influenza A (H1N1) viruses (84 [10.2%] of 824 tested) has been detected. All 84 resistant influenza A (H1N1) viruses identified in the United States this season share the same genetic mutation; this mutation is the most common mutation in this subtype that confers resistance to oseltamivir. Increased resistance to oseltamivir among influenza A (H1N1) viruses has been reported from many countries this season (10). No oseltamivir resistance has been detected among influenza A (H3N2) or B viruses currently circulating in the United States. Given the low level of resistance to oseltamivir, the finding of resistance only in some influenza A (H1N1) viruses, and no resistance to zanamivir, these drugs continue to be recommended for the treatment and prophylaxis of influenza (2). Although recommendations for use of antiviral medications have not changed, enhanced surveillance for detection of oseltamivir-resistant influenza viruses is ongoing and will enable continued monitoring of changing trends over time. In addition to vaccination and antivirals, other means of decreasing the spread and impact of influenza include staying home from work or school when ill, avoiding others who are sick, covering the nose or mouth with a tissue when coughing or sneezing, and frequent hand washing. Additional information is available at http://www.cdc.gov/flu/protect/habits.htm. Influenza surveillance reports for the United States are posted online weekly during October--May and are available at http://www.cdc.gov/flu/weekly/fluactivity.htm. Additional information regarding influenza viruses, influenza surveillance, the influenza vaccine, and avian influenza is available at http://www.cdc.gov/flu. Acknowledgments This report is based on data contributed by participating state and territorial health departments and state public health laboratories, World Health Organization collaborating laboratories, National Respiratory and Enteric Virus Surveillance System collaborating laboratories, the U.S. Influenza Sentinel Provider Surveillance System, the U.S. Department of Veterans Affairs/U.S. Department of Defense BioSense Outpatient Surveillance System, the New Vaccine Surveillance Network, the Emerging Infections Program, and the 122 Cities Mortality Reporting System. References
* The CDC influenza surveillance system collects five categories of information from 10 data sources. Viral surveillance: U.S. World Health Organization collaborating laboratories, the National Respiratory and Enteric Virus Surveillance System, and novel influenza A virus case reporting. Outpatient illness surveillance: U.S. Influenza Sentinel Provider Surveillance Network and the U.S. Department of Veterans Affairs/U.S. Department of Defense BioSense Outpatient Surveillance System. Mortality: 122 Cities Mortality Reporting System and influenza-associated pediatric mortality reports. Hospitalizations: Emerging Infections Program and New Vaccine Surveillance Network. Summary of geographic spread of influenza: state and territorial epidemiologist reports. † Data as of April 5, 2008. § Defined as a temperature of >100.0°F (>37.8°C), oral or equivalent, and cough and/or sore throat, in the absence of a known cause other than influenza. ¶ The national and regional baselines are the mean percentage of visits for ILI during noninfluenza weeks for the previous three seasons plus two standard deviations. A noninfluenza week is a week during which <10% of specimens tested positive for influenza. National and regional percentages of patient visits for ILI are weighted on the basis of state population. Use of the national baseline for regional data is not appropriate. ** Based on International Classification of Diseases, Ninth Revision codes for ARI: 460-66 and 480-88. †† BioSense is a national surveillance system that receives, analyzes, and evaluates health data from multiple sources, include 1) approximately 1,150 VA/DoD hospitals and ambulatory-care clinics; 2) multihospital systems, local hospitals, and state and regional syndromic surveillance systems in 37 states; and 3) Laboratory Corporation of America (LabCorp) test results. §§ The national, regional, and age-specific baselines are the mean percentage of visits for ARI during noninfluenza weeks for the previous three seasons plus two standard deviations. A noninfluenza week is a week during which <10% of specimens tested positive for influenza. Use of a national baseline for regional data is not appropriate. ¶¶ Levels of activity are 1) no activity; 2) sporadic: isolated laboratory-confirmed influenza cases or a laboratory-confirmed outbreak in one institution, with no increase in activity; 3) local: increased ILI , or at least two institutional outbreaks (ILI or laboratory-confirmed influenza) in one region with recent laboratory evidence of influenza in that region (virus activity no greater than sporadic in other regions); 4) regional: increased ILI activity or institutional outbreaks (ILI or laboratory-confirmed influenza) in at least two but less than half of the regions in the state with recent laboratory evidence of influenza in those regions; and 5) widespread: increased ILI activity or institutional outbreaks (ILI or laboratory-confirmed influenza) in at least half the regions in the state with recent laboratory evidence of influenza in the state. *** NVSN conducts surveillance in Monroe County, New York; Hamilton County, Ohio; and Davidson County, Tennessee. NVSN provides population-based estimates of laboratory-confirmed influenza hospitalization rates in children aged <5 years admitted to NVSN hospitals with fever or respiratory symptoms. Children are prospectively enrolled, and respiratory samples are collected and tested by viral culture and reverse transcription--polymerase chain reaction (RT-PCR). EIP conducts surveillance in 60 counties associated with 12 metropolitan areas: San Francisco, California; Denver, Colorado; New Haven, Connecticut; Atlanta, Georgia; Baltimore, Maryland; Minneapolis/St. Paul, Minnesota; Albuquerque, New Mexico; Las Cruces, New Mexico; Albany, New York; Rochester, New York; Portland, Oregon; and Nashville, Tennessee. EIP conducts surveillance for laboratory-confirmed, influenza-related hospitalizations in persons aged <18 years. Hospital laboratory and admission databases and infection-control logs are reviewed to identify children with a positive influenza test (i.e., viral culture, direct fluorescent antibody assays, RT-PCR, or a commercial rapid antigen test) from testing conducted as a part of their routine care. ††† The expected seasonal baseline proportion of P&I deaths reported by the 122 Cities Mortality Reporting System is projected using a robust regression procedure in which a periodic regression model is applied to the observed percentage of deaths from P&I that occurred during the preceding 5 years. The epidemic threshold is 1.645 standard deviations above the seasonal baseline.
Figure 1 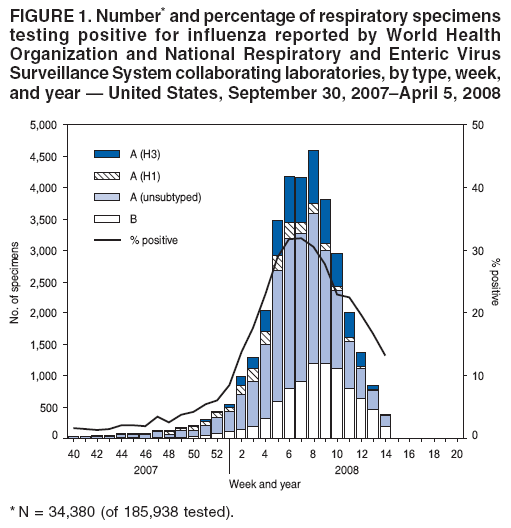 Return to top. Figure 2 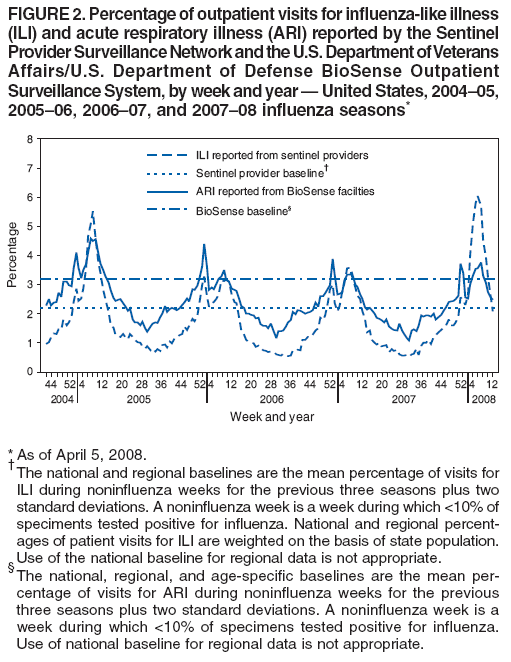 Return to top. Figure 3 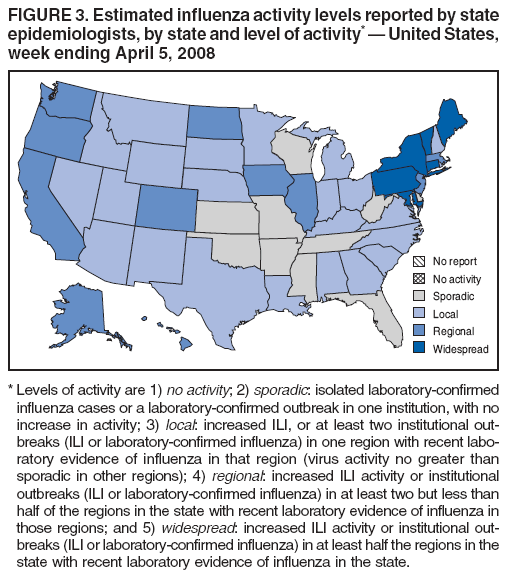 Return to top. Figure 4 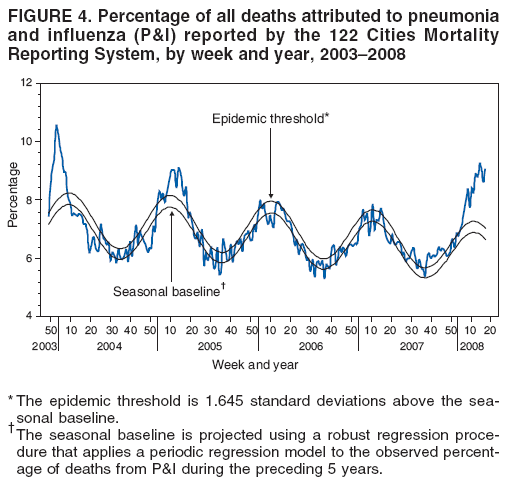 Return to top.
Disclaimer All MMWR HTML versions of articles are electronic conversions from ASCII text into HTML. This conversion may have resulted in character translation or format errors in the HTML version. Users should not rely on this HTML document, but are referred to the electronic PDF version and/or the original MMWR paper copy for the official text, figures, and tables. An original paper copy of this issue can be obtained from the Superintendent of Documents, U.S. Government Printing Office (GPO), Washington, DC 20402-9371; telephone: (202) 512-1800. Contact GPO for current prices. **Questions or messages regarding errors in formatting should be addressed to mmwrq@cdc.gov.Date last reviewed: 4/16/2008 |
|||||||||
|