|
|
|
|
|
|
|
| ||||||||||
|
|
|
|
|
|
|
||||
| ||||||||||
|
|
|
|
|
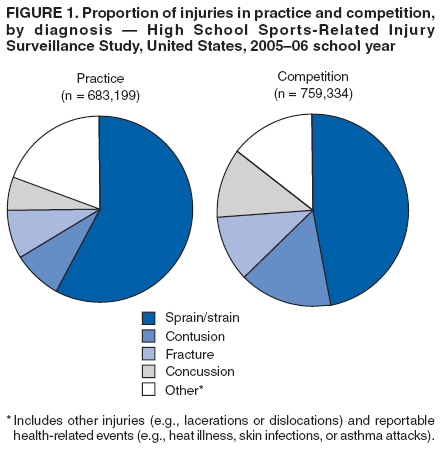
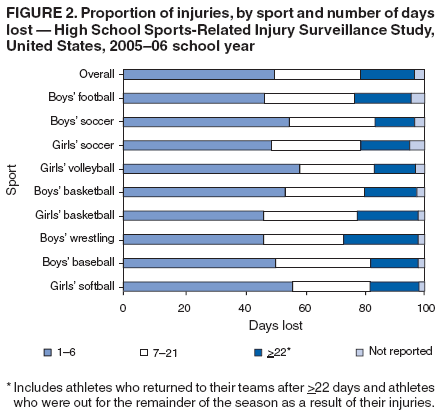
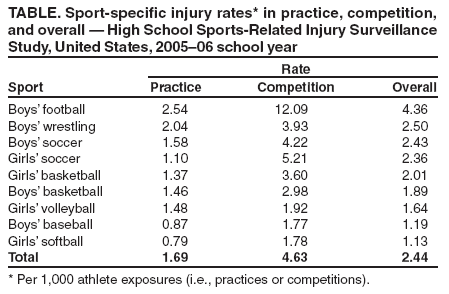
Persons using assistive technology might not be able to fully access information in this file. For assistance, please send e-mail to: mmwrq@cdc.gov. Type 508 Accommodation and the title of the report in the subject line of e-mail. Sports-Related Injuries Among High School Athletes --- United States, 2005--06 School YearParticipation in high school sports helps promote a physically active lifestyle. High school sports participation has grown from an estimated 4 million participants during the 1971--72 school year to an estimated 7.2 million in 2005--06 (1). However, despite the documented health benefits of increased physical activity (e.g., weight management, improved self-esteem, and increased strength, endurance, and flexibility) (2,3), those who participate in athletics are at risk for sports-related injuries (4,5). High school athletes account for an estimated 2 million injuries, 500,000 doctor visits, and 30,000 hospitalizations annually (6). To date, the study of these injuries has been limited by inabilities to calculate injury rates, compare results among groups, and generalize findings from small, nonrepresentative samples. During the 2005--06 school year, researchers at a children's hospital in Ohio used an Internet-based data-collection tool to pilot an injury surveillance system among athletes from a representative national sample of U.S. high schools. This report summarizes the findings of that study, which indicated that participation in high school sports resulted in an estimated 1.4 million injuries at a rate of 2.4 injuries per 1,000 athlete exposures (i.e., practices or competitions). Surveillance of exposure-based injury rates in a nationally representative sample of high school athletes and analysis of injury patterns can help guide activities aimed at reducing these injuries. The High School Sports-Related Injury Surveillance Study was sponsored by a CDC grant and conducted during the 2005--06 school year by the Center for Injury Research and Policy at Columbus Children's Hospital in Columbus, Ohio. One hundred U.S. high schools nationally representative of geographic location and school size were selected randomly from among schools that agreed to participate.* Certified athletic trainers (ATCs) affiliated with the National Athletic Trainers' Association (NATA) at each participating school reported injury incidence and athletic exposure data for student athletes participating in nine sports: baseball, football, and wrestling (for boys); softball and volleyball (for girls); and basketball and soccer (for boys and girls). Data were reported weekly via an Internet-based surveillance system. Injuries were defined as those 1) resulting from participation in an organized high school athletic practice or competition, 2) requiring medical attention from an ATC or a physician, and 3) restricting the athlete's participation for 1 or more days beyond the day of injury. An athlete exposure was defined as one athlete participating in one practice or competition during which the athlete was exposed to the possibility of athletic injury. Injury rates were calculated as the ratio of the number of injuries in a particular category (e.g., sport or practice versus competition) to the number of athlete exposures in that category. To calculate national estimates of the number of injuries, each reported injury was assigned a sample weight based on the inverse of the probability of the school's selection into the study (based on the total number of high schools in each of the eight sampling strata). If a school dropped out of the surveillance study, a replacement school from the same sampling stratum was enrolled. An estimated 1,442,533 injuries occurred among U.S. high school student athletes participating in practices or competitions for the nine sports studied. The overall (i.e., practice and competition) injury rate in all sports combined was 2.44 injuries per 1,000 athlete exposures (Table). Football had the highest injury rate (4.36 injuries per 1,000 athlete exposures) followed by wrestling (2.50), boys' (2.43) and girls' (2.36) soccer, and girls' basketball (2.01). Boys' basketball, volleyball, baseball, and softball each had injury rates of less than 2.0 injuries per 1,000 athlete exposures. In each sport, the injury rate was higher in competition than practice settings. Although boys' soccer had slightly higher injury rates than girls' soccer, and girls' basketball had slightly higher injury rates than boys' basketball, no statistically significant differences (p>0.05) by sex were observed for soccer and basketball. In each of the nine sports, approximately 80% of the reported injuries were new injuries as opposed to recurrences or complications from previous injuries. Types of injuries varied between practice and competition; for example, concussions and fractures occurred more commonly in competition than practice (Figure 1). The total numbers of injuries were similar for practice and competition; however, because fewer competitions are conducted than practices, the injury rates in competition were higher. Severity of injury, as measured by days lost from play, varied by sport. Overall, approximately half of the injuries reported resulted in <7 days lost; football, girls' basketball, and wrestling had greater proportions of injuries resulting in >7 days lost (Figure 2). No deaths were reported. Reported by: RD Comstock, PhD, Center for Injury Research and Policy, Columbus Children's Hospital, and Ohio State Univ; C Knox, MA, E Yard, MPH, Center for Injury Research and Policy, Columbus Children's Hospital, Columbus, Ohio. J Gilchrist, MD, Div of Unintentional Injury Prevention, National Center for Injury Prevention, CDC. Editorial Note:During the 2005--06 school year, an estimated 4.2 million students in the United States participated in the nine high school sports studied (1). This report is the first to use data from an Internet-based injury surveillance study to provide national estimates of injuries among these student athletes. The pilot study determined that an estimated 1.4 million injuries, more than 80% of which were new, occurred among participants in the nine high school sports during the 2005--06 school year. Injury prevention takes on added importance because history of an injury (e.g., sprain) is often a risk factor for future injury. Two existing injury surveillance systems illustrate the potential usefulness of continuing this pilot study as an ongoing system at the high school level to identify areas for targeted interventions. The National Collegiate Athletic Association Injury Surveillance System conducts surveillance of injuries among collegiate athletes (7), and the National Center for Catastrophic Sports Injury Research collects data on catastrophic injuries (e.g., brain or spinal cord injuries) (8). For approximately 20 years, the data collected by these two surveillance systems have been used by medical committees, rules committees, and researchers to reduce injury rates by driving the development, implementation, and evaluation of injury prevention programs. Recent examples of data-driven changes in policies and practices include 1) educational campaigns to reduce heat-related injuries in football and other sports, 2) elimination of racing starts in shallow pools to reduce catastrophic swimming injuries, and 3) recommendation of eye protection in sports involving sticks (e.g., field hockey). Previous sports-related injury studies have used various age groups and definitions for injury and exposure. One conducted among college athletes used a definition for injury that was similar to that used for this study (7). Although injury rates in that study of collegiate sports were two to six times higher compared with high school sports, patterns of injury were similar. Collegiate football had the highest rate of injury, and collegiate injury rates were higher in competition than practice (7). At the high school level, a surveillance study conducted during 1995--1997 in a representative sample of U.S. high schools used a slightly broader definition of injury and collected data on varsity athletes only (6). That study also observed higher injury rates in football compared with other sports and in competition versus practice. However, in each sport except volleyball, injury rates from 1995--1997 were at least two times higher than the injury rates observed in this report. Reasons for this disparity are not fully understood; some of the disparity might be attributable to differences in study methods, and some might have resulted from new injury prevention measures (e.g., rules changes or safety-gear improvements) and improvements in diagnosis and treatment (e.g., greater attention to minor injuries to reduce the rate of more serious injuries) since the earlier study was conducted. The findings in this report are subject to at least three limitations. First, only injuries that came to the attention of ATCs were included; injuries treated in a physician's office, emergency department, or urgent-care facility and not reported to an ATC were not captured. Second, only U.S. high schools whose athletes had access to care from an ATC affiliated with NATA were eligible. Reliable estimates of the number of U.S. high schools whose athletes have access to an ATC are not available. Finally, only injuries sustained during participation in nine sports were included. Although an estimated 4.2 million U.S. high school students participated in these nine sports during the 2005--06 school year, more than 30 sports were offered by U.S. high schools (1). Although the health benefits of a physically active lifestyle, including sports participation, are well known, the risks for sports-related injury and effective prevention strategies are less well established. General recommendations for reducing the risk of injury among high school athletes (e.g., ensure adequate hydration and use of appropriate protective equipment in practices and competitions) and sport-specific recommendations (e.g., block and tackle with the head up to reduce the risk for neck injuries in football) are offered by NATA (9). Additionally, CDC addresses prevention and management of concussion in all sports with a free tool kit for coaches, Heads Up: Concussion in High School Sports (10). This pilot study demonstrates that participation and injury data can be collected to calculate exposure-based injury rates. Calculation of rates enables comparison of injuries among age groups, sports, and years. The results support the feasibility and value of targeting research and prevention strategies to those students most at risk for sports-related injuries. References
* A total of 4,120 eligible ATCs (i.e., affiliated with the National Athletic Trainers' Association (NATA) and high schools and with contact information available) were contacted. Of those, ATCs representing 425 schools agreed to participate. Those schools were placed into eight sampling strata (created by four geographic strata based on U.S. census areas and two size strata based on large [>1,000 students] or small [<1,000 students] schools). Twelve schools were drawn randomly from four strata and 13 schools from the other four strata to make an even 100 participating schools.
Figure 1
Disclaimer All MMWR HTML versions of articles are electronic conversions from ASCII text into HTML. This conversion may have resulted in character translation or format errors in the HTML version. Users should not rely on this HTML document, but are referred to the electronic PDF version and/or the original MMWR paper copy for the official text, figures, and tables. An original paper copy of this issue can be obtained from the Superintendent of Documents, U.S. Government Printing Office (GPO), Washington, DC 20402-9371; telephone: (202) 512-1800. Contact GPO for current prices. **Questions or messages regarding errors in formatting should be addressed to mmwrq@cdc.gov.Date last reviewed: 9/28/2006 |
|||||||||
|