|
|
|
|
|
|
|
| ||||||||||
|
|
|
|
|
|
|
||||
| ||||||||||
|
|
|
|
|
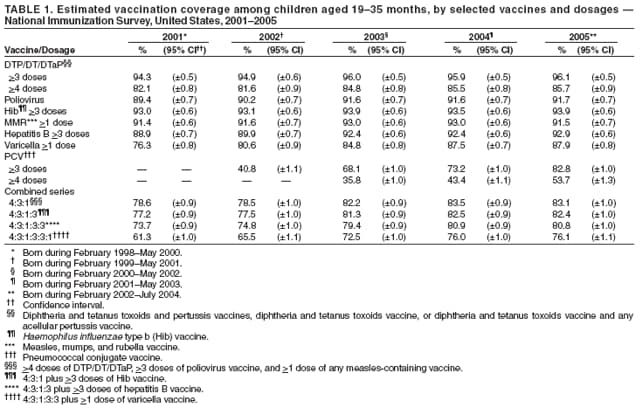
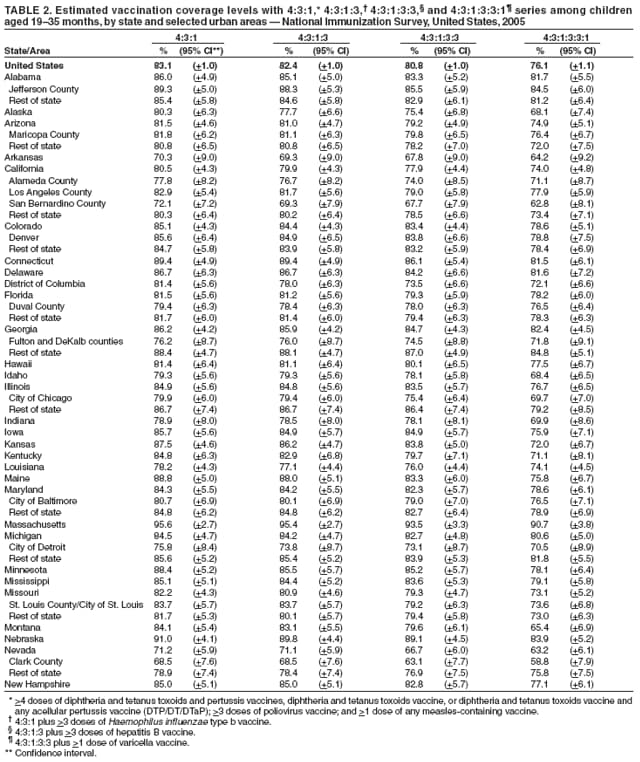
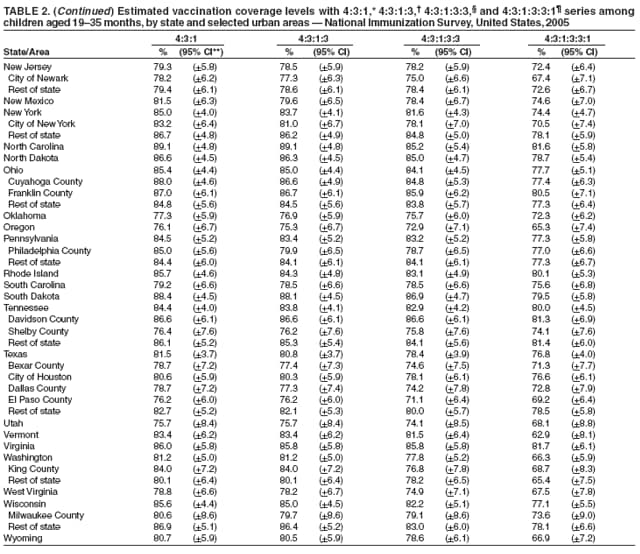
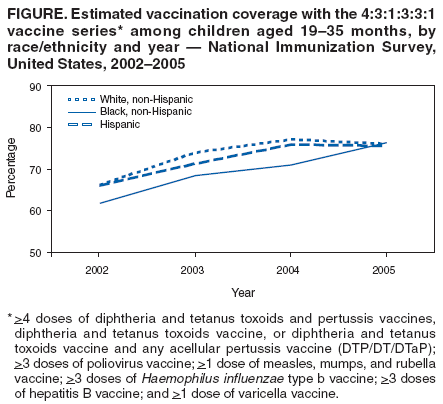
Persons using assistive technology might not be able to fully access information in this file. For assistance, please send e-mail to: mmwrq@cdc.gov. Type 508 Accommodation and the title of the report in the subject line of e-mail. National, State, and Urban Area Vaccination Coverage Among Children Aged 19--35 Months --- United States, 2005The National Immunization Survey (NIS) provides vaccination coverage estimates among children aged 19--35 months for each of the 50 states and selected urban areas.* Findings from the 2005 NIS† include nationwide increases in coverage with >3 and >4 doses of pneumococcal conjugate vaccine (PCV) and continued high levels of coverage for the other recommended vaccines and vaccine series. In addition, no racial/ethnic disparities in coverage estimates were observed in the 4:3:1:3:3:1§ vaccine series, the recommended series for children aged 19--35 months that includes DTP/DT/DTaP;¶ poliovirus vaccine; measles, mumps, and rubella vaccine (MMR); Haemophilus influenzae type b vaccine; hepatitis B vaccine; and varicella vaccine. An important accomplishment indicated by the 2005 NIS data is the achievement of >50% coverage for the full series of PCV (>4 doses) and >80% coverage for >3 doses within 5 years after being added to the U.S.-recommended childhood immunization schedule in 2000. This occurred despite shortages of this vaccine during 2001--2004, which might have affected accessibility to PCV. To collect vaccination data for age-eligible children, NIS uses a quarterly random-digit--dialed sample of telephone numbers for each survey area. NIS methodology, including the weighting of responses to represent the entire population of children aged 19--35 months, has been described previously (1). During 2005, the household survey response rate (2) was 65.1%; health-care provider vaccination records were obtained for 17,563 children (63.6%) for whom household interviews were completed. National vaccination coverage estimates increased from 2004 to 2005 for PCV (Table 1), from 73.2% to 82.8% for >3 doses and from 43.4% to 53.7% for >4 doses. Coverage for >1 dose of MMR vaccine decreased from 93.0% to 91.5%. Coverage estimates for all other vaccines and vaccine series in 2005 were not significantly different (by t test) from 2004 estimates. As in previous years, estimated vaccination coverage levels varied substantially among states (Table 2). Estimated coverage with the 4:3:1:3:3:1 vaccine series ranged from 90.7% (95% confidence interval [CI] = +3.8) in Massachusetts to 62.9% (CI = +8.1) in Vermont. Coverage also varied substantially among the 27 urban areas. The highest estimated coverage among the urban areas for the 4:3:1:3:3:1 series was 84.5% (CI = +6.0) for Jefferson County, Alabama, and the lowest was 58.8% (CI = +7.9) for Clark County, Nevada. In 2005, coverage estimates for the 4:3:1:3:3:1 vaccine series did not vary significantly by race/ethnicity** among children aged 19--35 months, ranging from 79.5% (CI = +4.2) for children of multiple races, 77.1% (CI = +6.0) for Asians, 76.3% (CI = +3.0) for blacks, 76.0% (CI = +1.4) for whites, and 75.6% (CI = +2.6) for Hispanics. During 2002--2004, coverage for the 4:3:1:3:3:1 vaccine series was lower among black compared with white children (Figure). In 2005, estimated coverage varied significantly by race/ethnicity for three individual vaccines: DTP/DT/DTaP; varicella vaccine; and PCV. For >4 doses of DTP/DT/DTaP, coverage was significantly lower for black (84.0% [CI = +2.5]) and Hispanic (83.6% [CI = +2.3]) children compared with white children (87.1% [CI = +1.1]). For >1 dose of varicella vaccine, coverage was significantly higher for black ([90.6% [CI = +1.8]) and Hispanic (89.2% [CI = +1.7]) children compared with white children (86.1% [CI = +1.2]). For >3 doses of PCV, coverage was significantly lower for black (79.6% [CI = +3.1]) compared with white children (83.2% [CI = +1.3]). For >4 doses of PCV, coverage was significantly lower among black (46.2% [CI = +3.8]) and Hispanic children (50.5% [CI = +2.8]) compared with white children (57.3% [CI = +1.6]). Reported by: N Darling, MPH, JA Singleton, MS, J Santoli, MD, Immunization Svc Div, National Center for Immunization and Respiratory Diseases (proposed), CDC. Editorial Note:The findings in this report indicate that among U.S. children aged 19--35 months, coverage with the recommended vaccines in 2005 remained at or near all-time--high levels, with substantial increases in PCV coverage. The 2005 NIS survey cohort included children born during February 2002--July 2004; all of these children might have been affected by the shortages of PCV during February--September 2004, when recommendations to defer the 4th dose or the 3rd and 4th doses were in effect (3,4). Despite these shortages, coverage with the full series (>4 doses) exceeded 50% and coverage with >3 doses of PCV exceeded 80% in this survey cohort. Surveillance data from 1998--2003 have indicated substantial reductions in the incidence of vaccine-type and overall invasive pneumococcal disease in children and adults, attributable to routine use of PCV in young children (5). Although 4 doses of PCV are recommended for maximum protection against invasive pneumococcal disease (6), the vaccine might provide protection with 3 doses through decreased transmission of pneumococci organisms among children (5). Continued measures to increase PCV coverage with all recommended doses are needed, particularly for black and Hispanic children. The 2005 data reflect the first year that the 4:3:1:3:3:1 vaccine series was used to evaluate progress toward one of the Healthy People 2010 objectives, which aims to achieve >80% coverage with the 4:3:1:3:3:1 series among children aged 19--35 months (objective-14.24a) (7). Although the 80% target was met in 2004 for 4:3:1:3:3 coverage (excludes varicella vaccine), vaccination coverage for the 4:3:1:3:3:1 series in 2005 remained stable at 76.1%, compared with 76.0% in 2004. In the 2005 NIS survey cohort, coverage levels for the 4:3:1:3:3:1 series were similar among racial/ethnic groups, which represents an improvement over recent years; an evaluation of NIS data from 1996 to 2002 revealed increasing or stable racial/ethnic disparities in the 4:3:1:3:3 vaccination series coverage levels for black and Hispanic children compared with white children (8). Continued monitoring is needed to determine whether the narrowing gaps in coverage among racial/ethnic groups persist. Monitoring the disparities in administration of DTP/DT/DTaP, varicella vaccine, and PCV will be important, particularly for PCV, which protects against a disease with higher incidence among black children. The only statistically significant decrease in coverage from 2004 to 2005 was for >1 dose of MMR. However, this decrease was modest, and national MMR coverage has remained consistent, ranging from 91% to 93% since 2001. The recent outbreak of mumps in the United States underscores the importance of timely administration of the first dose of MMR and the need for administration of the second dose at ages 4--6 years. Coverage in this age group is assessed by state health departments in their evaluation of school entry immunization requirements (9). The findings in this report are subject to at least three limitations. First, NIS is a telephone survey; although NIS results are weighted to make them representative of all children aged 19--35 months (e.g., accounting for nonresponse and households without telephones), some bias might remain after these statistical adjustments. Second, NIS uses provider-verified vaccination histories and assumes that coverage among children whose providers did not respond is similar to coverage among children whose providers did respond; thus, incomplete reporting might have resulted in underestimates of coverage. Finally, although national estimates are precise (1), annual estimates and trends for states and urban areas should be interpreted with caution because of wider confidence intervals. High vaccination coverage levels should be achieved and maintained to reduce the impact of vaccine-preventable diseases. Routine childhood vaccination with the vaccines included in the 4:3:1:3:3:1 series results in net societal savings of an estimated $43 billion per annual birth cohort (10). Coverage varied substantially by state, ranging from 63% to 91% for the 4:3:1:3:3:1 vaccine series, and by race/ethnicity for DT/DTP/DTaP, varicella vaccine, and PCV, indicating that further progress in increasing coverage is needed in many areas. NIS data will continue to be used to monitor vaccination status among preschool-aged children for recommended vaccines. Future NIS data will be used to assess routine rotavirus and hepatitis A vaccination of preschool-aged children, recommended in 2006, and use of a measles-mumps-rubella-varicella (MMRV) vaccine licensed in 2005. In addition to the recently recommended vaccines for preschool-aged children, three vaccines have been recommended recently for children aged 11--12 years: meningococcal conjugate vaccine (MCV4); tetanus, diphtheria, and acellular pertussis (Tdap) vaccine instead of tetanus and diphtheria toxoids vaccine (Td); and human papillomavirus vaccine (HPV). The NIS will be expanded during the fourth quarter of 2006 to assess coverage for recommended vaccines received among children aged 13--17 years. This enhancement underscores the importance of survey systems such as the NIS in monitoring new vaccine implementation, which can provide valuable information for improving overall vaccination coverage. References
* The 28 areas separately sampled for the 2005 NIS included 23 oversampled in previous years (Jefferson County, Alabama; Maricopa County, Arizona; Los Angeles County, California; District of Columbia; Duval County, Florida; Fulton and Dekalb counties, Georgia; Chicago, Illinois; Orleans Parish, Louisiana; Baltimore, Maryland; Detroit, Michigan; Newark, New Jersey; New York, New York; Cuyahoga and Franklin counties, Ohio; Philadelphia County, Pennsylvania; Davidson and Shelby counties, Tennessee; Bexar, Dallas, and El Paso counties, and Houston, Texas; King County, Washington; and Milwaukee County, Wisconsin), and five areas oversampled for the first time (Alameda and San Bernardino counties, California; Denver-Tri County, Colorado, consisting of Adams, Arapahoe, Denver, and Douglas counties; St. Louis City and County, Missouri; and Clark County, Nevada). Although Orleans Parish, Louisiana, was initially oversampled in 2005, estimates are not available because of interruptions in telephone service, movement of the population, and difficulty locating providers in the aftermath of Hurricane Katrina. † During the 2005 reporting period, NIS included children born during February 2002--July 2004. § >4 doses of diphtheria and tetanus toxoids and pertussis vaccines, diphtheria and tetanus toxoids vaccine, or diphtheria and tetanus toxoids vaccine and any acellular pertussis vaccine (DTP/DT/DTaP); >3 doses of poliovirus vaccine; >1 dose of MMR vaccine; >3 doses of Haemophilus influenzae type b vaccine; >3 doses of hepatitis B vaccine; and >1 dose of varicella vaccine. ¶ Diphtheria and tetanus toxoids and pertussis vaccines, diphtheria and tetanus toxoids vaccine, or diphtheria and tetanus toxoids vaccine and any acellular pertussis vaccine. ** For this report, persons identified as white, black, Asian, or multiple race are all non-Hispanic. Persons identified as Hispanic might be of any race. Table 1
Disclaimer All MMWR HTML versions of articles are electronic conversions from ASCII text into HTML. This conversion may have resulted in character translation or format errors in the HTML version. Users should not rely on this HTML document, but are referred to the electronic PDF version and/or the original MMWR paper copy for the official text, figures, and tables. An original paper copy of this issue can be obtained from the Superintendent of Documents, U.S. Government Printing Office (GPO), Washington, DC 20402-9371; telephone: (202) 512-1800. Contact GPO for current prices. **Questions or messages regarding errors in formatting should be addressed to mmwrq@cdc.gov.Date last reviewed: 9/14/2006 |
|||||||||
|