|
|
|
|
|
|
|
| ||||||||||
|
|
|
|
|
|
|
||||
| ||||||||||
|
|
|
|
|
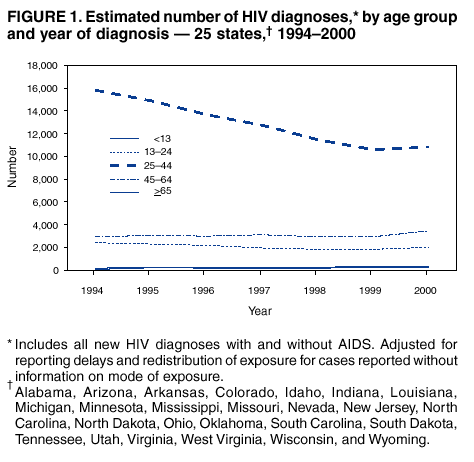
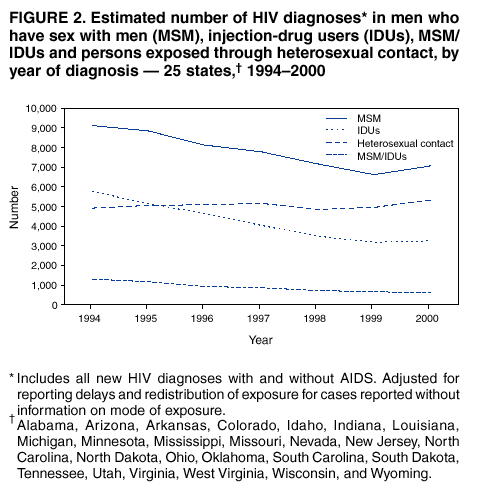
Persons using assistive technology might not be able to fully access information in this file. For assistance, please send e-mail to: mmwrq@cdc.gov. Type 508 Accommodation and the title of the report in the subject line of e-mail. Diagnosis and Reporting of HIV and AIDS in States with HIV/AIDS Surveillance --- United States, 1994--2000Before advances in therapy, public health surveillance of acquired immunodeficiency syndrome (AIDS) provided reliable population-based information that represented trends in the incidence of human immunodeficiency virus (HIV) infection. However, since 1996, highly active antiretroviral therapy (HAART) has prolonged substantially the interval between the diagnosis of HIV infection and the development of AIDS, which has diminished the capacity of AIDS surveillance alone to monitor the underlying patterns of HIV transmission (1). As a result, CDC recommends that states conduct HIV-infection reporting in addition to AIDS surveillance (2). This report describes trends in newly diagnosed cases of HIV infection in 25 states* that conducted name-based HIV/AIDS surveillance during 1994--2000 (3). The findings indicate that the number of diagnosed HIV infections declined in these states during 1994--1997 and remained constant during 1998--2000. HIV/AIDS surveillance should be conducted by all states to fully characterize persons infected with HIV who need treatment and prevention services. Since 1994, CDC has supported uniform HIV surveillance for all 50 states and territories. The 25 states included in this analysis have collected HIV surveillance data since 1994 and submitted case reports to CDC after removal of personal identifiers (3). Cases were divided into two categories: persons in whom HIV infection was diagnosed without an AIDS diagnosis and persons in whom HIV infection was diagnosed when AIDS was diagnosed (4). Data with or without AIDS were analyzed by the earliest date of diagnosis of HIV for 1994--2000. HIV/AIDS data were adjusted for delays in reporting of cases and deaths. Estimates for the mode of exposure were adjusted for anticipated reclassification of cases reported originally without this information (5). During 1994--2000, HIV infection was diagnosed in 128,813 persons in the 25 states. Of these, the initial diagnosis was HIV infection with AIDS in 33,144 (26%) and HIV infection without AIDS in 95,699 (74%) (Table). The number of persons in whom HIV infection without AIDS was the initial diagnosis declined 21% (from 15,945 in 1994 to 12,612 in 2000), and the number of persons in whom HIV infection with AIDS was the initial diagnosis declined 31% (from 5,760 in 1994 to 3,987 in 2000). However, during 1998--2000, the number of diagnosed cases of HIV infection with and without AIDS remained constant (Table). During 1994--2000, the proportion of persons in whom HIV infection with AIDS was newly diagnosed remained relatively stable (27% in 1994 and 24% in 2000). However, the proportion of HIV-infected persons who also had AIDS varied by demographic subgroup and mode of exposure. Persons with AIDS at the time of initial HIV diagnosis were more likely to be male and older (Table). Asians/Pacific Islanders (34%), non-Hispanic whites (29%), and Hispanics (29%) were more likely than non-Hispanic blacks (23%) and American Indians/Alaska Natives (22%) to have AIDS at the time of initial HIV diagnosis. Of the 128,813 HIV infections with and without AIDS, the majority of newly diagnosed HIV infections were among non-Hispanic blacks (70,990 [55%]). When evaluated by mode of exposure, men who have sex with men (MSM) accounted for the largest proportion (15,694 [47%]) of persons with AIDS at the time of initial HIV diagnosis, followed by persons exposed through injection-drug use (IDU) (7,913 [24%]). Trends in the number of persons who had HIV infection newly diagnosed with and without AIDS varied substantially by age at diagnosis and mode of exposure (Figures 1 and 2). The largest decline in cases occurred among persons aged 25--44 years (from 15,809 in 1994 to 10,826 in 2000). The number of newly diagnosed HIV infections with and without AIDS attributed to MSM and injection-drug use (IDU) declined 22% and 44%, respectively (Figure 2). However, the number of diagnosed infections attributed to heterosexual contact increased 9% (from 4,905 in 1994 to 5,325 in 2000). Reported by: MT McKenna, MD, RM Klevens, DDS, PL Fleming, PhD, JJ Neal, PhD, Div of HIV/AIDS Prevention, National Center for HIV, STD and TB Prevention, CDC. Editorial Note:Surveillance data on HIV and AIDS facilitates a more complete assessment of HIV transmission patterns. Surveillance data on HIV diagnoses with and without AIDS from these 25 states indicate that during 1994--2000, the number of persons in whom HIV infection was newly diagnosed declined during 1994--1997 and then stabilized during 1998--2000. The majority of the decline occurred among persons aged 25--44 years. Persons in this age group were affected more by the epidemic during the 1980s and 1990s; accordingly, these decreases probably reflect the declines from the peak incidence during the late 1980s (1). The stabilization of case counts in every age group during 1999--2000 suggests that earlier declines in newly diagnosed HIV infections have abated. These trends should continue to be monitored, and surveillance systems that collect information systematically on newly diagnosed HIV infections should be expanded to other states to characterize persons needing treatment and prevention services (3). Trends in the number of HIV diagnoses can be influenced by changes in testing patterns for HIV and increases or decreases in HIV transmission. Data from national surveys and publicly funded counseling and testing sites indicate that testing rates have remained relatively unchanged during the late 1990s (2,6). HIV-infection surveillance will be facilitated by new technologies that can identify patients infected recently (i.e., <6 months) (7). CDC is initiating activities to integrate these new laboratory technologies into routine HIV-infection surveillance. A total of 33 states have name-based HIV-infection reporting. An additional 14 states have instituted non-name or code-based reporting of diagnosed HIV infections. Variable combinations of information about the patient (e.g., portions of the name, birth date, sex, and race) are used to create the codes so reports about the patient can be linked to avoid duplicate reporting and to follow clinical outcomes over time. Systems that use name-based reporting of AIDS are at least 90% complete (8). On the basis of performance guidelines for HIV-infection reporting, CDC is assisting states to assess the completeness, timeliness, validity, and usefulness of name- and code-based reporting systems (2). The findings in this report are subject to at least three limitations. First, a limited number of states were included in this analysis; 24% of all AIDS cases diagnosed in the United States during 1994--2000 occurred in the 25 states. Second, the reporting on mode of exposure has become more incomplete during the surveillance period; therefore, analysis of mode of exposure requires greater statistical adjustment. Verification of the validity of these modeled estimates can be achieved by sampling a subset of representative cases for intensive follow-up. Third, HIV reporting might be incomplete, and duplicate reporting of persons in whom HIV infection was first diagnosed in one state and who are then diagnosed with AIDS in another state might be occurring. The proportion of HIV-infected persons who had HIV diagnosed at time of AIDS diagnosis remained relatively constant in these states. An estimated 25% (180,000--280,000 persons) of HIV-infected persons in the United States are not aware of their serostatus (9). The majority of infections were diagnosed in non-Hispanic blacks, and a substantial number were reported in Hispanics. HIV affects disproportionately populations that traditionally have limited access to or use of medical and preventive services because of socioeconomic disadvantage and other factors (1). If HIV-testing strategies had effectively penetrated into high-risk populations (e.g., at-risk racial/ethnic minorities and young MSM) during this surveillance period, a substantially smaller proportion of the HIV diagnoses would have been identified with AIDS. A CDC prevention strategy, Serostatus Approach to Fighting the Epidemic (SAFE), encourages counseling and testing for persons who are at high risk for HIV infection, links recently diagnosed HIV-infected persons to appropriate care, and provides persons with prevention services to facilitate the adoption of less risky behaviors (10). Greater emphasis should be placed on counseling and testing efforts in communities in which racial/ethnic minorities are at risk for HIV. References
Acknowledgments This report is based on data contributed by state and local health departments. * Alabama, Arizona, Arkansas, Colorado, Idaho, Indiana, Louisiana, Michigan, Minnesota, Mississippi, Missouri, Nevada, New Jersey, North Carolina, North Dakota, Ohio, Oklahoma, South Carolina, South Dakota, Tennessee, Utah, Virginia, West Virginia, Wisconsin, and Wyoming.
Disclaimer All MMWR HTML versions of articles are electronic conversions from ASCII text into HTML. This conversion may have resulted in character translation or format errors in the HTML version. Users should not rely on this HTML document, but are referred to the electronic PDF version and/or the original MMWR paper copy for the official text, figures, and tables. An original paper copy of this issue can be obtained from the Superintendent of Documents, U.S. Government Printing Office (GPO), Washington, DC 20402-9371; telephone: (202) 512-1800. Contact GPO for current prices. **Questions or messages regarding errors in formatting should be addressed to mmwrq@cdc.gov.Page converted: 7/11/2002 |
|||||||||
This page last reviewed 7/11/2002
|