Skip Navigation LinksSkip Navigation Links
Centers for Disease Control and Prevention
Safer Healthier People
Blue White
Blue White
bottom curve
CDC Home Search Health Topics A-Z spacer spacer
spacer
Blue curve MMWR spacer
spacer
spacer

Notifiable Diseases/Deaths in Selected Cities Weekly Information

Figure I   Selected notifiable disease reports, comparison of provisional 4-week totals ending February 5, 2000, with historical data -- United States

Table I   Summary -- provisional cases of selected notifiable diseases, United States, cumulative, week ending February 5, 2000 (5th Week)

Table II   Provisional cases of selected notifiable diseases, United States, weeks ending February 5, 2000 and February 5, 1999 (5th Week)

Table III   Provisional cases of selected notifiable diseases preventable by vaccination, United States, weeks ending February 5, 2000 and February 5, 1999 (5th Week)

Table IV   Deaths in 122 U.S. cities, week ending February 5, 2000 (5th Week)


Figure I

Figure I
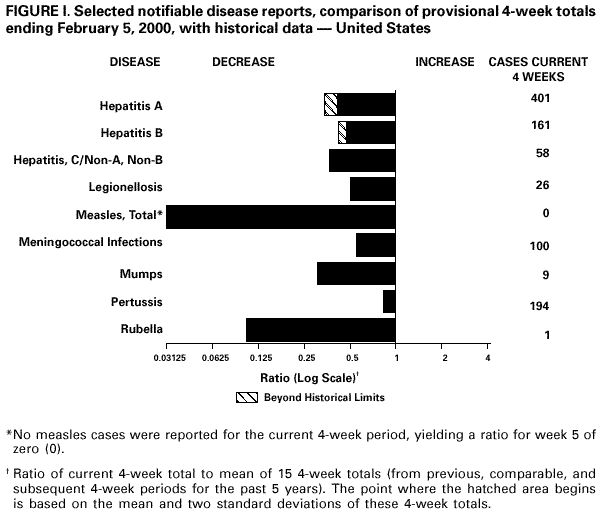
Return to top.

Table I
Note: To print large tables and graphs users may have to change their printer settings to landscape and use a small font size.
TABLE I. Summary -- provisional cases of selected notifiable diseases, United
States, cumulative, week ending February 5, 2000 (5th Week)
==================================================================================
                                             Cum. 2000
------------------------------------------------------
Anthrax                                              -
Brucellosis*                                         2
Cholera                                              -
Congenital rubella syndrome                          -
Cyclosporiasis*                                      2
Diphtheria                                           -
Encephalitis:  California* serogroup viral           -
               eastern equine*                       -
               St. Louis*                            -
               western equine*                       -
Ehrlichiosis   human granulocytic (HGE)*             2
               human monocytic (HME)*                1
Hansen Disease*                                      2
Hantavirus pulmonary syndrome*+.                     -
Hemolytic uremic syndrome, post-diarrheal*           4
HIV infection, pediatric*&                           -
Plague                                               1
Poliomyelitis, paralytic                             -
Psittacosis*                                         -
Rabies, human                                        -
Rocky Mountain spotted fever (RMSF)                 14
Streptococcal disease, invasive Group A            230
Streptococcal toxic-shock syndrome*                  5
Syphilis, congenital@                                -
Tetanus                                              -
Toxic-shock syndrome                                 9
Trichinosis                                          -
Typhoid fever                                       20
Yellow fever                                         -
------------------------------------------------------
-: no reported cases
 * Not notifiable in all states
 + Updated weekly from reports to the Division of Viral and Rickettsial
   Diseases, National Center for Infectious Diseases (NCID).
 & Updated monthly from reports to the Division of HIV/AIDS Prevention --
   Surveillance and Epidemiology, National Center for HIV, STD, and TB
   Prevention (NCHSTP), last update December 26, 1999.
 @ Updated from reports to the Division of STD Prevention, NCHSTP.

==================================================================================


Return to top.

Table II
Note: To print large tables and graphs users may have to change their printer settings to landscape and use a small font size.
TABLE II. (page 1) Provisional cases of selected notifiable diseases, United States, weeks ending
February 5, 2000, and February 5, 1999 (5th Week)

                                                                                                    Escherichia
                                                                                                   coli O157:H7*
                                                                                     -----------------------------------------
                          AIDS             Chlamydia***        Cryptosporidiosis            NETSS                  PHLIS
                   -----------------   --------------------   -------------------    -------------------      ----------------
                     Cum.       Cum.        Cum.       Cum.       Cum.       Cum.        Cum.       Cum.       Cum.       Cum.
Reporting Area       2000**     1999        2000       1999       2000       1999        2000       1999       2000       1999
------------------------------------------------------------------------------------------------------------------------------
UNITED STATES           -      3,075      29,433     62,146         45         88         105        103         34         86

NEW ENGLAND             -        156       1,903      1,903          2          4          14         17          9         22
Maine                   -          3         112         35          1          1           1          1          -          -
N.H.                    -          3          72        103          -          -           3          -          3          1
Vt.                     -          -          52         37          1          1           1          -          1          -
Mass.                   -        122         906        835          -          2           3         11          1         10
R.I.                    -          9           -        211          -          -           -          -          -          -
Conn.                   -         19         761        682          -          -           6          5          4         11

MID. ATLANTIC           -        486         438      6,997          4         14          16          6          -          1
Upstate N.Y.            -         18           N          N          3          2          16          3          -          -
N.Y. City               -        236           -      3,715          1         10           -          1          -          1
N.J.                    -        158          64      1,107          -          -           -          2          -          -
Pa.                     -         74         374      2,175          -          2           N          N          -          -

E.N. CENTRAL            -        177       6,015     10,647          5         23          13         24          3         16
Ohio                    -         37       1,212      3,874          4          3           4         14          1          6
Ind.                    -         25         229        967          -          2           1          4          -          3
Ill.                    -         77       1,828      2,555          -          2           5          2          -          2
Mich.                   -         22       1,910      1,997          1          2           3          4          1          2
Wis.                    -         16         836      1,254          -         14           N          N          1          3

W.N. CENTRAL            -        114       1,579      3,650          2          6          24         18         12         13
Minn.                   -         22         350        802          -          1           7          6          3          8
Iowa                    -          4          36        114          -          -           3          4          1          2
Mo.                     -         73         686      1,512          2          4          14          2          6          1
N. Dak.                 -          -           -         78          -          -           -          -          -          1
S. Dak.                 -          -         112        224          -          -           -          -          -          -
Nebr.                   -          5         201        390          -          -           -          2          1          1
Kans.                   -         10         194        530          -          1           -          4          1          -

S. ATLANTIC             -        845       5,676     13,798          3          3           9         10          2          7
Del.                    -         13         285        266          -          -           -          -          -          -
Md.                     -         81         415      1,395          1          2           4          1          1          -
D.C.                    -          8         200          N          -          1           -          -          U          U
Va.                     -         54         857      1,473          -          -           1          4          -          2
W. Va.                  -         10           -        235          -          -           -          -          1          1
N.C.                    -         68       1,634      2,088          -          -           2          2          -          2
S.C.                    -         56         669      2,710          -          -           -          1          -          1
Ga.                     -        110         661      2,653          -          -           -          -          U          U
Fla.                    -        445         955      2,978          2          -           2          2          -          1

E.S. CENTRAL            -        155       2,787      3,320          3          1           5          9          -          3
Ky.                     -         15         588        572          -          1           2          3          U          U
Tenn.                   -         62       1,168      1,300          -          -           2          3          -          2
Ala.                    -         30         693      1,211          3          -           1          1          -          1
Miss.                   -         48         338        237          -          -           -          2          -          -

W.S. CENTRAL            -        530       2,961      7,992          2          4           4          1          4          5
Ark.                    -         19         298        448          1          -           2          -          -          2
La.                     -         26           -        784          -          -           -          -          3          1
Okla.                   -          6         711        925          -          -           -          -          -          -
Tex.                    -        479       1,952      5,835          1          4           2          1          1          2

MOUNTAIN                -         45       1,833      3,343          5          9          11          5          2          4
Mont.                   -          -           -         60          -          -           5          -          -          -
Idaho                   -          4          64        165          1          1           -          -          -          -
Wyo.                    -          -          60         62          -          -           1          1          -          1
Colo.                   -         26         343        729          -          -           3          2          1          1
N. Mex.                 -          4          34        526          -          4           -          -          -          -
Ariz.                   -          4         916      1,334          2          4           1          1          1          -
Utah                    -          4         295        180          N          N           -          1          -          2
Nev.                    -          3         121        287          -          -           1          -          -          -

PACIFIC                 -        567       6,241     10,496         19         24           9         13          2         15
Wash.                   -         28       1,230      1,188          N          N           1          -          1          4
Oreg.                   -         15         374        466          1          3           1          7          1          6
Calif.                  -        509       4,445      8,357         18         21           6          6          -          5
Alaska                  -          5         192        186          -          -           -          -          -          -
Hawaii                  -         10           -        299          -          -           1          -          -          -

Guam                    -          1           -         46          -          -           N          N          U          U
P.R.                    -         92         113          U          -          -           -          1          U          U
V.I.                    -          -           -          U          -          U           -          U          U          U
Amer. Samoa             -          -           -          U          -          U           -          U          U          U
C.N.M.I.                -          -           -          U          -          U           -          U          U          U
------------------------------------------------------------------------------------------------------------------------------
N: Not notifiable    U: Unavailable    -: no reported cases    C.N.M.I.: Commonwealth of North Mariana Islands

  * Individual cases may be reported through both the National Electronic Telecommunications System for Surveillance (NETSS)
    and the Public Health Laboratory Information System (PHLIS).
 ** Updated monthly from reports to the Division of HIV/AIDS Prevention -- Surveillance and Epidemiology, National Center for HIV,
    STD, and TB Prevention, last update December 26, 1999.
*** Chlamydia refers to genital infections caused by C. trachomatis. Totals reported to the Division of STD Prevention, NCHSTP.

=======================================================================================================================================================

TABLE II. (page 2) Provisional cases of selected notifiable diseases, United States, weeks ending
February 5, 2000, and February 5, 1999 (5th Week)

                                            Hepatitis                                       Lyme
                       Gonorrhea             C/NA,NB             Legionellosis             Disease
                   -----------------   --------------------   -------------------    -------------------
                     Cum.       Cum.        Cum.       Cum.       Cum.       Cum.        Cum.       Cum.
Reporting Area       2000       1999        2000       1999       2000       1999        2000       1999
--------------------------------------------------------------------------------------------------------
UNITED STATES      16,227     35,099         125        301         36         65          70        362

NEW ENGLAND           680        659           -          1          2          4          24         40
Maine                   6          6           -          -          2          -           -          -
N.H.                    8          5           -          -          -          1          10          -
Vt.                     1          5           -          -          -          1           -          -
Mass.                 284        263           -          1          -          1          14         40
R.I.                    -         62           -          -          -          1           -          -
Conn.                 381        318           -          -          -          -           -          -

MID. ATLANTIC         525      3,935           -          7          1         14          19        219
Upstate N.Y.          211        246           -          3          1          1          11         13
N.Y. City               -      1,814           -          -          -          4           1         12
N.J.                   52        780           -          -          -          3           -         76
Pa.                   262      1,095           -          4          -          6           7        118

E.N. CENTRAL        3,607      6,387          27        196         10         24           1         14
Ohio                  603      1,664           -          -          8          7           1          5
Ind.                  168        628           -          -          -          1           -          -
Ill.                  920      1,984           1          3          -          3           -          1
Mich.               1,406      1,495          26         63          2          8           -          1
Wis.                  510        616           -        130          -          5           U          7

W.N. CENTRAL          690      1,946          18         23          2          3           2          4
Minn.                 160        305           -          -          -          -           1          -
Iowa                   31         32           -          -          1          2           -          1
Mo.                   324      1,196          18         21          1          1           1          1
N. Dak.                 -          7           -          -          -          -           -          1
S. Dak.                 8         23           -          -          -          -           -          -
Nebr.                  79        184           -          1          -          -           -          -
Kans.                  88        199           -          1          -          -           -          1

S. ATLANTIC         4,962     11,049           3         19         11          8          19         53
Del.                  159        160           -          -          1          1           -          3
Md.                   211      1,916           -         15          7          -          16         42
D.C.                  206        347           -          -          -          -           -          1
Va.                   971      1,274           -          1          -          2           -          -
W. Va.                  -         81           -          1          N          N           -          -
N.C.                1,558      1,959           3          1          1          2           3          7
S.C.                  574      1,429           -          1          2          1           -          -
Ga.                   556      1,632           -          -          -          -           -          -
Fla.                  727      2,251           -          -          -          2           -          -

E.S. CENTRAL        2,239      3,038          32         13          1          4           -          8
Ky.                   274        332           3          -          -          2           -          -
Tenn.               1,001      1,121           8          9          -          2           -          2
Ala.                  562      1,276           3          1          1          -           -          3
Miss.                 402        309          18          3          -          -           -          3

W.S. CENTRAL        1,631      4,732          12          2          -          -           -          -
Ark.                  187        280           -          -          -          -           -          -
La.                     -        859           -          -          -          -           -          -
Okla.                 356        516           -          1          -          -           -          -
Tex.                1,088      3,077          12          1          -          -           -          -

MOUNTAIN              740        985          19         24          4          4           1          -
Mont.                   -          1           -          -          -          -           -          -
Idaho                   4         10           -          3          1          -           -          -
Wyo.                    4          2           9         11          -          -           -          -
Colo.                 342        175           4          1          2          1           -          -
N. Mex.                 8        116           3          6          -          1           -          -
Ariz.                 285        537           3          2          -          -           1          -
Utah                   45         16           -          1          1          2           -          -
Nev.                   52        128           -          -          -          -           -          -

PACIFIC             1,153      2,368          14         16          5          4           4         24
Wash.                 238        210           2          1          1          -           -          -
Oreg.                  47         86           4          1          N          N           1          -
Calif.                846      1,973           8         14          4          4           3         24
Alaska                 22         40           -          -          -          -           -          -
Hawaii                  -         59           -          -          -          -           N          N

Guam                    -         11           -          -          -          -           -          -
P.R.                   28         29           -          -          -          -           N          N
V.I.                    -          U           -          U          -          U           -          U
Amer. Samoa             -          U           -          U          -          U           -          U
C.N.M.I.                -          U           -          U          -          U           -          U

--------------------------------------------------------------------------------------------------------
N: Not notifiable    U: Unavailable    -: no reported cases
=======================================================================================================================================================

TABLE II. (page 3) Provisional cases of selected notifiable diseases, United States, weeks ending
February 5, 2000, and February 5, 1999 (5th Week)

                                                                            Salmonellosis*
                                                              ------------------------------------------
                        Malaria           Rabies, Animal             NETSS                  PHLIS
                   -----------------   --------------------   -------------------    -------------------
                     Cum.       Cum.        Cum.       Cum.       Cum.       Cum.        Cum.       Cum.
Reporting Area       2000       1999        2000       1999       2000       1999        2000       1999
--------------------------------------------------------------------------------------------------------
UNITED STATES          46        110         210        380      1,476      2,216         502      2,346

NEW ENGLAND             -          2          35         62         91        121          64        132
Maine                   -          -           7          5          9         16           -          8
N.H.                    -          -           -          4         10          -           2          5
Vt.                     -          -           2         10          1          7           1          8
Mass.                   -          2          16         20         52         73          39         68
R.I.                    -          -           -          7          1          3           1         14
Conn.                   -          -          10         16         18         22          21         29

MID. ATLANTIC           5         38          48         71         72        343           4        291
Upstate N.Y.            4          6          42         40         30         50           4         86
N.Y. City               1         17           U          U         38        115           -        117
N.J.                    -         12           6         18          -         98           -         85
Pa.                     -          3           -         13          4         80           -          3

E.N. CENTRAL            3         12           -          1        202        396          88        355
Ohio                    2          1           -          -         82         84          41         67
Ind.                    -          -           -          -         15         13           -         24
Ill.                    -          6           -          -         66        120           -        125
Mich.                   1          2           -          1         35        101          33         98
Wis.                    -          3           -          -          4         78          14         41

W.N. CENTRAL            -          6          15         55         67         98          65        151
Minn.                   -          -          11          9         21         21          20         48
Iowa                    -          2           3          6         11         15           8         18
Mo.                     -          4           1          2         28         34          17         45
N. Dak.                 -          -           -         10          -          1           1          4
S. Dak.                 -          -           -         19          -          2           4          8
Nebr.                   -          -           -          1          7         11           2         14
Kans.                   -          -           -          8          -         14          13         14

S. ATLANTIC            18         27          91        139        260        348          87        421
Del.                    -          -           5          3          8         10           2          8
Md.                    13         11          17         40         59         63          21         52
D.C.                    -          5           -          -          -         11           U          U
Va.                     3          2          31         29         28         47           -         56
W. Va.                  -          1           -          7          -          4           7          8
N.C.                    2          1          21         35         73        102          30         90
S.C.                    -          -           2          8         41         18          27         36
Ga.                     -          2           -          -          -         27           -        125
Fla.                    -          5          15         17         51         66           -         46

E.S. CENTRAL            2          2           2         11         82        180           -         86
Ky.                     1          -           2          2         10         34           U          U
Tenn.                   -          1           -          8         17         47           -         57
Ala.                    1          1           -          1         35         54           -         23
Miss.                   -          -           -          -         20         45           -          6

W.S. CENTRAL            -          1           -          8         52         93          70        259
Ark.                    -          -           -          -         13         23           6         24
La.                     -          -           -          -          -          -          18         44
Okla.                   -          -           -          8          -         21           -          3
Tex.                    -          1           -          -         39         49          46        188

MOUNTAIN                5          3          11         11        175        178          84        167
Mont.                   -          1           5          1          5          1           -          -
Idaho                   -          -           -          -         13          4           -          8
Wyo.                    -          -           4          5          1          2           -          4
Colo.                   1          -           -          1         21         45          10         44
N. Mex.                 -          1           -          -         13         20           5         20
Ariz.                   2          1           2          4         69         63          37         51
Utah                    2          -           -          -         38         21          32         25
Nev.                    -          -           -          -         15         22           -         15

PACIFIC                13         19           8         22        475        459          40        484
Wash.                   -          1           -          -          7          7           2         61
Oreg.                   1          2           -          -         31         25          36         47
Calif.                 12         15           8         22        408        387           -        337
Alaska                  -          -           -          -          7          6           2          3
Hawaii                  -          1           -          -         22         34           -         36

Guam                    -          -           -          -          -          9           U          U
P.R.                    -          -           2          4          -         37           U          U
V.I.                    -          U           -          U          -          U           U          U
Amer. Samoa             -          U           -          U          -          U           U          U
C.N.M.I.                -          U           -          U          -          U           U          U

--------------------------------------------------------------------------------------------------------
N: Not notifiable    U: Unavailable    -: no reported cases

* Individual cases may be reported through both the National Electronic Telecommunications System for Surveillance (NETSS)
  and the Public Health Laboratory Information System (PHLIS).
=======================================================================================================================================================

TABLE II. (page 4) Provisional cases of selected notifiable diseases, United States, weeks ending
February 5, 2000, and February 5, 1999 (5th Week)

                                  Shigellosis*
                    ---------------------------------------          Syphilis
                         NETSS                  PHLIS          (Primary & Secondary)      Tuberculosis
                    ----------------       ----------------    ---------------------    ------------------
                     Cum.       Cum.        Cum.       Cum.       Cum.       Cum.        Cum.       Cum.
Reporting Area       2000       1999        2000       1999       2000       1999        2000       1999**
----------------------------------------------------------------------------------------------------------
UNITED STATES         798      1,195         183        731        332        624         313        983

NEW ENGLAND            20         27          10         31          6          9           5         18
Maine                   1          -           -          -          -          -           -          -
N.H.                    1          2           -          4          -          -           -          -
Vt.                     -          1           -          1          -          1           -          -
Mass.                  16         22           9         19          5          5           5          6
R.I.                    -          -           -          3          -          -           -          9
Conn.                   2          2           1          4          1          3           -          3

MID. ATLANTIC          16         88           3         61          9         24          65        111
Upstate N.Y.            6         20           3         16          -          2           -          4
N.Y. City               9         29           -         26          6         11          37         38
N.J.                    -         27           -         19          -          7          22         35
Pa.                     1         12           -          -          3          4           6         34

E.N. CENTRAL          172        255          27        108         66         83           9        103
Ohio                   14         93           -          9          8          9           9         33
Ind.                   16          3           -          3         13         23           -          7
Ill.                   58         92           -         89         13         40           -         49
Mich.                  81         31          25          -         23          7           -         11
Wis.                    3         36           2          7          9          4           -          3

W.N. CENTRAL           40         73          22         62          4         23          19         20
Minn.                  12         10           6         14          -          -          10         12
Iowa                    8          -           7          -          -          -           -          -
Mo.                    16         51           5         42          4         21           8          6
N. Dak.                 -          -           -          -          -          -           -          -
S. Dak.                 -          -           -          -          -          -           -          1
Nebr.                   4          6           2          3          -          1           1          -
Kans.                   -          6           2          3          -          1           -          1

S. ATLANTIC            65        130           7         34        109        251          51         76
Del.                    -          4           -          1          1          1           -          2
Md.                     9         10           2          1         10         50           -         11
D.C.                    -          6           U          U          5         10           -          4
Va.                     9          4           -          2         17         17           -          9
W. Va.                  -          3           -          -          -          1           -          5
N.C.                    7         37           4          9         39         62           9         19
S.C.                    3         14           1          4         11         22          18         25
Ga.                     -          6           -          7         12         52          24          -
Fla.                   37         46           -         10         14         36           -          1

E.S. CENTRAL           42        177           1         90         70        116          23         56
Ky.                     9         18           U          U          3         15           -          5
Tenn.                  19        127           1         82         52         49           4         11
Ala.                    3         18           -          8         11         34          19         34
Miss.                  11         14           -          -          4         18           -          6

W.S. CENTRAL           55        145          63        264         33         73           3        184
Ark.                   13         11           -         10          1          5           3          -
La.                     -          1          10         15          -          4           -          U
Okla.                   -         54           1          8         20         16           -          4
Tex.                   42         79          52        231         12         48           -        180

MOUNTAIN              112         84          29         51         16         16          16         29
Mont.                   -          1           -          -          -          -           -          -
Idaho                  13          2           -          1          -          -           -          -
Wyo.                    -          1           -          -          -          -           -          -
Colo.                  13         18           7         16          2          -           1          U
N. Mex.                13          5           5          6          -          -           3          4
Ariz.                  62         50          13         21         14         16           8         11
Utah                    2          5           4          5          -          -           4          8
Nev.                    9          2           -          2          -          -           -          6

PACIFIC               276        216          21         30         19         29         122        386
Wash.                  19          3           2         15          2          1          15          8
Oreg.                  44          6          19          9          -          1           -          8
Calif.                209        201           -          -         17         26          98        353
Alaska                  1          -           -          -          -          -           1          5
Hawaii                  3          6           -          6          -          1           8         12

Guam                    -          2           U          U          -          -           -          -
P.R.                    -          4           U          U         16         28           -          -
V.I.                    -          U           U          U          -          U           -          U
Amer. Samoa             -          U           U          U          -          U           -          U
C.N.M.I.                -          U           U          U          -          U           -          U

----------------------------------------------------------------------------------------------------------
N: Not notifiable    U: Unavailable    -: no reported cases

 * Individual cases may be reported through both the National Electronic Telecommunications System for Surveillance (NETSS)
   and the Public Health Laboratory Information System (PHLIS).
** Cumulative reports of provisional tuberculosis cases for 1999 are unavailable ('U') for some
   areas using the Tuberculosis Information Management System (TIMS).

=======================================================================================================================================================


Return to top.

Table III
Note: To print large tables and graphs users may have to change their printer settings to landscape and use a small font size.
TABLE III. (page 1) Provisional cases of selected notifiable diseases preventable by vaccination, United
States, weeks ending February 5, 2000, and February 5, 1999 (5th Week)

                                                Hepatitis (Viral), by type                                    Measles (Rubeola)
                     H. influenzae,       ---------------------------------------        ------------------------------------------------------------
                        invasive                  A                     B                  Indigenous            Imported*                 Total
                    ----------------      -----------------     -----------------        ---------------       ---------------        ---------------
                     Cum.       Cum.        Cum.       Cum.       Cum.       Cum.                   Cum.                  Cum.        Cum.       Cum.
Reporting Area       2000**     1999        2000       1999       2000       1999        2000       2000       2000       2000        2000       1999
-----------------------------------------------------------------------------------------------------------------------------------------------------
UNITED STATES          69         92         673      1,418        304        449           -          1          -          -           1         12

NEW ENGLAND             5          4          16         19          5         14           -          -          -          -           -          -
Maine                   -          -           1          1          1          -           -          -          -          -           -          -
N.H.                    1          1           4          1          3          -           -          -          -          -           -          -
Vt.                     1          1           1          -          1          -           -          -          -          -           -          -
Mass.                   3          2           3          9          -          6           -          -          -          -           -          -
R.I.                    -          -           -          -          -          2           -          -          -          -           -          -
Conn.                   -          -           7          8          -          6           -          -          -          -           -          -

MID. ATLANTIC           7         16          16        100         21         70           -          -          -          -           -          -
Upstate N.Y.            6          8           7          9          4         11           -          -          -          -           -          -
N.Y. City               -          5           9         44         17         19           -          -          -          -           -          -
N.J.                    1          3           -         23          -         11           -          -          -          -           -          -
Pa.                     -          -           -         24          -         29           -          -          -          -           -          -

E.N. CENTRAL           12         15         108        390         48         57           -          1          -          -           1          -
Ohio                    7          8          47         55          9         12           -          -          -          -           -          -
Ind.                    2          -           2          4          1          4           -          -          -          -           -          -
Ill.                    2          7           6         79          -          -           -          -          -          -           -          -
Mich.                   1          -          52        248         38         37           -          1          -          -           1          -
Wis.                    -          -           1          4          -          4           -          -          -          -           -          -

W.N. CENTRAL            1          4          86         81         13         26           -          -          -          -           -          -
Minn.                   -          -           7          -          -          -           -          -          -          -           -          -
Iowa                    -          1          10          5          -          2           -          -          -          -           -          -
Mo.                     1          1          66         63         13         16           -          -          -          -           -          -
N. Dak.                 -          -           -          -          -          -           U          -          U          -           -          -
S. Dak.                 -          1           -          -          -          -           U          -          U          -           -          -
Nebr.                   -          -           3          7          -          6           -          -          -          -           -          -
Kans.                   -          1           -          6          -          2           U          -          U          -           -          -

S. ATLANTIC            17         19          45        101         38         66           -          -          -          -           -          -
Del.                    -          -           -          -          -          -           -          -          -          -           -          -
Md.                     9         15          11         42         13         25           -          -          -          -           -          -
D.C.                    -          -           -          6          -          -           -          -          -          -           -          -
Va.                     6          -           3          8          6          6           -          -          -          -           -          -
W. Va.                  -          -           -          -          -          -           -          -          -          -           -          -
N.C.                    2          2          20         10         11         26           -          -          -          -           -          -
S.C.                    -          1           1          -          1          7           -          -          -          -           -          -
Ga.                     -          1           -         35          -          2           -          -          -          -           -          -
Fla.                    -          -          10          -          7          -           -          -          -          -           -          -

E.S. CENTRAL            2          7          51         47         31         30           -          -          -          -           -          -
Ky.                     -          2           2          8          1          2           -          -          -          -           -          -
Tenn.                   2          2          15         13         23         12           -          -          -          -           -          -
Ala.                    -          2           8         17          2          8           -          -          -          -           -          -
Miss.                   -          1          26          9          5          8           -          -          -          -           -          -

W.S. CENTRAL            -          6          59        113          4         28           -          -          -          -           -          2
Ark.                    -          -           8          3          4          4           -          -          -          -           -          -
La.                     -          -           -          1          -          -           U          -          U          -           -          -
Okla.                   -          5           -         43          -          7           -          -          -          -           -          -
Tex.                    -          1          51         66          -         17           -          -          -          -           -          2

MOUNTAIN               18         12          78        157         37         53           -          -          -          -           -          -
Mont.                   -          -           1          -          1          -           -          -          -          -           -          -
Idaho                   1          -           3          1          3          4           -          -          -          -           -          -
Wyo.                    -          1           -          1          -          -           U          -          U          -           -          -
Colo.                   5          -          22         34          7         13           -          -          -          -           -          -
N. Mex.                 5          3           8          5         11         17           -          -          -          -           -          -
Ariz.                   6          5          31         90         14          8           -          -          -          -           -          -
Utah                    1          3           8         12          -          5           -          -          -          -           -          -
Nev.                    -          -           5         14          1          6           U          -          U          -           -          -

PACIFIC                 7          9         214        410        107        105           -          -          -          -           -         10
Wash.                   2          -           3          5          1          -           -          -          -          -           -          2
Oreg.                   2          3          24         16         11          6           -          -          -          -           -          8
Calif.                  -          5         185        386         94         97           -          -          -          -           -          -
Alaska                  -          1           2          2          1          2           -          -          -          -           -          -
Hawaii                  3          -           -          1          -          -           -          -          -          -           -          -

Guam                    -          -           -          2          -          1           U          -          U          -           -          -
P.R.                    -          -           -          4          -         13           U          -          U          -           -          -
V.I.                    -          U           -          U          -          U           U          -          U          -           -          U
Amer. Samoa             -          U           -          U          -          U           U          -          U          -           -          U
C.N.M.I.                -          U           -          U          -          U           U          -          U          -           -          U
-----------------------------------------------------------------------------------------------------------------------------------------------------
N: Not notifiable    U: Unavailable     -: no reported cases

 * For imported measles, cases include only those resulting from importation from other countries.
** Of 18 cases among children aged <5 years, serotype was reported for 6 and of those, 0 were type b.
=======================================================================================================================================================

TABLE III. (page 2) Provisional cases of selected notifiable diseases preventable by vaccination, United
States, weeks ending February 5, 2000, and February 5, 1999 (5th Week)

                     Meningococcal
                        Disease                      Mumps                           Pertussis                          Rubella
                   -----------------        --------------------------       ---------------------------       ---------------------------
                     Cum.       Cum.                   Cum.       Cum.                   Cum.       Cum.                  Cum.        Cum.
Reporting Area       2000       1999        2000       2000       1999       2000        2000       1999       2000       2000        1999
------------------------------------------------------------------------------------------------------------------------------------------
UNITED STATES         178        196           3         11         37         76         291        357          1          1           1

NEW ENGLAND            11         17           -          -          3         14          62         57          -          -           1
Maine                   1          2           -          -          -          2           2          -          -          -           -
N.H.                    -          2           -          -          1         12          20          1          -          -           -
Vt.                     1          1           -          -          -          -          20          7          -          -           -
Mass.                   4         12           -          -          2          -          20         49          -          -           1
R.I.                    1          -           -          -          -          -           -          -          -          -           -
Conn.                   4          -           -          -          -          -           -          -          -          -           -

MID. ATLANTIC          10         24           1          1          4          5          15         11          -          -           -
Upstate N.Y.            3          3           1          1          -          5          15          5          -          -           -
N.Y. City               4         10           -          -          2          -           -          4          -          -           -
N.J.                    3          7           -          -          -          -           -          2          -          -           -
Pa.                     -          4           -          -          2          -           -          -          -          -           -

E.N. CENTRAL           24         32           -          -          2         13          88         56          -          -           -
Ohio                    6         15           -          -          1         11          83         39          -          -           -
Ind.                    6          3           -          -          -          1           1          1          -          -           -
Ill.                    4         12           -          -          1          -           1          5          -          -           -
Mich.                   7          1           -          -          -          1           3          5          -          -           -
Wis.                    1          1           -          -          -          -           -          6          -          -           -

W.N. CENTRAL           26         19           -          2          1          2           4         11          -          -           -
Minn.                   -          -           -          -          -          2           3          -          -          -           -
Iowa                    3          3           -          1          1          -           -          4          -          -           -
Mo.                    23         10           -          -          -          -           1          1          -          -           -
N. Dak.                 -          -           U          -          -          U           -          -          U          -           -
S. Dak.                 -          3           U          -          -          U           -          1          U          -           -
Nebr.                   -          1           -          1          -          -           -          -          -          -           -
Kans.                   -          2           U          -          -          U           -          5          U          -           -

S. ATLANTIC            26         19           1          2          3          3          19         29          -          -           -
Del.                    -          -           -          -          -          -           -          -          -          -           -
Md.                     4          6           -          -          -          3           6         16          -          -           -
D.C.                    -          -           -          -          -          -           -          -          -          -           -
Va.                     5          2           -          -          -          -           1          1          -          -           -
W. Va.                  -          1           -          -          -          -           -          -          -          -           -
N.C.                    8          3           -          -          1          -           4         10          -          -           -
S.C.                    6          5           1          2          2          -           8          2          -          -           -
Ga.                     -          2           -          -          -          -           -          -          -          -           -
Fla.                    3          -           -          -          -          -           -          -          -          -           -

E.S. CENTRAL            8         21           1          1          -          -           6         12          -          -           -
Ky.                     2          2           -          -          -          -           3          3          -          -           -
Tenn.                   3          8           -          -          -          -           1          4          -          -           -
Ala.                    3          8           1          1          -          -           2          5          -          -           -
Miss.                   -          3           -          -          -          -           -          -          -          -           -

W.S. CENTRAL            1         11           -          -          8          -           1          8          -          -           -
Ark.                    1          2           -          -          -          -           1          2          -          -           -
La.                     -          4           U          -          -          U           -          -          U          -           -
Okla.                   -          3           -          -          -          -           -          -          -          -           -
Tex.                    -          2           -          -          8          -           -          6          -          -           -

MOUNTAIN               11         21           -          -          3         36          86         79          1          1           -
Mont.                   -          -           -          -          -          -           -          -          -          -           -
Idaho                   1          3           -          -          -         12          13         36          -          -           -
Wyo.                    -          1           U          -          -          U           -          1          U          -           -
Colo.                   1          5           -          -          1         15          47         13          -          -           -
N. Mex.                 1          3           N          N          N          5          15          6          -          -           -
Ariz.                   6          5           -          -          -          3           8          7          -          -           -
Utah                    2          3           -          -          1          1           3         15          1          1           -
Nev.                    -          1           U          -          1          U           -          1          U          -           -

PACIFIC                61         32           -          5         13          3          10         94          -          -           -
Wash.                   4          3           -          -          -          1           2          1          -          -           -
Oreg.                  13          7           N          N          N          2           6          3          -          -           -
Calif.                 44         16           -          5          9          -           -         88          -          -           -
Alaska                  -          3           -          -          1          -           2          1          -          -           -
Hawaii                  -          3           -          -          3          -           -          1          -          -           -

Guam                    -          -           U          -          -          U           -          -          U          -           -
P.R.                    -          -           U          -          -          U           -          -          U          -           -
V.I.                    -          U           U          -          U          U           -          U          U          -           U
Amer. Samoa             -          U           U          -          U          U           -          U          U          -           U
C.N.M.I.                -          U           U          -          U          U           -          U          U          -           U

------------------------------------------------------------------------------------------------------------------------------------------
N: Not notifiable    U: Unavailable     -: no reported cases

=======================================================================================================================================================


Return to top.

Table IV
Note: To print large tables and graphs users may have to change their printer settings to landscape and use a small font size.
TABLE IV. Deaths in 122 U.S. cities,* week ending
February 5, 2000 (5th Week)
===================================================================================================================================
                                                 All Causes, By Age (Years)
                          ------------------------------------------------------------------------        P&I**
Reporting Area            All Ages         >=65        45-64       25-44         1-24           <1        Total
---------------------------------------------------------------------------------------------------------------
NEW ENGLAND                    508          364           83          40           12            9           60
Boston, Mass.                  152          108           23          14            4            3           16
Bridgeport, Conn.               45           34            7           4            -            -            6
Cambridge, Mass.                16           14            1           1            -            -            3
Fall River, Mass.               32           30            2           -            -            -            6
Hartford, Conn.                  U            U            U           U            U            U            U
Lowell, Mass.                   32           19           11           1            1            -            3
Lynn, Mass.                     18           12            4           2            -            -            1
New Bedford, Mass.              30           22            7           1            -            -            5
New Haven, Conn.                46           22           11           7            3            3            2
Providence, R.I.                 U            U            U           U            U            U            U
Somerville, Mass.                5            5            -           -            -            -            1
Springfield, Mass.              42           32            9           1            -            -            4
Waterbury, Conn.                30           21            5           3            -            1            3
Worcester, Mass.                60           45            3           6            4            2           10

MID. ATLANTIC                2,641        1,951          463         155           32           38          183
Albany, N.Y.                    50           36           11           2            -            1            4
Allentown, Pa.                   U            U            U           U            U            U            U
Buffalo, N.Y.                  132           90           29           9            -            2           10
Camden, N.J.                    44           29            7           7            -            1            1
Elizabeth, N.J.                 23           21            1           1            -            -            -
Erie, Pa.                       57           44           12           1            -            -            5
Jersey City, N.J.               64           51            7           2            2            2            -
New York City, N.Y.          1,349          998          239          81           17           14           67
Newark, N.J.                     U            U            U           U            U            U            U
Paterson, N.J.                  17           10            4           2            -            1            2
Philadelphia, Pa.              385          270           74          28            9            4           27
Pittsburgh, Pa.***              94           65           16           4            2            7           10
Reading, Pa.                    33           27            4           2            -            -            5
Rochester, N.Y.                143          115           21           6            -            1           16
Schenectady, N.Y.               30           25            4           1            -            -            7
Scranton, Pa.                   46           38            6           1            -            1            5
Syracuse, N.Y.                 101           82           12           3            2            2           14
Trenton, N.J.                   41           23           11           5            -            2            5
Utica, N.Y.                     32           27            5           -            -            -            5
Yonkers, N.Y.                    U            U            U           U            U            U            U

E.N. CENTRAL                 2,442        1,716          472         140           57           53          268
Akron, Ohio                     75           53           16           3            -            3           14
Canton, Ohio                    38           32            5           1            -            -            4
Chicago, Ill.                  411          262           86          37           14            8           47
Cincinnati, Ohio                92           69           16           4            1            2           17
Cleveland, Ohio                139           92           34          10            2            1            7
Columbus, Ohio                 208          143           52           7            3            3           16
Dayton, Ohio                   169          125           31           6            5            2           24
Detroit, Mich.                 243          156           51          20           10            6           22
Evansville, Ind.                63           49           10           3            1            -            7
Fort Wayne, Ind.                71           50           15           6            -            -           11
Gary, Ind.                      11            7            3           1            -            -            1
Grand Rapids, Mich.             78           61            6           1            3            7            9
Indianapolis, Ind.             256          180           50          13            3           10           21
Lansing, Mich.                  54           37           10           5            1            1            3
Milwaukee, Wis.                141          108           24           5            2            2           18
Peoria, Ill.                    53           40            4           6            2            1            1
Rockford, Ill.                  66           49           11           1            2            3            9
South Bend, Ind.                66           51            7           2            4            2            9
Toledo, Ohio                   130           86           33           6            3            2           19
Youngstown, Ohio                78           66            8           3            1            -            9

W.N. CENTRAL                 1,066          825          148          62           16           15          140
Des Moines, Iowa               113           94           12           5            1            1           25
Duluth, Minn.                   39           31            6           1            1            -            1
Kansas City, Kans.              42           26            8           5            3            -           11
Kansas City, Mo.               146          108           22          10            4            2           12
Lincoln, Nebr.                  35           27            5           3            -            -            3
Minneapolis, Minn.             241          203           26           7            2            3           27
Omaha, Nebr.                   104           75           17           8            -            4           10
St. Louis, Mo.                  87           69           11           4            1            2            -
St. Paul, Minn.                136          107           19           6            1            3           31
Wichita, Kans.                 123           85           22          13            3            -           20

S. ATLANTIC                  1,198          818          238          95           17           30          101
Atlanta, Ga.                     U            U            U           U            U            U            U
Baltimore, Md.                 125           78           31          11            2            3           10
Charlotte, N.C.                134           96           22          10            1            5           18
Jacksonville, Fla.             151          114           20          10            3            4           19
Miami, Fla.                    101           66           17          12            4            2            7
Norfolk, Va.                    69           53           13           2            -            1            5
Richmond, Va.                  101           68           23           5            1            4           11
Savannah, Ga.                   62           42           14           4            1            1           11
St. Petersburg, Fla.            69           46           13           6            1            3            4
Tampa, Fla.                    249          184           48          14            2            1           15
Washington, D.C.               120           63           37          12            2            6            1
Wilmington, Del.                17            8            -           9            -            -            -

E.S. CENTRAL                 1,003          717          188          60           20           17          146
Birmingham, Ala.               168          125           27          10            3            2           28
Chattanooga, Tenn.             105           79           18           5            3            -           18
Knoxville, Tenn.                86           64           14           5            3            -           10
Lexington, Ky.                  64           47           10           2            1            4           12
Memphis, Tenn.                 300          210           66          14            4            6           38
Mobile, Ala.                    83           61           14           6            2            -            6
Montgomery, Ala.                56           41            5           6            1            3           20
Nashville, Tenn.               141           90           34          12            3            2           14

W.S. CENTRAL                 2,002        1,399          389         117           55           42          211
Austin, Tex.                    79           54           15           7            1            2           11
Baton Rouge, La.                41           36            5           -            -            -            -
Corpus Christi, Tex.            83           54           20           7            1            1           15
Dallas, Tex.                   270          182           54          19            6            9           20
El Paso, Tex.                  167          106           33          11           13            4           20
Ft. Worth, Tex.                165          116           35           4            3            7           21
Houston, Tex.                  367          251           77          29            7            3           29
Little Rock, Ark.               82           57           18           4            1            2            5
New Orleans, La.               174          118           29          13           11            3            -
San Antonio, Tex.              265          196           50           9            6            4           41
Shreveport, La.                126           87           25           9            2            3           23
Tulsa, Okla.                   183          142           28           5            4            4           26

MOUNTAIN                     1,064          708          216          89           27           20          108
Albuquerque, N.M.              108           72           21          12            1            2           10
Boise, Idaho                    55           36           12           5            1            1            6
Colo. Springs, Colo.            56           41            9           2            1            3            3
Denver, Colo.                  111           71           24          10            4            2           16
Las Vegas, Nev.                248          157           61          19            8            3           24
Ogden, Utah                     34           26            6           -            2            -            8
Phoenix, Ariz.                 156           97           33          14            7            4           13
Pueblo, Colo.                   33           24            4           1            -            1            -
Salt Lake City, Utah            93           66           16           8            -            3            8
Tucson, Ariz.                  170          118           30          18            3            1           20

PACIFIC                      1,960        1,406          367         117           30           35          265
Berkeley, Calif.                17           10            5           -            -            2            2
Fresno, Calif.                 187          140           32          13            1            1           36
Glendale, Calif.                28           25            3           -            -            -            4
Honolulu, Hawaii                86           72            8           5            1            -           10
Long Beach, Calif.              76           53           14           5            1            3            9
Los Angeles, Calif.            381          262           81          23           10            5           28
Pasadena, Calif.                31           24            5           1            -            1            5
Portland, Oreg.                201          156           36           5            4            -           23
Sacramento, Calif.               U            U            U           U            U            U            U
San Diego, Calif.              198          140           28          19            3            4           41
San Francisco, Calif.          181          120           41          15            1            4           33
San Jose, Calif.               213          147           41          11            5            9           34
Santa Cruz, Calif.              46           32           11           2            1            -            6
Seattle, Wash.                 133           88           28           9            3            5           11
Spokane, Wash.                  72           60            8           3            -            1           10
Tacoma, Wash.                  110           77           26           6            -            -           13

TOTAL                   13,884****        9,904        2,564         875          266          259        1,482

---------------------------------------------------------------------------------------------------------------
U: Unavailable    -: no reported cases

   * Mortality data in this table are voluntarily reported from 122 cities in the United States, most of which have populations
     of 100,000 or more. A death is reported by the place of its occurrence and by the week that the death certificate was
     filed. Fetal deaths are not included.
  ** Pneumonia and influenza.
 *** Because of changes in reporting methods in this Pennsylvania city, these numbers are partial counts for the current
     week. Complete counts will be available in 4 to 6 weeks.
**** Total includes unknown ages.
===================================================================================================================================


Return to top.

Disclaimer   All MMWR HTML versions of articles are electronic conversions from ASCII text into HTML. This conversion may have resulted in character translation or format errors in the HTML version. Users should not rely on this HTML document, but are referred to the electronic PDF version and/or the original MMWR paper copy for the official text, figures, and tables. An original paper copy of this issue can be obtained from the Superintendent of Documents, U.S. Government Printing Office (GPO), Washington, DC 20402-9371; telephone: (202) 512-1800. Contact GPO for current prices.

**Questions or messages regarding errors in formatting should be addressed to