Skip Navigation LinksSkip Navigation Links
Centers for Disease Control and Prevention
Safer Healthier People
Blue White
Blue White
bottom curve
CDC Home Search Health Topics A-Z spacer spacer
spacer
Blue curve MMWR spacer
spacer
spacer

Notifiable Diseases/Deaths in Selected Cities Weekly Information

Figure I   Selected notifiable disease reports, comparison of provisional 4-week totals ending October 23,1999, with historical data -- United States

Table I   Summary -- provisional cases of selected notifiable diseases, United States, cumulative, week ending October 23,1999 (42nd Week)

Table II   Provisional cases of selected notifiable diseases, United States, weeks ending October 23,1999 and October 24, 1998 (42nd Week)

Table III   Provisional cases of selected notifiable diseases preventable by vaccination, United States, weeks ending October 23,1999 and October 24, 1998 (42nd Week)

Table IV   Deaths in 122 U.S. cities, week ending October 23,1999 (42nd Week)


Figure I

Figure I
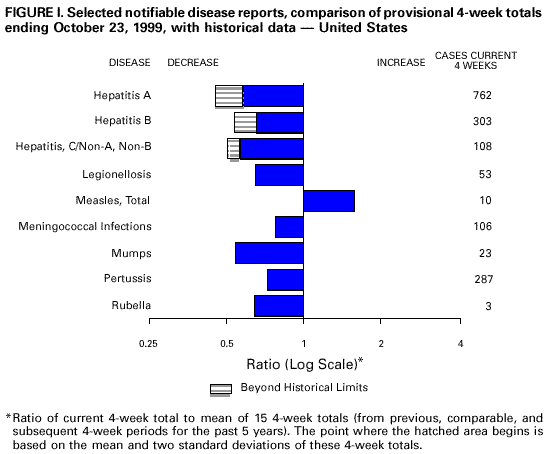
Return to top.

Table I
Note: To print large tables and graphs users may have to change their printer settings to landscape and use a small font size.
TABLE I. Summary -- provisional cases of selected notifiable diseases, United
States, cumulative, week ending October 23,1999 (42nd Week)
==================================================================================
                                             Cum. 1999
------------------------------------------------------
Anthrax                                              -
Brucellosis*                                        36
Cholera                                              5
Congenital rubella syndrome                          5
Cyclosporiasis*                                     49
Diphtheria                                           2
Encephalitis:  California*                          49
               eastern equine*                       5
               St. Louis*                            3
               western equine*                       -
Ehrlichiosis   human granulocytic (HGE)*           119
               human monocytic (HME)*               35
Hansen Disease*                                     78
Hantavirus pulmonary syndrome*+                     18
Hemolytic uremic syndrome, post-diarrheal*          77
HIV infection, pediatric*&                         109
Plague                                               5
Poliomyelitis, paralytic                             -
Psittacosis*                                        17
Rabies, human                                        -
Rocky Mountain spotted fever (RMSF)                438
Streptococcal disease, invasive Group A          1,702
Streptococcal toxic-shock syndrome*                 30
Syphilis, congenital@                              155
Tetanus                                             31
Toxic-shock syndrome                                96
Trichinosis                                          8
Typhoid fever                                      254
Yellow fever                                         -
------------------------------------------------------
-: no reported cases
 * Not notifiable in all states
 + Updated weekly from reports to the Division of Viral and Rickettsial
   Diseases, National Center for Infectious Diseases (NCID).
 & Updated monthly from reports to the Division of HIV/AIDS Prevention --
   Surveillance and Epidemiology, National Center for HIV, STD, and TB
   Prevention (NCHSTP), last update September 26, 1999.
 @ Updated from reports to the Division of STD Prevention, NCHSTP.

==================================================================================


Return to top.

Table II
Note: To print large tables and graphs users may have to change their printer settings to landscape and use a small font size.
TABLE II. (page 1) Provisional cases of selected notifiable diseases, United States, weeks ending
October 23,1999, and October 24, 1998 (42nd Week)

                                                                                                    Escherichia
                                                                                                   coli O157:H7*
                                                                                     -----------------------------------------
                          AIDS              Chlamydia          Cryptosporidiosis            NETSS                  PHLIS
                   -----------------   --------------------   -------------------    -------------------      ----------------
                     Cum.       Cum.        Cum.       Cum.       Cum.       Cum.        Cum.       Cum.       Cum.       Cum.
Reporting Area       1999**     1998        1999       1998       1999       1999        1999       1998       1999       1998
------------------------------------------------------------------------------------------------------------------------------
UNITED STATES      34,088     37,409     458,235    475,663      1,776      3,208       2,671      2,439      1,848      1,915

NEW ENGLAND         1,698      1,444      16,195     16,417        122        137         276        285        278        239
Maine                  54         24         738        812         24         29          34         33          -          -
N.H.                   36         25         750        803         17         14          28         42         29         42
Vt.                    13         18         387        338         33         22          31         19         18         17
Mass.               1,116        766       7,438      6,783         44         65         156        132        156        136
R.I.                   77        105       1,857      1,858          4          7          27         11          6          1
Conn.                 402        506       5,025      5,823          -          -           U         48         69         43

MID. ATLANTIC       8,684     10,309      50,747     49,402        275        483         222        261         60         83
Upstate N.Y.          952      1,248           N          N        131        287         172        187          -          -
N.Y. City           4,588      5,843      21,963     21,348        112        174           8         12         15         12
N.J.                1,619      1,839       8,632      9,585         22         22          42         62         32         50
Pa.                 1,525      1,379      20,152     18,469         10          N           N          N         13         21

E.N. CENTRAL        2,280      2,651      67,472     80,335        399        651         574        387        421        317
Ohio                  345        567      19,151     21,807         54         63         199        103        167         60
Ind.                  258        412       8,856      8,905         33         51          82         81         52         47
Ill.                1,108        986      21,692     21,629         17         75         188        102         81         73
Mich.                 456        530      17,773     16,763         42         36         105        101         73         62
Wis.                  113        156           U     11,231        253        426           N          N         48         75

W.N. CENTRAL          770        685      26,710     28,234        182        245         520        410        360        368
Minn.                 138        135       5,529      5,675         69         79         207        178        155        194
Iowa                   69         58       3,438      3,637         51         61         102         84         67         54
Mo.                   370        313       9,298     10,180         24         21          42         41         55         59
N. Dak.                 6          5         325        831         16         28          16         10         14         15
S. Dak.                14         13       1,293      1,240          7         19          42         25         57         33
Nebr.                  60         60       2,601      2,278         14         31          90         43          -          -
Kans.                 113        101       4,226      4,393          1          6          21         29         12         13

S. ATLANTIC         9,423      9,742      95,743     91,406        324        284         280        200        142        156
Del.                  129        112       2,207      2,080          -          3           6          -          3          2
Md.                 1,113      1,386       8,200      6,043         15         18          30         35          2         14
D.C.                  412        692           N          N          8         21           -          1          U          U
Va.                   608        769      11,398     11,199         21         20          66          N         48         51
W. Va.                 53         68       1,204      1,971          3          1          10          8          7          8
N.C.                  629        703      18,284     17,661         20          N          61         46         48         47
S.C.                  797        637       9,885     13,833          -          -          19         11         14          8
Ga.                 1,382        980      21,374     19,100        121         92          28         66          -          -
Fla.                4,300      4,395      23,191     19,519        136        129          60         33         20         26

E.S. CENTRAL        1,536      1,540      37,113     33,034         24         24         107        106         56         61
Ky.                   214        246       6,084      5,166          6         10          38         33          -          -
Tenn.                 588        570      11,502     11,011          6          8          43         47         36         39
Ala.                  405        417      10,365      8,200         10          N          21         21         16         18
Miss.                 329        307       9,162      8,657          2          6           5          5          4          4

W.S. CENTRAL        3,524      4,667      67,148     72,268         66        887          90         83        101         92
Ark.                  132        176       4,751      3,145          1          6          12         10          8         10
La.                   663        756      10,879     11,978         22         15           9          4         13          7
Okla.                 101        238       6,432      7,940          9          N          21         13         17          8
Tex.                2,628      3,497      45,086     49,205         34        866          48         56         63         67

MOUNTAIN            1,343      1,289      25,725     26,438         86        118         251        317        152        224
Mont.                   8         26       1,262      1,043         10         10          22         15          -          5
Idaho                  19         19       1,375      1,623          7         17          39         36         20         24
Wyo.                   10          3         630        566          1          2          14         53          5         55
Colo.                 235        254       4,944      6,520         11         16          90         71         81         57
N. Mex.                74        188       2,992      2,866         38         46          11         17          5         18
Ariz.                 697        502      10,201      9,436         12         18          28         43         19         26
Utah                  116        101       1,752      1,706          N          N          32         67         20         21
Nev.                  184        196       2,569      2,678          7          9          15         15          2         18

PACIFIC             4,830      5,082      71,382     78,129        298        379         351        390        278        375
Wash.                 285        331       9,534      8,875          N          N         136         84        119        116
Oreg.                 151        138       5,041      4,480         87         63          71         99         66         93
Calif.              4,319      4,452      52,994     61,204        211        313         135        201         82        152
Alaska                 13         17       1,528      1,511          -          -           1          6          1          -
Hawaii                 62        144       2,285      2,059          -          3           8          -         10         14

Guam                    5          -         302        341          -          -           N          N          U          U
P.R.                1,013      1,421           U          U          -          N           5          5          U          U
V.I.                   25         25           U          U          U          U           U          U          U          U
Amer. Samoa             -          -           U          U          U          U           U          U          U          U
C.N.M.I.                -          -           U          U          U          U           U          U          U          U
------------------------------------------------------------------------------------------------------------------------------
N: Not notifiable    U: Unavailable    -: no reported cases    C.N.M.I.: Commonwealth of North Mariana Islands

 * Individual cases may be reported through both the National Electronic Telecommunications System for Surveillance (NETSS)
   and the Public Health Laboratory Information System (PHLIS).
** Updated monthly from reports to the Division of HIV/AIDS Prevention -- Surveillance and Epidemiology, National Center for HIV,
   STD, and TB Prevention, last update September 26, 1999.

=======================================================================================================================================================

TABLE II. (page 2) Provisional cases of selected notifiable diseases, United States, weeks ending
October 23,1999, and October 24, 1998 (42nd Week)

                                            Hepatitis                                       Lyme
                       Gonorrhea             C/NA,NB             Legionellosis             Disease
                   -----------------   --------------------   -------------------    -------------------
                     Cum.       Cum.        Cum.       Cum.       Cum.       Cum.        Cum.       Cum.
Reporting Area       1999       1998        1999       1998       1999       1998        1999       1998
--------------------------------------------------------------------------------------------------------
UNITED STATES     254,085    283,198       2,652      2,671        693      1,059       8,986     13,498

NEW ENGLAND         4,980      4,889          59         54         63         73       3,114      4,194
Maine                  42         55           2          -          3          1          41         70
N.H.                   88         75           -          -          6          6          16         38
Vt.                    37         32           6          4         13          5          18         11
Mass.               2,064      1,800          48         47         23         31         990        658
R.I.                  478        312           3          3          7         19         408        503
Conn.               2,271      2,615           -          -         11         11       1,641      2,914

MID. ATLANTIC      32,408     30,713         109        177        129        258       4,358      7,406
Upstate N.Y.        5,618      5,726          74         90         49         80       3,226      3,450
N.Y. City          11,762      9,602           -          -          9         33          29        203
N.J.                5,309      6,463           -          U         13         15         389      1,635
Pa.                 9,719      8,922          35         87         58        130         714      2,118

E.N. CENTRAL       45,168     55,302       1,333        573        192        354         103        687
Ohio               11,535     14,165           3          7         64        110          68         38
Ind.                4,893      5,250           1          5         32         62          19         34
Ill.               16,115     18,030          38         37         10         48          10         14
Mich.              12,625     12,733         700        392         57         70           1         12
Wis.                    U      5,124         591        132         29         64           5        589

W.N. CENTRAL       10,852     13,976         159         35         42         59         195        188
Minn.               2,125      2,179           7          9          9          6         132        142
Iowa                  903      1,219           -          8         11          9          19         23
Mo.                 4,686      7,316         141         12         14         16          21         11
N. Dak.                31         66           -          -          1          -           1          -
S. Dak.               153        187           -          -          3          3           -          -
Nebr.               1,128        944           5          4          4         18          10          3
Kans.               1,826      2,065           6          2          -          7          12          9

S. ATLANTIC        71,513     76,024         178         89        110        118         948        765
Del.                1,372      1,214           1          -         11         12          41         58
Md.                 6,502      7,508          39         12         24         29         671        550
D.C.                3,013      3,617           1          -          3          6           4          4
Va.                 7,547      7,529          10         11         28         17         109         56
W. Va.                363        708          17          6          N          N          16         11
N.C.               16,265     15,308          33         19         13         11          63         48
S.C.                5,704      8,720          22          5          7         10           5          5
Ga.                14,359     16,162           1          9          1          8           -          5
Fla.               16,388     15,258          54         27         23         25          39         28

E.S. CENTRAL       29,689     31,860         213        246         38         56          70         94
Ky.                 2,759      3,004          15         19         20         26           8         24
Tenn.               9,268      9,620          80        146         14         18          30         41
Ala.                9,285     10,527           2          4          4          5          19         16
Miss.               8,377      8,709         116         77          -          7          13         13

W.S. CENTRAL       37,663     44,318         191        443          6         29          28         19
Ark.                2,474      3,243          16         16          -          1           4          6
La.                 8,653     10,154         102         80          2          3           -          4
Okla.               3,162      4,348          14         12          3         12           4          2
Tex.               23,374     26,573          59        335          1         13          20          7

MOUNTAIN            7,625      7,394         124        335         41         62          16         14
Mont.                  43         32           5          7          -          2           -          -
Idaho                  69        142           7         86          2          2           5          4
Wyo.                   26         28          37         83          -          1           3          1
Colo.               1,936      1,702          20         26         11         15           -          -
N. Mex.               602        711           8         82          1          2           1          4
Ariz.               3,699      3,413          33         11          6         14           -          -
Utah                  174        183           6         21         15         20           5          -
Nev.                1,076      1,183           8         19          6          6           2          5

PACIFIC            14,187     18,722         286        719         72         50         154        131
Wash.               1,625      1,591          16         21         11          9           7          7
Oreg.                 730        644          17         16          N          N          11         19
Calif.             11,257     15,811         253        628         60         39         136        104
Alaska                247        253           -          -          1          1           -          1
Hawaii                328        423           -         54          -          1           N          N

Guam                   39         57           1          1          -          2           -          1
P.R.                  255        303           -          -          -          -           N          N
V.I.                    U          U           U          U          U          U           U          U
Amer. Samoa             U          U           U          U          U          U           U          U
C.N.M.I.                U          U           U          U          U          U           U          U

--------------------------------------------------------------------------------------------------------
N: Not notifiable    U: Unavailable    -: no reported cases
=======================================================================================================================================================

TABLE II. (page 3) Provisional cases of selected notifiable diseases, United States, weeks ending
October 23,1999, and October 24, 1998 (42nd Week)

                                                                            Salmonellosis*
                                                              ------------------------------------------
                        Malaria           Rabies, Animal             NETSS                  PHLIS
                   -----------------   --------------------   -------------------    -------------------
                     Cum.       Cum.        Cum.       Cum.       Cum.       Cum.        Cum.       Cum.
Reporting Area       1999       1998        1999       1998       1999       1998        1999       1998
--------------------------------------------------------------------------------------------------------
UNITED STATES       1,023      1,201       4,909      6,155     29,210     34,104      23,596     28,586

NEW ENGLAND            51         52         735      1,226      1,381      2,025       1,642      1,952
Maine                   3          4         142        201        120        146          90         56
N.H.                    2          5          48         71        113        156         121        198
Vt.                     4          1          86         56         80        116          73         91
Mass.                  16         16         174        432        959      1,136         923      1,164
R.I.                    4          8          78         80        109        114          52         34
Conn.                  22         18         207        386          U        357         383        409

MID. ATLANTIC         230        361         906      1,335      3,249      5,481       2,995      5,010
Upstate N.Y.           60         80         681        937      1,082      1,319         900      1,187
N.Y. City             106        206           U          U      1,133      1,644         853      1,291
N.J.                   43         49         152        180        508      1,214         535      1,164
Pa.                    21         26          73        218        526      1,304         707      1,368

E.N. CENTRAL           95        127         136        114      4,459      5,287       2,936      4,036
Ohio                   18         14          32         52      1,109      1,271         895        980
Ind.                   18         10          12          9        440        568         350        451
Ill.                   20         51          10          N      1,366      1,628         399      1,274
Mich.                  33         42          79         34        826        965         824        886
Wis.                    6         10           3         19        718        855         468        445

W.N. CENTRAL           63         75         600        616      1,886      1,926       1,913      1,993
Minn.                  33         42          92        102        557        467         599        553
Iowa                   13          7         140        134        225        325         186        259
Mo.                    13         14          13         36        586        524         773        722
N. Dak.                 -          2         125        122         41         52          47         67
S. Dak.                 -          -         140        140         83         99         105        107
Nebr.                   -          1           3          7        175        155           -         38
Kans.                   4          9          87         75        219        304         203        247

S. ATLANTIC           296        249       1,758      2,025      7,007      6,835       4,415      5,130
Del.                    1          3          37         40        114         67         137        106
Md.                    84         75         337        398        738        766         802        742
D.C.                   17         16           -          -         65         64           U          U
Va.                    62         49         466        481      1,102        916         789        757
W. Va.                  2          2          93         65        138        121         135        132
N.C.                   26         23         362        498      1,071        990       1,140      1,184
S.C.                   16          6         129        121        566        511         394        462
Ga.                    21         33         178        261      1,133      1,363         651      1,275
Fla.                   67         42         156        161      2,080      2,037         367        472

E.S. CENTRAL           20         27         223        237      1,576      1,900         902      1,354
Ky.                     7          5          33         27        333        310           -        124
Tenn.                   6         14          79        124        317        497         451        599
Ala.                    6          6         110         84        494        584         374        501
Miss.                   1          2           1          2        432        509          77        130

W.S. CENTRAL           16         32          87         28      2,654      3,800       2,752      2,667
Ark.                    3          1          14         28        526        490         120        300
La.                    10         13           -          -        334        563         472        657
Okla.                   2          3          73          N        359        398         271        189
Tex.                    1         15           -          -      1,435      2,349       1,889      1,521

MOUNTAIN               41         58         172        224      2,505      2,127       2,094      1,764
Mont.                   4          1          52         47         50         70           1         43
Idaho                   3          8           -          N         90        101          77         81
Wyo.                    1          -          41         55         55         57          22         50
Colo.                  15         18           1         38        609        467         631        444
N. Mex.                 2         12           9          6        295        255         217        224
Ariz.                   9          8          57         46        799        672         665        608
Utah                    4          1           7         26        441        300         428        122
Nev.                    3         10           5          6        166        205          53        192

PACIFIC               211        220         292        350      4,493      4,723       3,947      4,680
Wash.                  22         17           -          -        523        399         670        556
Oreg.                  19         15           1          7        378        259         446        283
Calif.                162        182         284        320      3,255      3,785       2,569      3,561
Alaska                  1          2           7         23         50         50          15         31
Hawaii                  7          4           -          -        287        230         247        249

Guam                    -          2           -          -         24         29           U          U
P.R.                    -          -          61         45        255        622           U          U
V.I.                    U          U           U          U          U          U           U          U
Amer. Samoa             U          U           U          U          U          U           U          U
C.N.M.I.                U          U           U          U          U          U           U          U

--------------------------------------------------------------------------------------------------------
N: Not notifiable    U: Unavailable    -: no reported cases

* Individual cases may be reported through both the National Electronic Telecommunications System for Surveillance (NETSS)
  and the Public Health Laboratory Information System (PHLIS).
=======================================================================================================================================================

TABLE II. (page 4) Provisional cases of selected notifiable diseases, United States, weeks ending
October 23,1999, and October 24, 1998 (42nd Week)

                                  Shigellosis*
                    ---------------------------------------          Syphilis
                         NETSS                  PHLIS          (Primary & Secondary)      Tuberculosis
                    ----------------       ----------------    ---------------------    ------------------
                     Cum.       Cum.        Cum.       Cum.       Cum.       Cum.        Cum.       Cum.
Reporting Area       1999       1998        1999       1998       1999       1998        1999**     1998**
----------------------------------------------------------------------------------------------------------
UNITED STATES      12,166     17,156       5,931      9,764      5,089      5,801      11,290     13,425

NEW ENGLAND           578        365         556        328         46         63         330        348
Maine                   5         12           -          -          -          1          16         11
N.H.                   16         15          14         18          -          2          10          -
Vt.                     6          6           4          1          3          4           1          4
Mass.                 529        243         481        236         28         35         194        197
R.I.                   22         31           9         13          2          1          35         41
Conn.                   U         58          48         60         13         20          74         95

MID. ATLANTIC         743      2,035         370      1,519        216        259       2,087      2,342
Upstate N.Y.          239        489          45        172         24         35         259        291
N.Y. City             238        620          82        542         79         60       1,120      1,154
N.J.                  195        603         121        566         48         79         422        497
Pa.                    71        323         122        239         65         85         286        400

E.N. CENTRAL        2,274      2,369       1,120      1,258        950        850       1,061      1,341
Ohio                  368        424         115        110         75        121         199        194
Ind.                  250        143          90         35        374        165          76        130
Ill.                  868      1,295         592      1,051        316        349         465        634
Mich.                 363        227         255          4        185        160         239        299
Wis.                  425        280          68         58          U         55          82         84

W.N. CENTRAL          942        882         609        515        102        112         360        382
Minn.                 207        268         208        296          9          8         129        119
Iowa                   46         61          41         40          9          2          37         38
Mo.                   575        117         316         88         67         84         137        142
N. Dak.                 2          7           2          3          -          -           6          8
S. Dak.                13         31           6         21          -          1          17         16
Nebr.                  62        338           -         19          7          4          15         18
Kans.                  37         60          36         48         10         13          19         41

S. ATLANTIC         1,979      3,506         385      1,086      1,604      2,100       2,343      2,470
Del.                   12         27           8         25          8         20          12         32
Md.                   136        177          47         63        300        570         219        253
D.C.                   46         25           U          U         58         71          35         89
Va.                   112        168          43         78        124        121         221        222
W. Va.                  8         11           5          7          2          2          35         32
N.C.                  168        252          77        139        400        608         348        351
S.C.                  109        147          53         71        218        240         207        227
Ga.                   195        928          37        219        248        233         457        431
Fla.                1,193      1,771         115        484        246        235         809        833

E.S. CENTRAL          913        925         450        713        936      1,014         715        918
Ky.                   216        110           -         45         85         87         151        135
Tenn.                 508        366         393        457        517        476         257        293
Ala.                   96        401          47        204        186        235         251        309
Miss.                  93         48          10          7        148        216          56        181

W.S. CENTRAL        1,740      3,385       1,727      1,073        783        873       1,239      2,007
Ark.                   71        177          23         55         57         94         135        114
La.                   118        266          99        233        200        347           U        243
Okla.                 425        396         143        111        153         77         108        142
Tex.                1,126      2,546       1,462        674        373        355         996      1,508

MOUNTAIN              894      1,034         533        629        199        212         366        439
Mont.                   7          8           -          3          1          -          10         18
Idaho                  24         18           9         13          1          2          14         10
Wyo.                    3          3           1          1          -          1           3          4
Colo.                 156        170         121        131          2         10           U         52
N. Mex.               109        251          62        141         11         22          49         54
Ariz.                 460        498         322        294        176        159         180        157
Utah                   57         38          12         28          2          4          35         45
Nev.                   78         48           6         18          6         14          75         99

PACIFIC             2,103      2,655         181      2,643        253        318       2,789      3,178
Wash.                  92        171          79        149         57         27         136        208
Oreg.                  78        124          75        131          9          4          86        115
Calif.              1,905      2,318           -      2,318        184        283       2,384      2,667
Alaska                  2          6           2          3          1          1          43         43
Hawaii                 26         36          25         42          2          3         140        145

Guam                    8         31           U          U          1          1          11         76
P.R.                   62         47           U          U        134        151          41        122
V.I.                    U          U           U          U          U          U           U          U
Amer. Samoa             U          U           U          U          U          U           U          U
C.N.M.I.                U          U           U          U          U          U           U          U

----------------------------------------------------------------------------------------------------------
N: Not notifiable    U: Unavailable    -: no reported cases

 * Individual cases may be reported through both the National Electronic Telecommunications System for Surveillance (NETSS)
   and the Public Health Laboratory Information System (PHLIS).
** Cumulative reports of provisional tuberculosis cases for 1998 and 1999 are unavailable ('U') for some
   areas using the Tuberculosis Information Management System (TIMS).

=======================================================================================================================================================


Return to top.

Table III
Note: To print large tables and graphs users may have to change their printer settings to landscape and use a small font size.
TABLE III. (page 1) Provisional cases of selected notifiable diseases preventable by vaccination, United
States, weeks ending October 23,1999, and October 24, 1998 (42nd Week)

                                                Hepatitis (Viral), by type                                    Measles (Rubeola)
                     H. influenzae,       ---------------------------------------        ------------------------------------------------------------
                        invasive                  A                     B                  Indigenous            Imported*                 Total
                    ----------------      -----------------     -----------------        ---------------       ---------------        ---------------
                     Cum.       Cum.        Cum.       Cum.       Cum.       Cum.                   Cum.                  Cum.        Cum.       Cum.
Reporting Area       1999**     1998        1999       1998       1999       1998        1999       1999       1999       1999        1999       1998
-----------------------------------------------------------------------------------------------------------------------------------------------------
UNITED STATES         943        883      12,405     18,126      5,122      7,815           1         53          -         22          75         77

NEW ENGLAND            77         62         228        237         78        174           -          6          -          5          11          3
Maine                   5          3          11         16          1          2           -          -          -          -           -          -
N.H.                   17         10          15         11         13         16           U          -          U          1           1          -
Vt.                     5          7          17         14          2          8           -          -          -          -           -          1
Mass.                  28         36          70        106         33         64           -          5          -          3           8          2
R.I.                    5          5          16         14         29         58           -          -          -          -           -          -
Conn.                  17          1          99         76          -         26           -          1          -          1           2          -

MID. ATLANTIC         142        140         768      1,423        520      1,021           -          -          -          2           2         14
Upstate N.Y.           70         47         222        295        156        197           -          -          -          2           2          2
N.Y. City              31         39         233        500        161        360           -          -          -          -           -          -
N.J.                   40         47          64        299         41        175           -          -          -          -           -          8
Pa.                     1          7         249        329        162        289           -          -          -          -           -          4

E.N. CENTRAL          147        150       2,345      2,920        536      1,190           -          1          -          1           2         15
Ohio                   51         45         559        263         81         66           -          -          -          -           -          1
Ind.                   21         36          94        128         36         93           -          1          -          -           1          3
Ill.                   62         53         545        659          1        202           -          -          -          -           -          -
Mich.                  13          9       1,104      1,701        413        383           -          -          -          1           1         10
Wis.                    -          7          43        169          5        446           -          -          -          -           -          1

W.N. CENTRAL           79         80         640      1,196        253        334           -          1          -          -           1          -
Minn.                  38         62          63        110         41         41           -          1          -          -           1          -
Iowa                    9          2         118        383         33         50           -          -          -          -           -          -
Mo.                    23          9         358        556        137        197           -          -          -          -           -          -
N. Dak.                 1          -           2          3          -          4           U          -          U          -           -          -
S. Dak.                 1          -           9         28          1          2           -          -          -          -           -          -
Nebr.                   3          1          50         25         14         18           -          -          -          -           -          -
Kans.                   4          6          40         91         27         22           -          -          -          -           -          -

S. ATLANTIC           210        158       1,668      1,568      1,002        811           1         10          -          5          15          8
Del.                    -          -           2          3          1          3           -          -          -          -           -          1
Md.                    55         50         301        338        142        115           -          -          -          -           -          1
D.C.                    4          -          54         55         21         11           -          -          -          -           -          -
Va.                    16         16         142        174         75         84           1         10          -          3          13          2
W. Va.                  6          6          32          6         22          8           -          -          -          -           -          -
N.C.                   29         23         134         99        194        173           -          -          -          -           -          -
S.C.                    5          3          41         33         63         33           -          -          -          -           -          -
Ga.                    55         35         406        501        146        127           -          -          -          -           -          2
Fla.                   40         25         556        359        338        257           U          -          U          2           2          2

E.S. CENTRAL           52         50         326        336        345        412           -          2          -          -           2          2
Ky.                     6          7          55         27         36         40           -          2          -          -           2          -
Tenn.                  28         29         142        193        166        230           -          -          -          -           -          1
Ala.                   15         12          47         61         74         65           -          -          -          -           -          1
Miss.                   3          2          82         55         69         77           -          -          -          -           -          -

W.S. CENTRAL           45         48       2,360      3,209        722      1,724           -          6          -          4          10          -
Ark.                    2          -          43         74         49         91           -          1          -          -           1          -
La.                     7         20          73         85         77        127           U          -          U          -           -          -
Okla.                  32         25         389        491        108         71           -          -          -          -           -          -
Tex.                    4          3       1,855      2,559        488      1,435           -          5          -          4           9          -

MOUNTAIN               96         97       1,083      2,714        487        693           -          3          -          -           3          -
Mont.                   2          -          17         87         17          5           -          -          -          -           -          -
Idaho                   1          -          36        221         25         38           -          -          -          -           -          -
Wyo.                    1          1           7         33         12          9           -          -          -          -           -          -
Colo.                  11         21         189        271         79         89           -          -          -          -           -          -
N. Mex.                18          6          43        126        152        271           -          -          -          -           -          -
Ariz.                  52         46         630      1,617        129        149           -          1          -          -           1          -
Utah                    8          4          45        164         29         62           -          2          -          -           2          -
Nev.                    3         19         116        195         44         70           -          -          -          -           -          -

PACIFIC                95         98       2,987      4,523      1,179      1,456           -         24          -          5          29         35
Wash.                   4          8         270        857         56         87           -          -          -          -           -          1
Oreg.                  38         37         216        357         81        154           -          9          -          -           9          -
Calif.                 40         43       2,480      3,242      1,016      1,190           -         15          -          4          19          7
Alaska                  6          3           9         16         14         12           -          -          -          -           -         27
Hawaii                  7          7          12         51         12         13           -          -          -          1           1          -

Guam                    -          -           2          1          2          2           U          1          U          -           1          -
P.R.                    1          2         112         58        102        203           -          -          -          -           -          -
V.I.                    U          U           U          U          U          U           U          U          U          U           U          U
Amer. Samoa             U          U           U          U          U          U           U          U          U          U           U          U
C.N.M.I.                U          U           U          U          U          U           U          U          U          U           U          U
-----------------------------------------------------------------------------------------------------------------------------------------------------
N: Not notifiable    U: Unavailable     -: no reported cases

 * For imported measles, cases include only those resulting from importation from other countries.
** Of 180 cases among children aged <5 years, serotype was reported for 92 and of those, 24 were type b.
=======================================================================================================================================================

TABLE III. (page 2) Provisional cases of selected notifiable diseases preventable by vaccination, United
States, weeks ending October 23,1999, and October 24, 1998 (42nd Week)

                     Meningococcal
                        Disease                      Mumps                           Pertussis                          Rubella
                   -----------------        --------------------------       ---------------------------       ---------------------------
                     Cum.       Cum.                   Cum.       Cum.                   Cum.       Cum.                  Cum.        Cum.
Reporting Area       1999       1998        1999       1999       1998       1999        1999       1998       1999       1999        1998
------------------------------------------------------------------------------------------------------------------------------------------
UNITED STATES       1,938      2,162           6        269        553         87       4,374      5,244          -        226         345

NEW ENGLAND            97         96           2          8          7         11         522        847          -          7          38
Maine                   5          6           -          -          -          -           -          5          -          -           -
N.H.                   12         11           U          1          -          U          78         95          U          -           -
Vt.                     4          5           -          1          -          2          54         66          -          -           -
Mass.                  57         42           -          4          4          -         343        633          -          7           8
R.I.                    4          7           2          2          1          9          33          9          -          -           1
Conn.                  15         25           -          -          2          -          14         39          -          -          29

MID. ATLANTIC         174        228           1         29        178          1         689        520          -         22         146
Upstate N.Y.           55         62           1         10          6          1         603        278          -         18         114
N.Y. City              45         29           -          3        155          -          10         31          -          -          18
N.J.                   41         51           -          -          6          -          12         23          -          1          13
Pa.                    33         86           -         16         11          -          64        188          -          3           1

E.N. CENTRAL          341        332           -         33         69         17         343        664          -          2           -
Ohio                  121        122           -         14         26          4         177        232          -          -           -
Ind.                   56         57           -          4          6          4          58        120          -          1           -
Ill.                   93         87           -          8          9          8          57         91          -          1           -
Mich.                  40         39           -          7         26          1          47         59          -          -           -
Wis.                   31         27           -          -          2          -           4        162          -          -           -

W.N. CENTRAL          213        186           -         12         28          -         329        469          -        123          39
Minn.                  46         29           -          1         12          -         186        271          -          5           -
Iowa                   39         35           -          6         10          -          46         63          -         29           -
Mo.                    84         69           -          2          3          -          50         32          -          2           2
N. Dak.                 3          5           U          -          2          U           4          3          U          -           -
S. Dak.                11          7           -          -          -          -           5          8          -          -           -
Nebr.                  12         13           -          -          -          -           3         15          -         87           -
Kans.                  18         28           -          3          1          -          35         77          -          -          37

S. ATLANTIC           341        354           2         45         43          -         341        273          -         36          18
Del.                    8          2           -          -          -          -           5          5          -          -           -
Md.                    49         25           1          4          -          -          96         53          -          1           1
D.C.                    1          1           -          2          -          -           -          1          -          -           -
Va.                    45         32           1         10          7          -          19         29          -          -           1
W. Va.                  6         14           -          -          -          -           3          1          -          -           -
N.C.                   38         49           -          8         10          -          85         89          -         35          13
S.C.                   42         49           -          4          6          -          15         25          -          -           -
Ga.                    54         84           -          4          1          -          35         24          -          -           -
Fla.                   98         98           U         13         19          U          83         46          U          -           3

E.S. CENTRAL          120        168           -         11         14          -          69        109          -          1           2
Ky.                    26         30           -          -          -          -          21         49          -          -           -
Tenn.                  43         60           -          -          1          -          27         32          -          -           2
Ala.                   30         44           -          8          8          -          18         24          -          1           -
Miss.                  21         34           -          3          5          -           3          4          -          -           -

W.S. CENTRAL          146        265           -         30         54          3         151        322          -         15          87
Ark.                   31         27           -          -         11          -          18         71          -          6           -
La.                    34         51           U          3          7          U           3          8          U          -           -
Okla.                  26         36           -          1          -          -          12         31          -          -           -
Tex.                   55        151           -         26         36          3         118        212          -          9          87

MOUNTAIN              123        120           -         23         35         32         600        904          -         16           5
Mont.                   2          4           -          -          -          -           2          9          -          -           -
Idaho                  10         10           -          1          4          4         135        212          -          -           -
Wyo.                    4          5           -          -          1          -           2          8          -          -           -
Colo.                  31         23           -          5          6         12         177        223          -          1           -
N. Mex.                14         24           N          N          N         16         126         86          -          -           1
Ariz.                  41         37           -          7          6          -          98        181          -         13           1
Utah                   14         10           -          5          5          -          55        146          -          1           2
Nev.                    7          7           -          5         13          -           5         39          -          1           1

PACIFIC               383        413           1         78        125         23       1,330      1,136          -          4          10
Wash.                  59         58           -          2          9          8         587        270          -          -           5
Oreg.                  66         72           N          N          N          2          46         77          -          -           -
Calif.                247        275           1         62         91         13         663        759          -          4           3
Alaska                  5          3           -          2          2          -           4         14          -          -           -
Hawaii                  6          5           -         12         23          -          30         16          -          -           2

Guam                    2          2           U          1          5          U           1          1          U          -           -
P.R.                    5          9           -          -          3          -          16          5          -          -          12
V.I.                    U          U           U          U          U          U           U          U          U          U           U
Amer. Samoa             U          U           U          U          U          U           U          U          U          U           U
C.N.M.I.                U          U           U          U          U          U           U          U          U          U           U

------------------------------------------------------------------------------------------------------------------------------------------
N: Not notifiable    U: Unavailable     -: no reported cases

=======================================================================================================================================================


Return to top.

Table IV
Note: To print large tables and graphs users may have to change their printer settings to landscape and use a small font size.
TABLE IV. Deaths in 122 U.S. cities,* week ending
October 23,1999 (42nd Week)
===================================================================================================================================
                                                 All Causes, By Age (Years)
                          ------------------------------------------------------------------------        P&I**
Reporting Area            All Ages         >=65        45-64       25-44         1-24           <1        Total
---------------------------------------------------------------------------------------------------------------
NEW ENGLAND                    421          305           67          30           12            7           38
Boston, Mass.                  140           94           23          15            4            4           11
Bridgeport, Conn.               38           26            5           3            3            1            2
Cambridge, Mass.                14           12            2           -            -            -            2
Fall River, Mass.               23           17            3           1            1            1            1
Hartford, Conn.                  U            U            U           U            U            U            U
Lowell, Mass.                   18           13            3           2            -            -            5
Lynn, Mass.                     10            9            -           1            -            -            3
New Bedford, Mass.              38           28            7           3            -            -            -
New Haven, Conn.                33           22            5           2            3            1            2
Providence, R.I.                30           24            3           2            1            -            -
Somerville, Mass.                3            2            1           -            -            -            -
Springfield, Mass.               U            U            U           U            U            U            U
Waterbury, Conn.                19           17            2           -            -            -            2
Worcester, Mass.                55           41           13           1            -            -           10

MID. ATLANTIC                2,172        1,493          431         160           44           42           93
Albany, N.Y.                    44           32           10           1            -            1            -
Allentown, Pa.                   U            U            U           U            U            U            U
Buffalo, N.Y.                   80           51           16           8            3            2           11
Camden, N.J.                    34           20           10           3            -            1            2
Elizabeth, N.J.                  U            U            U           U            U            U            U
Erie, Pa.                       40           30           10           -            -            -            3
Jersey City, N.J.               37           24           11           1            1            -            -
New York City, N.Y.          1,194          835          231          86           23           18           33
Newark, N.J.                    47           26            5           7            4            4            1
Paterson, N.J.                  26           17            7           1            1            -            -
Philadelphia, Pa.              267          162           63          33            2            7            8
Pittsburgh, Pa.***              85           52           14          10            4            5            6
Reading, Pa.                    28           23            2           2            -            1            1
Rochester, N.Y.                127          100           19           4            3            1           10
Schenectady, N.Y.               21           18            3           -            -            -            3
Scranton, Pa.                   36           26            7           1            2            -            3
Syracuse, N.Y.                  69           52           13           2            -            2            9
Trenton, N.J.                   21           12            9           -            -            -            2
Utica, N.Y.                     16           13            1           1            1            -            1
Yonkers, N.Y.                    U            U            U           U            U            U            U

E.N. CENTRAL                 1,971        1,338          391         140           45           57          132
Akron, Ohio                     42           24            9           4            -            5            4
Canton, Ohio                    36           28            7           -            -            1            7
Chicago, Ill.                  381          235           74          38           16           18           31
Cincinnati, Ohio                 U            U            U           U            U            U            U
Cleveland, Ohio                146           89           34          17            1            5            3
Columbus, Ohio                 214          150           44           9            7            4           14
Dayton, Ohio                   112           83           20           6            1            2            7
Detroit, Mich.                 230          134           62          23            7            4           13
Evansville, Ind.                43           29           11           1            1            1            3
Fort Wayne, Ind.                58           44            8           2            1            3            7
Gary, Ind.                       U            U            U           U            U            U            U
Grand Rapids, Mich.             60           45           10           1            -            4            4
Indianapolis, Ind.             171          113           36          15            4            3           11
Lansing, Mich.                  44           32           10           1            1            -            8
Milwaukee, Wis.                142          105           26           7            1            3           10
Peoria, Ill.                    34           28            3           2            -            1            2
Rockford, Ill.                  50           40            5           4            -            1            2
South Bend, Ind.                43           33            7           1            -            2            -
Toledo, Ohio                   106           82           14           6            4            -            2
Youngstown, Ohio                59           44           11           3            1            -            4

W.N. CENTRAL                   703          492          134          43           16           18           51
Des Moines, Iowa                 U            U            U           U            U            U            U
Duluth, Minn.                   32           25            7           -            -            -            4
Kansas City, Kans.              39           25           10           3            1            -            2
Kansas City, Mo.                70           41           19           8            2            -            4
Lincoln, Nebr.                  42           32            6           3            1            -            5
Minneapolis, Minn.             157          113           30          11            2            1           16
Omaha, Nebr.                    78           55           15           3            1            4            4
St. Louis, Mo.                  84           53           14           6            7            4            -
St. Paul, Minn.                121           94           19           4            -            4           12
Wichita, Kans.                  80           54           14           5            2            5            4

S. ATLANTIC                  1,076          684          214         108           33           36           70
Atlanta, Ga.                     U            U            U           U            U            U            U
Baltimore, Md.                 263          151           53          41            9            9           28
Charlotte, N.C.                 93           62           16          11            2            2           13
Jacksonville, Fla.             133           78           30          14            4            7            3
Miami, Fla.                    101           66           21          10            4            -            5
Norfolk, Va.                    51           34           11           3            3            -            -
Richmond, Va.                   54           32            9           7            -            6            4
Savannah, Ga.                   60           38           16           1            3            2            6
St. Petersburg, Fla.            38           31            3           1            2            1            3
Tampa, Fla.                    187          124           41          12            4            6            7
Washington, D.C.                71           45           12           8            2            3            1
Wilmington, Del.                25           23            2           -            -            -            -

E.S. CENTRAL                   769          477          186          60           26           18           52
Birmingham, Ala.               182          118           36          14            6            6           13
Chattanooga, Tenn.              76           50           16           8            2            -            5
Knoxville, Tenn.                86           55           24           4            2            1            5
Lexington, Ky.                  44           27           11           3            2            1            3
Memphis, Tenn.                 106           50           39          10            5            2            5
Mobile, Ala.                    54           36           10           5            2            1            3
Montgomery, Ala.                70           48           13           4            5            -           10
Nashville, Tenn.               151           93           37          12            2            7            8

W.S. CENTRAL                 1,247          794          278         111           24           40           77
Austin, Tex.                    77           51           19           5            2            -            4
Baton Rouge, La.                73           55           12           5            1            -            -
Corpus Christi, Tex.            53           40           12           1            -            -            2
Dallas, Tex.                   165           98           35          18            5            9            1
El Paso, Tex.                   55           39           12           3            -            1            4
Ft. Worth, Tex.                123           78           34          10            -            1           13
Houston, Tex.                  316          181           71          44            8           12           27
Little Rock, Ark.              101           52           31          11            3            4            7
New Orleans, La.                86           56           16           6            2            6            7
San Antonio, Tex.                U            U            U           U            U            U            U
Shreveport, La.                 47           31           10           3            2            1            4
Tulsa, Okla.                   151          113           26           5            1            6            8

MOUNTAIN                       997          688          178          77           33           21           87
Albuquerque, N.M.               91           60           20           7            3            1           16
Boise, Idaho                    45           35            6           2            1            1            5
Colo. Springs, Colo.            59           44            8           5            1            1            2
Denver, Colo.                  101           64           15          11            3            8            7
Las Vegas, Nev.                216          154           42          14            3            3           13
Ogden, Utah                     35           26            6           3            -            -            7
Phoenix, Ariz.                 162          103           32          16            8            3           11
Pueblo, Colo.                   26           22            2           2            -            -            7
Salt Lake City, Utah           117           69           24          12           10            2            9
Tucson, Ariz.                  145          111           23           5            4            2           10

PACIFIC                      1,185          835          222          81           27           20          107
Berkeley, Calif.                27           15            6           3            1            2            -
Fresno, Calif.                  93           66           17           7            2            1           11
Glendale, Calif.                15           11            2           2            -            -            2
Honolulu, Hawaii                69           48           14           7            -            -            5
Long Beach, Calif.               U            U            U           U            U            U            U
Los Angeles, Calif.            316          213           64          23           10            6           17
Pasadena, Calif.                15           10            3           -            -            2            -
Portland, Oreg.                  U            U            U           U            U            U            U
Sacramento, Calif.               U            U            U           U            U            U            U
San Diego, Calif.              150          109           25          10            3            3           17
San Francisco, Calif.            U            U            U           U            U            U            U
San Jose, Calif.               195          151           30           8            2            4           21
Santa Cruz, Calif.              32           22            5           4            1            -            4
Seattle, Wash.                 115           81           22           8            4            -            9
Spokane, Wash.                  67           47           11           5            3            1           10
Tacoma, Wash.                   91           62           23           4            1            1           11

TOTAL                   10,541****        7,106        2,101         810          260          259          707

---------------------------------------------------------------------------------------------------------------
U: Unavailable    -: no reported cases

   * Mortality data in this table are voluntarily reported from 122 cities in the United States, most of which have populations
     of 100,000 or more. A death is reported by the place of its occurrence and by the week that the death certificate was
     filed. Fetal deaths are not included.
  ** Pneumonia and influenza.
 *** Because of changes in reporting methods in this Pennsylvania city, these numbers are partial counts for the current
     week. Complete counts will be available in 4 to 6 weeks.
**** Total includes unknown ages.
===================================================================================================================================


Return to top.

Disclaimer   All MMWR HTML versions of articles are electronic conversions from ASCII text into HTML. This conversion may have resulted in character translation or format errors in the HTML version. Users should not rely on this HTML document, but are referred to the electronic PDF version and/or the original MMWR paper copy for the official text, figures, and tables. An original paper copy of this issue can be obtained from the Superintendent of Documents, U.S. Government Printing Office (GPO), Washington, DC 20402-9371; telephone: (202) 512-1800. Contact GPO for current prices.

**Questions or messages regarding errors in formatting should be addressed to mmwrq@cdc.gov.

Page converted: 10/28/99

HOME  |  ABOUT MMWR  |  MMWR SEARCH  |  DOWNLOADS  |  RSSCONTACT
POLICY  |  DISCLAIMER  |  ACCESSIBILITY

Safer, Healthier People

Morbidity and Mortality Weekly Report
Centers for Disease Control and Prevention
1600 Clifton Rd, MailStop E-90, Atlanta, GA 30333, U.S.A

USA.GovDHHS

Department of Health
and Human Services

This page last reviewed 5/2/01