|
|
|
|
|
|
|
| ||||||||||
|
|
|
|
|
|
|
||||
| ||||||||||
|
|
|
|
|
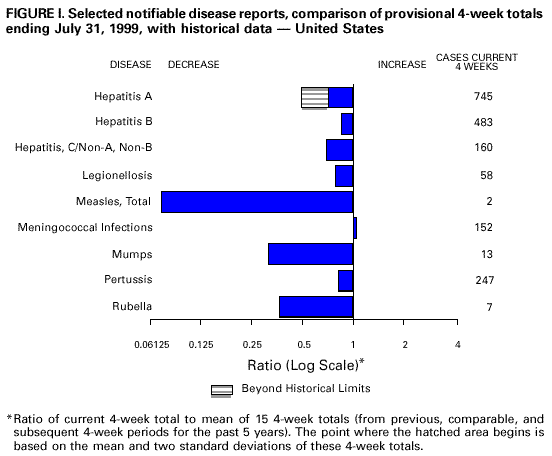
Persons using assistive technology might not be able to fully access information in this file. For assistance, please send e-mail to: mmwrq@cdc.gov. Type 508 Accommodation and the title of the report in the subject line of e-mail. Notifiable Diseases/Deaths in Selected Cities Weekly InformationFigure I Selected notifiable disease reports, comparison of provisional 4-week totals ending July 31, 1999, with historical data -- United States Table I Summary -- provisional cases of selected notifiable diseases, United States, cumulative, week ending July 31, 1999 (30th Week) Table II Provisional cases of selected notifiable diseases, United States, weeks ending July 31, 1999 and August 1, 1998 (30th Week) Table III Provisional cases of selected notifiable diseases preventable by vaccination, United States, weeks ending July 31, 1999 and August 1, 1998 (30th Week) Table IV Deaths in 122 U.S. cities, week ending July 31, 1999 (30th Week)
TABLE I. Summary -- provisional cases of selected notifiable diseases, United
States, cumulative, week ending July 31, 1999 (30th Week)
==================================================================================
                                             Cum. 1999
------------------------------------------------------
Anthrax                                              -
Brucellosis*                                        21
Cholera                                              4
Congenital rubella syndrome                          3
Cyclosporiasis*                                     14
Diphtheria                                           1
Encephalitis:  California*                           4
               eastern equine*                       2
               St. Louis*                            -
               western equine*                       -
Ehrlichiosis   human granulocytic (HGE)*            72
               human monocytic (HME)*               17
Hansen Disease*                                     50
Hantavirus pulmonary syndrome*+                      7
Hemolytic uremic syndrome, post-diarrheal*          38
HIV infection, pediatric*&                          86
Plague                                               2
Poliomyelitis, paralytic                             -
Psittacosis*                                        15
Rabies, human                                        -
Rocky Mountain spotted fever (RMSF)                254
Streptococcal disease, invasive Group A          1,334
Streptococcal toxic-shock syndrome*                 27
Syphilis, congenital@                              109
Tetanus                                             14
Toxic-shock syndrome                                71
Trichinosis                                          5
Typhoid fever                                      167
Yellow fever                                         -
------------------------------------------------------
-: no reported cases
 * Not notifiable in all states
 + Updated weekly from reports to the Division of Viral and Rickettsial
   Diseases, National Center for Infectious Diseases (NCID).
 & Updated monthly from reports to the Division of HIV/AIDS Prevention --
   Surveillance and Epidemiology, National Center for HIV, STD, and TB
   Prevention (NCHSTP), last update July 25, 1999.
 @ Updated from reports to the Division of STD Prevention, NCHSTP.

==================================================================================
TABLE II. (page 1) Provisional cases of selected notifiable diseases, United States, weeks ending
July 31, 1999, and August 1, 1998 (30th Week)
Escherichia
coli O157:H7*
-----------------------------------------
AIDS Chlamydia Cryptosporidiosis NETSS PHLIS
----------------- -------------------- ------------------- ------------------- ----------------
Cum. Cum. Cum. Cum. Cum. Cum. Cum. Cum. Cum. Cum.
Reporting Area 1999** 1998 1999 1998 1999 1999 1999 1998 1999 1998
------------------------------------------------------------------------------------------------------------------------------
UNITED STATES 26,427 27,228 329,744 327,356 793 1,189 1,132 1,267 696 1,091
NEW ENGLAND 1,298 1,007 10,882 11,755 45 90 140 162 117 150
Maine 43 21 193 573 12 19 15 21 - -
N.H. 31 23 528 555 7 11 18 22 19 30
Vt. 6 14 273 234 9 14 16 8 7 6
Mass. 842 506 5,276 4,809 17 41 75 85 52 84
R.I. 70 81 1,343 1,379 - 5 16 5 6 1
Conn. 306 362 3,269 4,205 - - U 21 33 29
MID. ATLANTIC 6,746 7,543 39,234 34,556 112 326 80 136 27 47
Upstate N.Y. 846 966 N N 71 193 72 93 - -
N.Y. City 3,592 4,053 21,145 15,196 22 121 2 8 4 9
N.J. 1,278 1,458 6,197 6,665 9 12 6 35 23 28
Pa. 1,030 1,066 11,892 12,695 10 - N N - 10
E.N. CENTRAL 1,719 2,071 48,027 56,524 79 143 211 227 147 188
Ohio 262 435 13,550 15,395 25 44 74 54 52 34
Ind. 224 353 6,367 6,124 14 30 30 58 20 29
Ill. 783 818 16,016 14,932 15 41 65 63 33 39
Mich. 360 350 12,094 12,282 25 18 42 52 17 34
Wis. 90 115 U 7,791 - 10 N N 25 52
W.N. CENTRAL 611 528 18,494 19,532 66 164 234 184 114 178
Minn. 105 102 3,264 3,999 14 55 81 70 69 85
Iowa 55 49 1,398 2,217 16 39 45 48 12 35
Mo. 295 243 7,870 7,002 12 13 23 18 25 29
N. Dak. 4 4 325 558 11 18 3 6 1 12
S. Dak. 13 11 832 918 3 17 17 8 4 12
Nebr. 45 48 1,919 1,624 9 18 54 19 - -
Kans. 94 71 2,886 3,214 1 4 11 15 3 5
S. ATLANTIC 7,281 6,810 74,882 58,492 189 126 147 95 72 91
Del. 95 90 1,564 1,438 - - 2 - - 1
Md. 793 824 6,397 3 10 12 10 16 - 9
D.C. 274 566 N N 7 4 - 1 - -
Va. 372 501 8,417 6,992 10 1 35 - 27 31
W. Va. 40 59 1,088 1,381 - 1 5 6 1 3
N.C. 482 459 13,363 11,752 5 - 27 18 25 32
S.C. 683 449 8,635 10,786 - - 14 5 10 3
Ga. 1,091 727 18,331 13,290 93 42 14 39 - -
Fla. 3,451 3,135 17,087 12,850 64 66 40 10 9 12
E.S. CENTRAL 1,145 1,079 23,055 22,962 12 17 65 76 34 43
Ky. 176 155 3,333 3,601 2 7 15 24 - -
Tenn. 442 374 8,057 7,503 4 6 31 32 18 26
Ala. 287 329 6,616 5,903 4 - 15 17 13 16
Miss. 240 221 5,049 5,955 2 4 4 3 3 1
W.S. CENTRAL 2,858 3,318 47,996 50,296 34 21 41 52 47 64
Ark. 107 123 3,394 2,079 - 4 6 6 5 8
La. 541 581 7,726 8,260 21 10 3 3 6 2
Okla. 74 184 4,738 5,729 3 3 15 10 9 5
Tex. 2,136 2,430 32,138 34,228 10 4 17 33 27 49
MOUNTAIN 1,021 965 19,002 18,429 49 77 94 167 56 146
Mont. 5 18 817 720 8 6 5 8 - 2
Idaho 16 19 786 1,125 3 14 6 15 6 11
Wyo. 4 1 431 374 - - 3 48 5 53
Colo. 197 186 4,104 4,580 4 6 32 32 23 30
N. Mex. 65 153 2,644 2,083 20 32 6 14 1 11
Ariz. 518 376 7,469 6,288 9 12 18 20 11 15
Utah 84 70 1,126 1,323 - - 17 23 8 15
Nev. 132 142 1,625 1,936 5 7 7 7 2 9
PACIFIC 3,748 3,907 48,172 54,810 207 225 120 168 82 184
Wash. 218 266 6,728 6,435 - - 34 29 26 49
Oreg. 118 117 3,418 3,070 79 23 27 44 23 51
Calif. 3,348 3,411 35,409 42,848 128 199 59 93 28 77
Alaska 13 17 1,011 1,105 - - - 2 - -
Hawaii 51 96 1,606 1,352 - 3 - - 5 7
Guam 5 - 226 221 - - N N - -
P.R. 821 1,136 U U - - 5 - U U
V.I. 19 18 N N - - N N U U
Amer. Samoa - - U U - - N N U U
C.N.M.I. - - N N - - N N U U
------------------------------------------------------------------------------------------------------------------------------
N: Not notifiable U: Unavailable -: no reported cases C.N.M.I.: Commonwealth of North Mariana Islands
* Individual cases may be reported through both the National Electronic Telecommunications System for Surveillance (NETSS)
and the Public Health Laboratory Information System (PHLIS).
** Updated monthly from reports to the Division of HIV/AIDS Prevention -- Surveillance and Epidemiology, National Center for HIV,
STD, and TB Prevention, last update July 25, 1999.
=======================================================================================================================================================
TABLE II. (page 2) Provisional cases of selected notifiable diseases, United States, weeks ending
July 31, 1999, and August 1, 1998 (30th Week)
Hepatitis Lyme
Gonorrhea C/NA,NB Legionellosis Disease
----------------- -------------------- ------------------- -------------------
Cum. Cum. Cum. Cum. Cum. Cum. Cum. Cum.
Reporting Area 1999 1998 1999 1998 1999 1998 1999 1998
--------------------------------------------------------------------------------------------------------
UNITED STATES 178,542 188,901 2,085 1,838 524 707 4,565 6,959
NEW ENGLAND 3,277 3,358 59 45 35 43 1,269 2,505
Maine 15 36 2 - 4 1 - 30
N.H. 53 52 - - 3 3 2 25
Vt. 33 20 4 2 8 3 4 6
Mass. 1,474 1,174 50 40 11 20 436 501
R.I. 342 204 3 3 3 8 216 162
Conn. 1,360 1,872 - - 6 8 611 1,781
MID. ATLANTIC 21,780 20,946 97 125 101 166 2,462 3,396
Upstate N.Y. 3,517 3,947 62 63 31 44 1,612 1,690
N.Y. City 9,103 6,885 - - 7 28 12 115
N.J. 3,437 4,279 - - 5 9 124 641
Pa. 5,723 5,835 35 62 58 85 714 950
E.N. CENTRAL 31,948 38,140 1,077 424 140 247 70 405
Ohio 8,321 9,689 1 7 47 89 46 21
Ind. 3,750 3,511 1 5 43 45 21 16
Ill. 11,322 12,261 21 28 10 28 2 11
Mich. 8,555 9,302 472 279 37 46 1 11
Wis. U 3,377 582 105 3 39 U 346
W.N. CENTRAL 7,876 9,551 78 24 29 37 83 77
Minn. 1,208 1,463 4 7 1 3 37 46
Iowa 367 700 - 7 13 5 15 17
Mo. 4,093 5,187 66 7 10 9 14 7
N. Dak. 31 49 - - - - 1 -
S. Dak. 83 144 - - 2 2 - -
Nebr. 879 632 3 2 3 15 6 3
Kans. 1,215 1,376 5 1 - 3 10 4
S. ATLANTIC 54,524 46,567 132 63 71 79 481 440
Del. 967 782 - - 6 8 13 36
Md. 5,625 11 30 8 12 24 339 319
D.C. 1,456 2,606 - - 1 5 3 4
Va. 5,682 4,008 10 7 16 8 48 31
W. Va. 307 472 13 4 N N 12 7
N.C. 11,505 10,086 27 14 12 6 42 25
S.C. 4,645 6,991 13 3 7 6 4 3
Ga. 12,143 11,295 1 9 - 3 - 2
Fla. 12,194 10,316 38 18 17 18 20 13
E.S. CENTRAL 18,550 21,694 187 102 62 40 70 45
Ky. 1,494 2,053 9 16 45 17 19 11
Tenn. 6,401 6,396 79 84 14 11 28 23
Ala. 5,797 7,444 1 2 3 5 12 11
Miss. 4,858 5,801 98 - - 7 11 -
W.S. CENTRAL 26,402 30,484 142 305 3 13 17 13
Ark. 1,706 2,323 8 12 - 1 2 6
La. 6,054 6,840 100 19 1 2 - 1
Okla. 2,336 3,120 12 7 2 8 4 2
Tex. 16,306 18,201 22 267 - 2 11 4
MOUNTAIN 5,283 5,047 89 268 31 40 7 6
Mont. 22 26 4 5 - 2 - -
Idaho 41 104 4 85 - - 1 1
Wyo. 13 17 30 62 - 1 1 1
Colo. 1,260 1,174 15 15 9 7 - -
N. Mex. 536 500 5 61 1 2 1 2
Ariz. 2,651 2,283 21 4 4 9 - -
Utah 104 139 5 19 11 16 2 -
Nev. 656 804 5 17 6 3 2 2
PACIFIC 8,902 13,114 224 482 52 42 106 72
Wash. 1,176 1,097 10 11 9 8 3 4
Oreg. 466 436 14 10 N N 6 11
Calif. 6,874 11,120 200 406 42 33 97 56
Alaska 169 184 - 1 1 - - 1
Hawaii 217 277 - 54 - 1 - -
Guam 32 27 - - - 2 - -
P.R. 170 226 - - - - - -
V.I. U U U U U U U U
Amer. Samoa U U U U U U U U
C.N.M.I. - 24 - - - - - -
--------------------------------------------------------------------------------------------------------
N: Not notifiable U: Unavailable -: no reported cases
=======================================================================================================================================================
TABLE II. (page 3) Provisional cases of selected notifiable diseases, United States, weeks ending
July 31, 1999, and August 1, 1998 (30th Week)
Salmonellosis*
------------------------------------------
Malaria Rabies, Animal NETSS PHLIS
----------------- -------------------- ------------------- -------------------
Cum. Cum. Cum. Cum. Cum. Cum. Cum. Cum.
Reporting Area 1999 1998 1999 1998 1999 1998 1999 1998
--------------------------------------------------------------------------------------------------------
UNITED STATES 651 732 3,164 4,302 16,821 19,798 13,320 17,526
NEW ENGLAND 25 42 469 791 863 1,276 945 1,189
Maine 2 3 83 136 76 97 53 39
N.H. 2 3 31 44 75 97 80 128
Vt. 2 - 63 35 43 69 37 50
Mass. 8 16 101 255 613 708 498 706
R.I. 3 2 59 44 56 83 48 31
Conn. 8 18 132 277 U 222 229 235
MID. ATLANTIC 139 204 613 920 1,891 3,427 1,511 3,328
Upstate N.Y. 42 47 427 638 641 792 580 804
N.Y. City 47 114 U U 391 1,116 489 965
N.J. 29 24 113 115 332 695 442 647
Pa. 21 19 73 167 527 824 - 912
E.N. CENTRAL 65 75 56 76 2,272 3,424 1,756 2,537
Ohio 14 4 20 42 617 817 371 704
Ind. 10 7 - 5 243 393 201 333
Ill. 19 32 2 8 842 1,042 399 648
Mich. 20 27 31 19 532 676 534 572
Wis. 2 5 3 2 38 496 251 280
W.N. CENTRAL 33 51 350 469 1,181 1,235 1,029 1,294
Minn. 6 26 64 78 303 297 347 346
Iowa 12 4 76 101 145 211 70 176
Mo. 11 12 9 23 381 351 469 477
N. Dak. - 2 88 89 20 36 4 49
S. Dak. - - 44 109 54 47 26 63
Nebr. - 1 2 3 113 102 - 23
Kans. 4 6 67 66 165 191 113 160
S. ATLANTIC 201 151 1,204 1,423 3,837 3,433 2,725 2,819
Del. 1 1 29 26 51 41 84 70
Md. 61 50 238 292 429 470 400 458
D.C. 11 12 - - 51 45 - -
Va. 44 26 304 364 662 525 507 477
W. Va. 1 1 69 51 83 82 81 89
N.C. 12 12 240 364 536 488 589 625
S.C. 4 4 97 92 246 220 186 221
Ga. 18 17 122 121 576 533 651 620
Fla. 49 28 105 113 1,203 1,029 227 259
E.S. CENTRAL 13 17 167 172 953 1,008 500 780
Ky. 4 2 24 22 188 213 - 96
Tenn. 5 9 60 93 254 296 250 387
Ala. 3 4 83 55 297 267 217 234
Miss. 1 2 - 2 214 232 33 63
W.S. CENTRAL 9 13 72 109 1,178 1,732 1,319 1,409
Ark. - 1 14 19 228 198 76 153
La. 6 5 - - 159 237 220 369
Okla. 2 1 58 90 196 206 130 64
Tex. 1 6 - - 595 1,091 893 823
MOUNTAIN 24 35 114 112 1,633 1,242 1,077 1,186
Mont. 4 - 41 32 36 49 1 30
Idaho 1 4 - - 50 58 45 55
Wyo. 1 - 31 44 23 37 22 33
Colo. 8 9 1 4 441 312 444 297
N. Mex. 2 11 4 3 207 137 110 131
Ariz. 5 5 32 23 508 356 402 407
Utah 2 1 4 6 262 180 - 119
Nev. 1 5 1 - 106 113 53 114
PACIFIC 142 144 119 230 3,013 3,021 2,458 2,984
Wash. 11 14 - - 354 241 279 361
Oreg. 14 12 1 1 262 162 327 198
Calif. 110 115 111 208 2,145 2,472 1,665 2,273
Alaska - 1 7 21 24 25 6 17
Hawaii 7 2 - - 228 121 181 135
Guam - 1 - - 20 14 - -
P.R. - - 43 31 223 372 - -
V.I. U U U U - - - -
Amer. Samoa U U U U - - - -
C.N.M.I. - - - - - 17 - -
--------------------------------------------------------------------------------------------------------
N: Not notifiable U: Unavailable -: no reported cases
* Individual cases may be reported through both the National Electronic Telecommunications System for Surveillance (NETSS)
and the Public Health Laboratory Information System (PHLIS).
=======================================================================================================================================================
TABLE II. (page 4) Provisional cases of selected notifiable diseases, United States, weeks ending
July 31, 1999, and August 1, 1998 (30th Week)
Shigellosis*
--------------------------------------- Syphilis
NETSS PHLIS (Primary & Secondary) Tuberculosis
---------------- ---------------- --------------------- ------------------
Cum. Cum. Cum. Cum. Cum. Cum. Cum. Cum.
Reporting Area 1999 1998 1999 1998 1999 1998 1999** 1998**
----------------------------------------------------------------------------------------------------------
UNITED STATES 6,966 10,442 3,073 5,747 3,535 4,013 7,614 9,155
NEW ENGLAND 167 249 145 217 32 40 229 248
Maine 4 8 - - - 1 12 6
N.H. 7 10 6 12 - 1 4 6
Vt. 4 4 3 - 3 4 - 2
Mass. 138 161 93 145 20 23 135 131
R.I. 14 20 9 12 1 1 25 34
Conn. U 46 34 48 8 10 53 69
MID. ATLANTIC 418 1,458 213 1,218 147 168 1,403 1,652
Upstate N.Y. 143 287 34 97 19 23 159 205
N.Y. City 100 464 81 487 64 32 783 802
N.J. 103 444 98 437 27 60 301 351
Pa. 72 263 - 197 37 53 160 294
E.N. CENTRAL 1,117 1,534 584 780 657 586 662 973
Ohio 282 315 54 73 58 85 143 151
Ind. 103 102 27 29 197 109 U 97
Ill. 477 822 354 648 289 244 316 459
Mich. 207 148 103 4 113 104 164 200
Wis. 48 147 46 26 U 44 39 66
W.N. CENTRAL 614 527 406 230 78 88 263 251
Minn. 115 92 135 98 5 6 95 81
Iowa 13 40 10 32 7 - 29 20
Mo. 413 65 237 51 54 69 97 93
N. Dak. 2 4 - 3 - - 2 3
S. Dak. 9 27 4 19 - 1 9 14
Nebr. 37 279 - 15 5 4 12 8
Kans. 25 20 20 12 7 8 19 32
S. ATLANTIC 1,335 2,200 292 721 1,151 1,505 1,685 1,547
Del. 7 13 4 9 6 16 12 20
Md. 77 114 22 37 234 421 155 166
D.C. 34 12 - - 34 45 29 66
Va. 58 86 28 47 96 97 121 174
W. Va. 6 11 3 7 2 2 26 25
N.C. 125 180 57 89 287 436 230 237
S.C. 78 91 37 34 125 179 189 187
Ga. 123 572 37 158 194 164 380 260
Fla. 827 1,121 104 340 173 145 543 412
E.S. CENTRAL 733 495 360 308 636 707 307 677
Ky. 142 78 - 36 46 67 82 103
Tenn. 469 88 319 122 368 333 U 228
Ala. 67 293 37 148 136 158 169 214
Miss. 55 36 4 2 86 149 56 132
W.S. CENTRAL 985 2,085 741 636 527 536 835 1,314
Ark. 53 116 21 28 40 74 91 71
La. 76 146 53 178 121 201 U 75
Okla. 321 150 102 34 122 22 80 100
Tex. 535 1,673 565 396 244 239 664 1,068
MOUNTAIN 435 640 219 383 148 147 235 312
Mont. 6 5 - 3 - - 5 12
Idaho 10 12 5 8 1 1 14 7
Wyo. 2 1 1 - - 1 1 2
Colo. 67 86 56 65 1 8 U 35
N. Mex. 52 159 17 74 10 19 33 36
Ariz. 237 336 134 210 128 103 136 123
Utah 31 21 - 16 2 3 27 36
Nev. 30 20 6 7 6 12 19 61
PACIFIC 1,162 1,254 113 1,254 159 236 1,995 2,181
Wash. 57 69 51 70 39 23 91 144
Oreg. 39 74 40 71 3 2 64 70
Calif. 1,042 1,084 - 1,084 114 210 1,711 1,834
Alaska - 4 - 2 1 - 35 32
Hawaii 24 23 22 27 2 1 94 101
Guam 7 24 - - 1 1 - 50
P.R. 35 33 - - 100 119 41 88
V.I. - - - - U U U U
Amer. Samoa - - - - U U U U
C.N.M.I. - 13 - - - 142 - 67
----------------------------------------------------------------------------------------------------------
N: Not notifiable U: Unavailable -: no reported cases
* Individual cases may be reported through both the National Electronic Telecommunications System for Surveillance (NETSS)
and the Public Health Laboratory Information System (PHLIS).
** Cumulative reports of provisional tuberculosis cases for 1998 and 1999 are unavailable ('U') for some
areas using the Tuberculosis Information Management System (TIMS).
=======================================================================================================================================================
TABLE III. (page 1) Provisional cases of selected notifiable diseases preventable by vaccination, United
States, weeks ending July 31, 1999, and August 1, 1998 (30th Week)
Hepatitis (Viral), by type Measles (Rubeola)
H. influenzae, --------------------------------------- ------------------------------------------------------------
invasive A B Indigenous Imported* Total
---------------- ----------------- ----------------- --------------- --------------- ---------------
Cum. Cum. Cum. Cum. Cum. Cum. Cum. Cum. Cum. Cum.
Reporting Area 1999** 1998 1999 1998 1999 1998 1999 1999 1999 1999 1999 1998
-----------------------------------------------------------------------------------------------------------------------------------------------------
UNITED STATES 723 693 8,740 13,012 3,692 5,526 - 32 - 16 48 47
NEW ENGLAND 54 44 119 169 62 114 - 5 - 4 9 3
Maine 5 2 5 13 1 2 - - - - - -
N.H. 12 8 8 8 9 10 - - - 1 1 -
Vt. 4 2 3 13 1 4 - - - - - 1
Mass. 20 30 38 60 28 44 - 4 - 2 6 2
R.I. 1 2 11 10 23 35 - - - - - -
Conn. 12 - 54 65 - 19 - 1 - 1 2 -
MID. ATLANTIC 107 102 560 993 411 751 - - - 2 2 13
Upstate N.Y. 57 31 154 193 119 141 - - - 2 2 2
N.Y. City 18 32 100 344 90 256 - - - - - -
N.J. 31 32 57 202 40 134 - - - - - 8
Pa. 1 7 249 254 162 220 - - - - - 3
E.N. CENTRAL 105 117 1,705 1,884 358 836 - 1 - 1 2 15
Ohio 40 37 419 202 53 46 - - - - - 1
Ind. 19 27 102 96 28 66 - 1 - - 1 3
Ill. 38 44 290 455 - 148 - - - - - -
Mich. 8 4 868 995 276 250 - - - 1 1 10
Wis. - 5 26 136 1 326 - - - - - 1
W.N. CENTRAL 60 62 455 986 275 244 - - - - - -
Minn. 19 48 45 79 30 23 - - - - - -
Iowa 14 1 88 362 106 42 - - - - - -
Mo. 20 8 242 438 106 147 - - - - - -
N. Dak. - - 1 3 - 4 - - - - - -
S. Dak. 1 - 8 17 1 1 - - - - - -
Nebr. 3 - 38 18 11 11 - - - - - -
Kans. 3 5 33 69 21 16 - - - - - -
S. ATLANTIC 168 128 1,154 1,020 680 540 - 1 - 3 4 7
Del. - - 2 3 - - - - - - - 1
Md. 46 42 220 245 103 86 - - - - - 1
D.C. 4 - 37 31 14 7 - - - - - -
Va. 12 13 97 137 59 56 - 1 - 2 3 2
W. Va. 5 5 24 1 15 4 - - - - - -
N.C. 24 19 82 60 137 118 - - - - - -
S.C. 3 3 24 18 39 22 - - - - - -
Ga. 45 26 294 297 83 110 - - - - - 2
Fla. 29 20 374 228 230 137 - - - 1 1 1
E.S. CENTRAL 52 42 255 253 282 237 - - - - - 2
Ky. 6 7 39 19 26 28 U - U - - -
Tenn. 30 23 130 143 147 166 - - - - - 1
Ala. 14 10 39 48 51 43 - - - - - 1
Miss. 2 2 47 43 58 - - - - - - -
W.S. CENTRAL 38 35 1,522 2,307 362 1,233 - 3 - 3 6 -
Ark. 2 - 32 56 31 58 - - - - - -
La. 7 16 59 44 72 58 - - - - - -
Okla. 26 17 301 334 81 52 - - - - - -
Tex. 3 2 1,130 1,873 178 1,065 - 3 - 3 6 -
MOUNTAIN 67 84 830 2,016 384 505 - 2 - - 2 -
Mont. 1 - 14 66 16 3 - - - - - -
Idaho 1 - 27 159 16 19 - - - - - -
Wyo. 1 1 4 25 9 2 - - - - - -
Colo. 10 17 145 154 54 62 - - - - - -
N. Mex. 17 4 31 96 132 201 - - - - - -
Ariz. 30 42 494 1,252 100 121 - 1 - - 1 -
Utah 5 3 32 126 22 43 - 1 - - 1 -
Nev. 2 17 83 138 35 54 - - - - - -
PACIFIC 72 79 2,140 3,384 878 1,066 - 20 - 3 23 7
Wash. 2 6 192 645 39 58 - - - - - 1
Oreg. 28 33 149 260 52 109 - 8 - - 8 -
Calif. 33 32 1,786 2,431 767 884 - 11 - 3 14 6
Alaska 5 1 4 14 13 7 - - - - - -
Hawaii 4 7 9 34 7 8 - 1 - - 1 -
Guam - - 2 - 2 2 U 1 U - 1 -
P.R. 1 2 107 35 96 154 - - - - - -
V.I. U U U U U U U U U U U U
Amer. Samoa U U U U U U U U U U U U
C.N.M.I. - - - 1 - 43 U - U - - -
-----------------------------------------------------------------------------------------------------------------------------------------------------
N: Not notifiable U: Unavailable -: no reported cases
* For imported measles, cases include only those resulting from importation from other countries.
** Of 146 cases among children aged <5 years, serotype was reported for 69 and of those, 16 were type b.
=======================================================================================================================================================
TABLE III. (page 2) Provisional cases of selected notifiable diseases preventable by vaccination, United
States, weeks ending July 31, 1999, and August 1, 1998 (30th Week)
Meningococcal
Disease Mumps Pertussis Rubella
----------------- -------------------------- --------------------------- ---------------------------
Cum. Cum. Cum. Cum. Cum. Cum. Cum. Cum.
Reporting Area 1999 1998 1999 1999 1998 1999 1999 1998 1999 1999 1998
------------------------------------------------------------------------------------------------------------------------------------------
UNITED STATES 1,520 1,718 3 205 437 72 2,938 3,055 2 156 314
NEW ENGLAND 81 76 - 4 3 6 313 565 - 7 38
Maine 5 5 - - - - - 5 - - -
N.H. 12 9 - 1 - 1 54 43 - - -
Vt. 4 1 - 1 - - 9 50 - - -
Mass. 47 33 - 2 2 3 222 436 - 7 8
R.I. 3 3 - - - - 17 5 - - 1
Conn. 10 25 - - 1 2 11 26 - - 29
MID. ATLANTIC 137 179 - 25 169 13 606 326 - 21 142
Upstate N.Y. 37 45 - 6 2 13 520 165 - 17 113
N.Y. City 31 22 - 3 153 - 10 17 - - 15
N.J. 36 42 - - 6 - 12 9 - 1 13
Pa. 33 70 - 16 8 - 64 135 - 3 1
E.N. CENTRAL 236 271 - 24 54 15 247 337 - 2 -
Ohio 105 95 - 8 20 7 129 85 - - -
Ind. 37 48 - 3 5 6 20 68 - 1 -
Ill. 61 74 - 6 9 2 44 35 - 1 -
Mich. 32 32 - 7 19 - 27 40 - - -
Wis. 1 22 - - 1 - 27 109 - - -
W.N. CENTRAL 165 147 1 10 21 8 121 226 - 78 31
Minn. 34 25 - 1 10 3 38 132 - - -
Iowa 31 22 - 4 7 - 27 47 - 28 -
Mo. 61 57 1 2 3 5 31 16 - 2 2
N. Dak. 3 2 - - 1 - - 3 - - -
S. Dak. 9 6 - - - - 5 6 - - -
Nebr. 9 10 - - - - 1 8 - 48 -
Kans. 18 25 - 3 - - 19 14 - - 29
S. ATLANTIC 263 286 - 36 27 16 195 161 1 22 9
Del. 3 1 - - - - - 2 - - -
Md. 39 24 - 3 - - 51 28 - 1 -
D.C. 1 - - 2 - - - 1 - - -
Va. 32 24 - 8 5 - 13 7 - - -
W. Va. 4 12 - - - - 1 1 - - -
N.C. 30 41 - 8 9 4 53 65 1 21 6
S.C. 31 42 - 3 4 - 8 20 - - -
Ga. 46 65 - 2 1 2 20 10 - - -
Fla. 77 77 - 10 8 10 49 27 - - 3
E.S. CENTRAL 119 121 1 8 10 1 48 70 - 1 -
Ky. 30 19 U - - U 5 28 U - -
Tenn. 43 45 - - 1 - 27 21 - - -
Ala. 27 35 - 7 5 1 12 18 - 1 -
Miss. 19 22 1 1 4 - 4 3 - - -
W.S. CENTRAL 133 193 - 25 37 8 89 203 1 6 80
Ark. 27 25 - - - - 10 25 - - -
La. 34 36 - 3 5 - 3 2 - - -
Okla. 24 28 - 1 - 5 12 20 - - -
Tex. 48 104 - 21 32 3 64 156 1 6 80
MOUNTAIN 98 96 - 12 27 4 292 578 - 15 5
Mont. 2 3 - - - - 2 3 - - -
Idaho 8 6 - 1 3 - 93 165 - - -
Wyo. 3 4 - - 1 - 2 7 - - -
Colo. 26 18 - 3 5 - 68 145 - - -
N. Mex. 13 17 N N N 3 53 70 - - 1
Ariz. 29 33 - - 5 - 29 130 - 13 1
Utah 11 10 - 5 3 1 42 34 - 1 2
Nev. 6 5 - 3 10 - 3 24 - 1 1
PACIFIC 288 349 1 61 89 1 1,027 589 - 4 9
Wash. 46 48 - 2 6 1 522 184 - - 5
Oreg. 48 56 N N N - 24 37 - - -
Calif. 185 240 1 51 64 - 468 353 - 4 2
Alaska 5 1 - 1 2 - 3 4 - - -
Hawaii 4 4 - 7 17 - 10 11 - - 2
Guam 1 2 U 1 2 U 1 - U - -
P.R. 5 6 - - 2 2 15 3 - - -
V.I. U U U U U U U U U U U
Amer. Samoa U U U U U U U U U U U
C.N.M.I. - - U - 2 U - 1 U - -
------------------------------------------------------------------------------------------------------------------------------------------
N: Not notifiable U: Unavailable -: no reported cases
=======================================================================================================================================================
TABLE IV. Deaths in 122 U.S. cities,* week ending
July 31, 1999 (30th Week)
===================================================================================================================================
All Causes, By Age (Years)
------------------------------------------------------------------------ P&I**
Reporting Area All Ages >=65 45-64 25-44 1-24 <1 Total
---------------------------------------------------------------------------------------------------------------
NEW ENGLAND 397 293 63 33 6 2 29
Boston, Mass. U U U U U U U
Bridgeport, Conn. 32 23 5 4 - - 1
Cambridge, Mass. 6 6 - - - - -
Fall River, Mass. 16 12 2 1 1 - -
Hartford, Conn. 47 28 8 8 3 - 5
Lowell, Mass. 23 13 9 1 - - 1
Lynn, Mass. 16 13 2 1 - - 1
New Bedford, Mass. 35 28 5 2 - - 2
New Haven, Conn. 41 34 4 2 1 - 3
Providence, R.I. 56 43 8 5 - - 6
Somerville, Mass. 8 5 2 1 - - 3
Springfield, Mass. 37 28 5 2 1 1 1
Waterbury, Conn. 26 21 4 1 - - 1
Worcester, Mass. 54 39 9 5 - 1 5
MID. ATLANTIC 2,225 1,532 416 182 56 39 84
Albany, N.Y. 50 34 8 1 1 6 4
Allentown, Pa. U U U U U U U
Buffalo, N.Y. 82 52 12 10 7 1 3
Camden, N.J. 14 10 2 2 - - -
Elizabeth, N.J. 14 12 - 2 - - -
Erie, Pa. 48 33 10 - 5 - 3
Jersey City, N.J. 33 24 6 1 1 1 -
New York City, N.Y. 1,120 771 227 90 16 16 23
Newark, N.J. 58 28 13 11 3 3 1
Paterson, N.J. 14 13 1 - - - -
Philadelphia, Pa. 401 261 73 45 15 7 16
Pittsburgh, Pa.*** 77 49 17 4 2 5 3
Reading, Pa. 35 26 5 3 1 - 2
Rochester, N.Y. 125 99 19 6 1 - 12
Schenectady, N.Y. U U U U U U U
Scranton, Pa. 23 18 3 2 - - -
Syracuse, N.Y. 85 68 12 2 3 - 10
Trenton, N.J. 25 20 3 2 - - 6
Utica, N.Y. 21 14 5 1 1 - 1
Yonkers, N.Y. U U U U U U U
E.N. CENTRAL 1,912 1,210 404 164 63 67 104
Akron, Ohio 39 27 4 6 1 1 -
Canton, Ohio 36 30 5 1 - - 2
Chicago, Ill. 419 215 100 52 16 32 28
Cincinnati, Ohio 57 37 11 6 2 1 2
Cleveland, Ohio 139 91 30 7 4 7 2
Columbus, Ohio 222 153 49 11 3 6 13
Dayton, Ohio 133 94 23 11 5 - 11
Detroit, Mich. 214 116 59 23 11 5 6
Evansville, Ind. 45 21 15 8 1 - 2
Fort Wayne, Ind. 47 28 12 2 2 3 3
Gary, Ind. 18 11 2 2 1 2 -
Grand Rapids, Mich. 41 32 6 1 1 1 5
Indianapolis, Ind. 176 117 37 12 6 4 15
Lansing, Mich. U U U U U U U
Milwaukee, Wis. U U U U U U U
Peoria, Ill. 50 33 8 5 3 1 1
Rockford, Ill. 54 42 8 2 1 1 3
South Bend, Ind. 57 45 8 1 2 1 5
Toledo, Ohio 99 73 15 8 3 - 4
Youngstown, Ohio 66 45 12 6 1 2 2
W.N. CENTRAL 750 523 145 39 21 22 36
Des Moines, Iowa 60 41 14 5 - - 2
Duluth, Minn. 28 22 5 - 1 - 3
Kansas City, Kans. U U U U U U U
Kansas City, Mo. 115 71 22 11 6 5 6
Lincoln, Nebr. 37 32 3 2 - - 2
Minneapolis, Minn. 202 135 54 6 3 4 13
Omaha, Nebr. 92 61 17 4 5 5 3
St. Louis, Mo. 110 79 19 5 3 4 1
St. Paul, Minn. 106 82 11 6 3 4 6
Wichita, Kans. U U U U U U U
S. ATLANTIC 848 541 187 80 22 18 38
Atlanta, Ga. U U U U U U U
Baltimore, Md. 260 155 63 31 2 9 13
Charlotte, N.C. 86 56 19 5 6 - 11
Jacksonville, Fla. 149 97 36 11 2 3 5
Miami, Fla. U U U U U U U
Norfolk, Va. 58 35 13 6 3 1 -
Richmond, Va. 59 36 14 3 4 2 2
Savannah, Ga. 52 36 7 7 1 1 3
St. Petersburg, Fla. 76 61 9 4 2 - 4
Tampa, Fla. U U U U U U U
Washington, D.C. 97 55 25 13 2 2 -
Wilmington, Del. 11 10 1 - - - -
E.S. CENTRAL 603 400 123 36 23 16 32
Birmingham, Ala. 179 117 33 9 7 8 13
Chattanooga, Tenn. 79 60 11 6 1 1 3
Knoxville, Tenn. 88 69 11 2 4 2 -
Lexington, Ky. 71 45 17 3 3 3 7
Memphis, Tenn. U U U U U U U
Mobile, Ala. U U U U U U U
Montgomery, Ala. 39 21 11 4 1 2 6
Nashville, Tenn. 147 88 40 12 7 - 3
W.S. CENTRAL 1,190 779 262 83 31 35 60
Austin, Tex. 71 45 19 5 2 - 5
Baton Rouge, La. 15 6 7 2 - - -
Corpus Christi, Tex. 46 34 6 2 2 2 5
Dallas, Tex. 187 109 50 14 4 10 1
El Paso, Tex. 88 55 19 10 - 4 1
Ft. Worth, Tex. 126 92 24 6 3 1 10
Houston, Tex. 293 186 64 26 10 7 25
Little Rock, Ark. 69 43 16 1 3 6 -
New Orleans, La. U U U U U U U
San Antonio, Tex. 180 132 34 11 2 1 9
Shreveport, La. U U U U U U U
Tulsa, Okla. 115 77 23 6 5 4 4
MOUNTAIN 869 541 190 82 35 20 44
Albuquerque, N.M. 126 75 23 17 9 2 2
Boise, Idaho 37 26 7 1 1 2 1
Colo. Springs, Colo. 57 37 12 6 2 - 3
Denver, Colo. 99 36 31 14 9 9 3
Las Vegas, Nev. 176 109 48 13 5 1 7
Ogden, Utah 36 25 8 2 1 - 2
Phoenix, Ariz. 73 50 18 1 2 1 7
Pueblo, Colo. 23 18 3 2 - - 1
Salt Lake City, Utah 108 75 13 15 2 3 8
Tucson, Ariz. 134 90 27 11 4 2 10
PACIFIC 1,526 1,086 283 94 37 26 128
Berkeley, Calif. 20 13 3 2 1 1 1
Fresno, Calif. 97 71 16 7 3 - 10
Glendale, Calif. 28 21 5 2 - - 3
Honolulu, Hawaii 73 55 12 4 - 2 5
Long Beach, Calif. 71 47 18 5 - 1 10
Los Angeles, Calif. 375 274 65 19 10 7 29
Pasadena, Calif. 26 19 3 1 1 2 4
Portland, Oreg. 125 87 24 8 5 1 5
Sacramento, Calif. 128 95 23 5 3 2 16
San Diego, Calif. 162 110 36 10 2 4 16
San Francisco, Calif. U U U U U U U
San Jose, Calif. 155 104 31 10 5 5 19
Santa Cruz, Calif. 32 23 7 2 - - 2
Seattle, Wash. 118 84 23 7 3 1 2
Spokane, Wash. 50 39 7 2 2 - 2
Tacoma, Wash. 66 44 10 10 2 - 4
TOTAL 10,320**** 6,905 2,073 793 294 245 555
---------------------------------------------------------------------------------------------------------------
U: Unavailable -: no reported cases
* Mortality data in this table are voluntarily reported from 122 cities in the United States, most of which have populations
of 100,000 or more. A death is reported by the place of its occurrence and by the week that the death certificate was
filed. Fetal deaths are not included.
** Pneumonia and influenza.
*** Because of changes in reporting methods in this Pennsylvania city, these numbers are partial counts for the current
week. Complete counts will be available in 4 to 6 weeks.
**** Total includes unknown ages.
===================================================================================================================================
Disclaimer All MMWR HTML versions of articles are electronic conversions from ASCII text into HTML. This conversion may have resulted in character translation or format errors in the HTML version. Users should not rely on this HTML document, but are referred to the electronic PDF version and/or the original MMWR paper copy for the official text, figures, and tables. An original paper copy of this issue can be obtained from the Superintendent of Documents, U.S. Government Printing Office (GPO), Washington, DC 20402-9371; telephone: (202) 512-1800. Contact GPO for current prices. **Questions or messages regarding errors in formatting should be addressed to mmwrq@cdc.gov.Page converted: 08/05/99 |
|||||||||
This page last reviewed 5/2/01
|