Skip Navigation LinksSkip Navigation Links
Centers for Disease Control and Prevention
Safer Healthier People
Blue White
Blue White
bottom curve
CDC Home Search Health Topics A-Z spacer spacer
spacer
Blue curve MMWR spacer
spacer
spacer

Notifiable Diseases/Deaths in Selected Cities Weekly Information

Figure I   Selected notifiable disease reports, comparison of provisional 4-week totals ending July 3, 1999, with historical data -- United States

Table I   Summary -- provisional cases of selected notifiable diseases, United States, cumulative, week ending July 3, 1999 (26th Week)

Table II   Provisional cases of selected notifiable diseases, United States, weeks ending July 3, 1999 and July 4, 1998 (26th Week)

Table III   Provisional cases of selected notifiable diseases preventable by vaccination, United States, weeks ending July 3, 1999 and July 4, 1998 (26th Week)

Table IV   Deaths in 122 U.S. cities, week ending July 3, 1999 (26th Week)


Figure I

Figure I
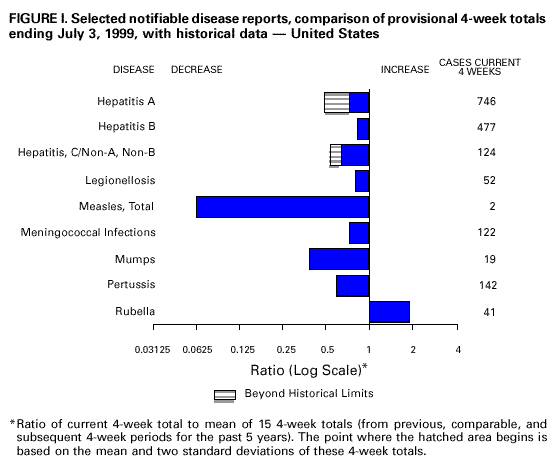
Return to top.

Table I
Note: To print large tables and graphs users may have to change their printer settings to landscape and use a small font size.
TABLE I. Summary -- provisional cases of selected notifiable diseases, United
States, cumulative, week ending July 3, 1999 (26th Week)
==================================================================================
                                             Cum. 1999
------------------------------------------------------
Anthrax                                              -
Brucellosis*                                        17
Cholera                                              2
Congenital rubella syndrome                          3
Cyclosporiasis*                                     11
Diphtheria                                           -
Encephalitis:  California*                           2
               eastern equine*                       2
               St. Louis*                            -
               western equine*                       1
Ehrlichiosis   human granulocytic (HGE)*            49
               human monocytic (HME)*                6
Hansen Disease*                                     40
Hantavirus pulmonary syndrome*+                      7
Hemolytic uremic syndrome, post-diarrheal*          24
HIV infection, pediatric*&                          81
Plague                                               2
Poliomyelitis, paralytic                             -
Psittacosis*                                        14
Rabies, human                                        -
Rocky Mountain spotted fever (RMSF)                148
Streptococcal disease, invasive Group A          1,152
Streptococcal toxic-shock syndrome*                 22
Syphilis, congenital@                               94
Tetanus                                             11
Toxic-shock syndrome                                63
Trichinosis                                          5
Typhoid fever                                      136
Yellow fever                                         -
------------------------------------------------------
-: no reported cases
 * Not notifiable in all states
 + Updated weekly from reports to the Division of Viral and Rickettsial
   Diseases, National Center for Infectious Diseases (NCID).
 & Updated monthly from reports to the Division of HIV/AIDS Prevention --
   Surveillance and Epidemiology, National Center for HIV, STD, and TB
   Prevention (NCHSTP), last update June 23, 1999.
 @ Updated from reports to the Division of STD Prevention, NCHSTP.

==================================================================================


Return to top.

Table II
Note: To print large tables and graphs users may have to change their printer settings to landscape and use a small font size.
TABLE II. (page 1) Provisional cases of selected notifiable diseases, United States, weeks ending
July 3, 1999, and July 4, 1998 (26th Week)

                                                                                                    Escherichia
                                                                                                   coli O157:H7*
                                                                                     -----------------------------------------
                          AIDS              Chlamydia          Cryptosporidiosis            NETSS                  PHLIS
                   -----------------   --------------------   -------------------    -------------------      ----------------
                     Cum.       Cum.        Cum.       Cum.       Cum.       Cum.        Cum.       Cum.       Cum.       Cum.
Reporting Area       1999**     1998        1999       1998       1999       1999        1999       1998       1999       1998
------------------------------------------------------------------------------------------------------------------------------
UNITED STATES      23,194     23,725     281,030    286,678        661        972         738        820        361        690

NEW ENGLAND         1,120        810       9,555     10,113         32         70         106        116         76        103
Maine                  29         18         193        461         10         18          10         10          -          -
N.H.                   26         15         458        477          5          3          15         18          8         19
Vt.                     6         10         235        194          6          9          12          4          2          4
Mass.                 716        372       4,521      4,118         11         36          42         60         39         60
R.I.                   61         69       1,181      1,229          -          4           6          3          6          1
Conn.                 282        326       2,967      3,634          -          -          21         21         21         19

MID. ATLANTIC       5,913      6,918      34,009     29,954         98        296          46         85         11         29
Upstate N.Y.          725        856           N          N         57        185          40         55          -          -
N.Y. City           3,003      3,888      17,606     13,211         22        100           -          7          3          6
N.J.                1,158      1,215       4,808      5,740          9         11           6         23          8         19
Pa.                 1,027        959      11,595     11,003         10          -           N          N          -          4

E.N. CENTRAL        1,502      1,760      40,428     48,935         57        105         122        166         60        136
Ohio                  241        339      11,228     13,281         18         39          51         36          8         22
Ind.                  191        323       5,280      5,319          9         20          17         51         13         25
Ill.                  682        693      13,376     12,834         11         31          28         47         12         31
Mich.                 308        305      10,544     10,844         19         15          26         32         14         26
Wis.                   80        100           U      6,657          -          -           N          N         13         32

W.N. CENTRAL          537        441      14,443     16,891         51        116         145         97         57         98
Minn.                  82         64       3,264      3,435         14         41          47         30         33         43
Iowa                   50         49       1,225      2,071          9         20          15         23          6         17
Mo.                   261        210       5,099      5,990         11         11          15         13         13         21
N. Dak.                 4          4         325        498          4         14           3          2          -          6
S. Dak.                11          9         803        798          3         14           5          6          4          8
Nebr.                  39         37       1,258      1,421          9         14          50         14          -          -
Kans.                  90         68       2,469      2,678          1          2          10          9          1          3

S. ATLANTIC         6,366      5,825      66,029     54,881        160         89          95         56         46         57
Del.                   80         75       1,392      1,241          -          -           2          -          -          1
Md.                   720        717       4,848      4,131          7          8           6         12          -          7
D.C.                  242        480         826          N          5          3           -          -          -          -
Va.                   340        424       7,414      5,454         10          1          29          -         17         24
W. Va.                 31         51       1,011      1,171          -          1           4          3          1          2
N.C.                  390        389      11,466     10,898          4          -          22         12         16         13
S.C.                  588        381       8,635      9,311          -          -          11          2          3          1
Ga.                   958        618      15,832     11,919         86         28           6         21          -          -
Fla.                3,017      2,690      14,605     10,604         48         48          15          6          9          9

E.S. CENTRAL        1,034        933      19,520     19,595          8         15          52         51         19         35
Ky.                   152        126       3,333      3,051          2          5          14         15          -          -
Tenn.                 405        330       6,850      6,412          4          6          23         22         12         23
Ala.                  257        274       5,211      5,015          1          -          12         11          6         11
Miss.                 220        203       4,126      5,117          1          4           3          3          1          1

W.S. CENTRAL        2,491      2,889      40,943     43,010         33         15          28         31         11         46
Ark.                   90        104       3,058      1,812          -          3           5          4          3          4
La.                   463        507       7,726      6,732         21          6           3          -          3          2
Okla.                  70        170       3,702      4,858          2          3           7          6          5          4
Tex.                1,868      2,108      26,457     29,608         10          3          13         21          -         36

MOUNTAIN              860        816      15,941     15,856         37         65          55         86         27         74
Mont.                   4         15         654        632          7          4           4          6          -          2
Idaho                  12         15         617        914          2         14           1         10          2          3
Wyo.                    3          1         333        329          -          -           3          2          4         16
Colo.                 172        146       3,726      3,978          4          3          22         22         12         19
N. Mex.                46        130       1,731      1,878         15         26           3         10          1          6
Ariz.                 427        327       6,474      5,409          7         10          11         15          4         11
Utah                   80         65         946      1,144          -          1           9         15          2         10
Nev.                  116        117       1,460      1,572          2          7           2          6          2          7

PACIFIC             3,371      3,333      40,162     47,443        185        201          89        132         54        112
Wash.                 188        230       5,960      5,581          -          -          30         27         26         36
Oreg.                  88         94       2,894      2,586         73         22          22         33         14         29
Calif.              3,036      2,930      29,385     37,174        112        176          37         70         13         43
Alaska                 13         12         925        950          -          -           -          2          -          -
Hawaii                 46         67         998      1,152          -          3           -          -          1          4

Guam                    5          -         149        182          -          -           N          N          -          -
P.R.                  734        995           U          U          -          -           6          -          U          U
V.I.                   15         17           N          N          -          -           N          N          U          U
Amer. Samoa             -          -           U          U          -          -           N          N          U          U
C.N.M.I.                -          -           N          N          -          -           N          N          U          U
------------------------------------------------------------------------------------------------------------------------------
N: Not notifiable    U: Unavailable    -: no reported cases    C.N.M.I.: Commonwealth of North Mariana Islands

 * Individual cases may be reported through both the National Electronic Telecommunications System for Surveillance (NETSS)
   and the Public Health Laboratory Information System (PHLIS).
** Updated monthly from reports to the Division of HIV/AIDS Prevention -- Surveillance and Epidemiology, National Center for HIV,
   STD, and TB Prevention, last update June 23, 1999.

=======================================================================================================================================================

TABLE II. (page 2) Provisional cases of selected notifiable diseases, United States, weeks ending
July 3, 1999, and July 4, 1998 (26th Week)

                                            Hepatitis                                       Lyme
                       Gonorrhea             C/NA,NB             Legionellosis             Disease
                   -----------------   --------------------   -------------------    -------------------
                     Cum.       Cum.        Cum.       Cum.       Cum.       Cum.        Cum.       Cum.
Reporting Area       1999       1998        1999       1998       1999       1998        1999       1998
--------------------------------------------------------------------------------------------------------
UNITED STATES     151,968    165,675       1,817      1,538        454        541       2,647      3,495

NEW ENGLAND         2,865      2,821          56         44         29         29         475      1,121
Maine                  15         31           1          -          4          1           -         18
N.H.                   38         46           -          -          3          3           -         16
Vt.                    28         13           3          2          4          1           -          4
Mass.               1,261        985          49         40          9         14         260        275
R.I.                  304        179           3          2          3          4          77         31
Conn.               1,219      1,567           -          -          6          6         138        777

MID. ATLANTIC      18,889     17,899          86        117         95        122       1,652      1,791
Upstate N.Y.        3,024      3,384          51         59         26         33         819        800
N.Y. City           7,494      5,925           -          -          7         26           6         69
N.J.                2,760      3,548           -          -          5          5         124        327
Pa.                 5,611      5,042          35         58         57         58         703        595

E.N. CENTRAL       26,515     32,818         985        283        125        184          49        198
Ohio                6,668      8,169           -          6         41         65          26         19
Ind.                3,049      3,066           1          4         39         31          20         11
Ill.                9,481     10,491          10         27         10         22           2          6
Mich.               7,317      8,269         392        246         32         33           1          8
Wis.                    U      2,823         582          -          3         33           U        154

W.N. CENTRAL        5,815      8,241          66         19         23         31          38         29
Minn.               1,208      1,225           2          6          1          3          13          9
Iowa                  306        666           -          5         11          5          10         10
Mo.                 2,625      4,509          56          6          8          9           -          6
N. Dak.                31         44           -          -          -          -           1          -
S. Dak.                80        127           -          -          1          1           -          -
Nebr.                 553        539           3          2          2         11           6          2
Kans.               1,012      1,131           5          -          -          2           8          2

S. ATLANTIC        48,013     44,210         120         54         54         64         290        266
Del.                  840        673           -          -          4          7           9         15
Md.                 4,186      4,711          29          5          7         15         199        199
D.C.                2,490      1,966           -          -          -          4           1          4
Va.                 4,944      3,079          10          5         13          7          22         21
W. Va.                276        391          13          4          N          N           7          5
N.C.                9,750      9,146          25         12          8          6          34         13
S.C.                4,645      6,043          12          2          7          5           4          2
Ga.                10,464      9,717           1          9          -          2           -          2
Fla.               10,418      8,484          30         17         15         17          14          5

E.S. CENTRAL       15,362     18,428         120         80         55         32          44         31
Ky.                 1,494      1,753           8         15         44         17          19         10
Tenn.               5,349      5,421          44         62          9          7          13         11
Ala.                4,637      6,346           1          3          2          3           6         10
Miss.               3,882      4,908          67          -          -          5           6          -

W.S. CENTRAL       22,652     25,788         128        278          2         10           7          8
Ark.                1,509      1,988           3         11          -          1           1          5
La.                 6,054      5,638         100         10          1          1           -          -
Okla.               1,878      2,635           6          2          1          6           4          -
Tex.               13,211     15,527          19        255          -          2           2          3

MOUNTAIN            4,414      4,214          75        252         27         32           6          3
Mont.                  21         23           4          5          -          1           -          -
Idaho                  32         83           4         85          -          -           1          1
Wyo.                   11         15          25         59          -          1           1          1
Colo.               1,061      1,029          15         13          5          6           -          -
N. Mex.               311        371           4         52          1          2           1          -
Ariz.               2,305      1,951          18          4          4          3           -          -
Utah                   89        112           2         18         11         16           1          -
Nev.                  584        630           3         16          6          3           2          1

PACIFIC             7,443     11,256         181        411         44         37          86         48
Wash.               1,034        953           8         10          9          5           2          2
Oreg.                 411        338           9         10          N          N           5          8
Calif.              5,718      9,571         164        336         34         31          79         37
Alaska                152        157           -          1          1          -           -          1
Hawaii                128        237           -         54          -          1           -          -

Guam                   22         24           -          -          -          2           -          -
P.R.                  145        210           -          -          -          -           -          -
V.I.                    U          U           U          U          U          U           U          U
Amer. Samoa             U          U           U          U          U          U           U          U
C.N.M.I.                -         19           -          -          -          -           -          -

--------------------------------------------------------------------------------------------------------
N: Not notifiable    U: Unavailable    -: no reported cases
=======================================================================================================================================================

TABLE II. (page 3) Provisional cases of selected notifiable diseases, United States, weeks ending
July 3, 1999, and July 4, 1998 (26th Week)

                                                                            Salmonellosis*
                                                              ------------------------------------------
                        Malaria           Rabies, Animal             NETSS                  PHLIS
                   -----------------   --------------------   -------------------    -------------------
                     Cum.       Cum.        Cum.       Cum.       Cum.       Cum.        Cum.       Cum.
Reporting Area       1999       1998        1999       1998       1999       1998        1999       1998
--------------------------------------------------------------------------------------------------------
UNITED STATES         535        595       2,645      3,743     13,207     15,304       9,355     14,287

NEW ENGLAND            21         22         407        688        809      1,010         703        949
Maine                   2          3          75        127         58         72          35         29
N.H.                    -          3          27         33         44         69          39        101
Vt.                     1          -          60         30         33         45          26         39
Mass.                   8         14          91        223        474        557         407        552
R.I.                    2          2          50         36         49         62          48         37
Conn.                   8          -         104        239        151        205         148        191

MID. ATLANTIC         123        172         481        782      1,700      2,604       1,103      2,547
Upstate N.Y.           36         35         307        541        480        585         454        555
N.Y. City              38        101           U          U        377        856         368        788
N.J.                   29         21         101        100        332        525         281        459
Pa.                    20         15          73        141        511        638           -        745

E.N. CENTRAL           55         58          39         56      1,609      2,688       1,199      1,895
Ohio                    9          3          11         38        396        609         117        522
Ind.                    8          2           -          4        185        295         127        284
Ill.                   18         26           -          6        558        819         399        428
Mich.                  18         24          25          6        432        528         380        415
Wis.                    2          3           3          2         38        437         176        246

W.N. CENTRAL           23         37         305        397        882        957         729      1,029
Minn.                   5         17          52         67        238        248         248        286
Iowa                    6          3          65         82         90        159          60        135
Mo.                    10         10           9         20        266        261         321        371
N. Dak.                 -          2          84         74         15         28           2         45
S. Dak.                 -          -          44         92         44         40          26         52
Nebr.                   -          1           2          3        105         79           -         20
Kans.                   2          4          49         59        124        142          72        120

S. ATLANTIC           152        128       1,043      1,268      2,925      2,641       2,007      2,150
Del.                    1          1          29         20         43         30          51         48
Md.                    48         44         216        266        336        363         296        396
D.C.                   10         10           -          -         39         44           -          -
Va.                    30         22         265        336        503        419         371        391
W. Va.                  1          -          62         42         43         67          37         71
N.C.                   10         12         205        325        450        385         414        444
S.C.                    1          4          78         77        172        167         134        147
Ga.                    12         15          99        103        453        412         543        439
Fla.                   39         20          89         99        886        754         161        214

E.S. CENTRAL           10         16         134        148        696        732         263        627
Ky.                     2          2          22         18        161        170           -         89
Tenn.                   5          8          48         84        191        218         139        334
Ala.                    2          4          64         44        220        189         107        166
Miss.                   1          2           -          2        124        155          17         38

W.S. CENTRAL            8         11          54        104        990      1,187         653      1,568
Ark.                    -          1           -         19        166        123          76         93
La.                     6          4           -          -        159        201          66        287
Okla.                   1          1          54         85        145        149          88         58
Tex.                    1          5           -          -        520        714         423      1,130

MOUNTAIN               23         32          95         97      1,307        940         802        879
Mont.                   3          -          35         29         28         41           1         22
Idaho                   1          3           -          -         40         52          35         41
Wyo.                    1          -          28         41         15         32          17         27
Colo.                   8          7           1          2        384        236         367        228
N. Mex.                 2         11           2          2        145         91          79         84
Ariz.                   5          5          29         21        414        264         250        269
Utah                    2          1           -          2        203        145           -        120
Nev.                    1          5           -          -         78         79          53         88

PACIFIC               120        119          87        203      2,289      2,545       1,896      2,643
Wash.                  10          9           -          -        221        192         279        320
Oreg.                  13         11           1          1        180        141         205        184
Calif.                 91         97          80        182      1,687      2,093       1,291      2,012
Alaska                  -          -           6         20         21         19           6         15
Hawaii                  6          2           -          -        180        100         115        112

Guam                    -          1           -          -         18         12           -          -
P.R.                    -          -          36         28        184        310           -          -
V.I.                    U          U           U          U          -          -           -          -
Amer. Samoa             U          U           U          U          -          -           -          -
C.N.M.I.                -          -           -          -          -         13           -          -

--------------------------------------------------------------------------------------------------------
N: Not notifiable    U: Unavailable    -: no reported cases

* Individual cases may be reported through both the National Electronic Telecommunications System for Surveillance (NETSS)
  and the Public Health Laboratory Information System (PHLIS).
=======================================================================================================================================================

TABLE II. (page 4) Provisional cases of selected notifiable diseases, United States, weeks ending
July 3, 1999, and July 4, 1998 (26th Week)

                                  Shigellosis*
                    ---------------------------------------          Syphilis
                         NETSS                  PHLIS          (Primary & Secondary)      Tuberculosis
                    ----------------       ----------------    ---------------------    ------------------
                     Cum.       Cum.        Cum.       Cum.       Cum.       Cum.        Cum.       Cum.
Reporting Area       1999       1998        1999       1998       1999       1998        1999**     1998**
----------------------------------------------------------------------------------------------------------
UNITED STATES       5,833      8,600       2,007      5,235      3,111      3,418       3,992      4,838

NEW ENGLAND           150        211         126        185         30         37         187        224
Maine                   3          7           -          -          -          1          10          5
N.H.                    7          7           6          9          -          1           4          6
Vt.                     4          4           3          -          2          3           -          1
Mass.                  95        132          82        124         19         23         106        117
R.I.                   14         15           9         12          1          -          19         30
Conn.                  27         46          26         40          8          9          48         65

MID. ATLANTIC         384      1,287         185      1,091        126        115         974      1,106
Upstate N.Y.          113        245          31         77         17         18         138        151
N.Y. City              98        419          81        453         57         25         609        655
N.J.                  103        392          73        382         16         54         227        300
Pa.                    70        231           -        179         36         18           U          U

E.N. CENTRAL          832      1,268         334        642        606        505         428        603
Ohio                  256        283          14         67         47         76           U          U
Ind.                   54         87          11         24        178         91           U          U
Ill.                  312        665         218        528        268        211         252        376
Mich.                 162        123          73          4        113         89         137        173
Wis.                   48        110          18         19          U         38          39         54

W.N. CENTRAL          514        450         311        196         52         77         241        195
Minn.                  84         79          83         84          5          5          95         66
Iowa                    7         33           9         27          5          -          26          2
Mo.                   361         57         201         39         34         59          84         82
N. Dak.                 2          4           -          3          -          -           2          3
S. Dak.                 8         22           4         18          -          1           3         14
Nebr.                  30        239           -         15          4          4          12          5
Kans.                  22         16          14         10          4          8          19         23

S. ATLANTIC         1,106      1,678         239        535      1,013      1,319         815        833
Del.                    7          9           2          2          4         15          12         17
Md.                    59         98          15         30        201        369           U          U
D.C.                   30         11           -          -         42         49          24         58
Va.                    40         69          10         28         89         87         104        144
W. Va.                  5          7           2          5          2          2          23         24
N.C.                  113        142          54         83        243        370         209        204
S.C.                   55         78          18         31        125        161         124        161
Ga.                   105        453          34        135        156        139         319        225
Fla.                  692        811         104        221        151        127           U          U

E.S. CENTRAL          626        426         217        252        573        591         284        405
Ky.                   113         77           -         38         46         59          82         95
Tenn.                 419         69         197         94        327        285           U          U
Ala.                   55        250          19        118        130        135         146        194
Miss.                  39         30           1          2         70        112          56        116

W.S. CENTRAL          877      1,695         339      1,883        460        456         752      1,041
Ark.                   47         80          21         16         38         60          80         53
La.                    76        130          29        159        121        155           U          U
Okla.                 267        119          77         30        103         25          63         66
Tex.                  487      1,366         212      1,678        198        216         609        922

MOUNTAIN              350        536         152        311        111        127          62        134
Mont.                   6          3           -          3          -          -           5         12
Idaho                   6         11           3          8          1          -           -          7
Wyo.                    2          1           1          -          -          1           1          2
Colo.                  52         66          37         49          1          8           U          U
N. Mex.                40        129          13         53          -         18          23         31
Ariz.                 197        291          92        178        102         87           U          U
Utah                   26         16           -         13          2          3          18         33
Nev.                   21         19           6          7          5         10          15         49

PACIFIC               994      1,049         104        140        140        191         249        297
Wash.                  52         57          51         58         39         12          82        124
Oreg.                  35         64          34         58          2          1          57         58
Calif.                885        904           -          -         96        178           U          U
Alaska                  -          4           -          2          1          -          29         26
Hawaii                 22         20          19         22          2          -          81         89

Guam                    3         20           -          -          -          -           -         39
P.R.                   23         28           -          -         82        113          41         80
V.I.                    -          -           -          -          U          U           U          U
Amer. Samoa             -          -           -          -          U          U           U          U
C.N.M.I.                -         12           -          -          -        135           -         58

----------------------------------------------------------------------------------------------------------
N: Not notifiable    U: Unavailable    -: no reported cases

 * Individual cases may be reported through both the National Electronic Telecommunications System for Surveillance (NETSS)
   and the Public Health Laboratory Information System (PHLIS).
** Cumulative reports of provisional tuberculosis cases for 1998 and 1999 are unavailable ('U') for some
   areas using the Tuberculosis Information Management System (TIMS).

=======================================================================================================================================================


Return to top.

Table III
Note: To print large tables and graphs users may have to change their printer settings to landscape and use a small font size.
TABLE III. (page 1) Provisional cases of selected notifiable diseases preventable by vaccination, United
States, weeks ending July 3, 1999, and July 4, 1998 (26th Week)

                                                Hepatitis (Viral), by type                                    Measles (Rubeola)
                     H. influenzae,       ---------------------------------------        ------------------------------------------------------------
                        invasive                  A                     B                  Indigenous            Imported*                 Total
                    ----------------      -----------------     -----------------        ---------------       ---------------        ---------------
                     Cum.       Cum.        Cum.       Cum.       Cum.       Cum.                   Cum.                  Cum.        Cum.       Cum.
Reporting Area       1999**     1998        1999       1998       1999       1998        1999       1999       1999       1999        1999       1998
-----------------------------------------------------------------------------------------------------------------------------------------------------
UNITED STATES         610        610       7,729     11,282      3,179      4,473           1         30          -         14          44         40

NEW ENGLAND            42         41          91        152         53         95           -          5          -          4           9          2
Maine                   5          2           4         13          -          2           -          -          -          -           -          -
N.H.                    9          6           7          7          8         10           -          -          -          1           1          -
Vt.                     4          2           3         13          1          4           -          -          -          -           -          -
Mass.                  17         29          30         51         28         36           -          4          -          2           6          2
R.I.                    -          2           9          9         16         24           -          -          -          -           -          -
Conn.                   7          -          38         59          -         19           -          1          -          1           2          -

MID. ATLANTIC          85         92         510        856        392        640           -          -          -          2           2         11
Upstate N.Y.           49         29         128        166        103        124           -          -          -          2           2          2
N.Y. City              13         28          82        313         89        219           -          -          -          -           -          -
N.J.                   23         28          57        160         40        107           -          -          -          -           -          8
Pa.                     -          7         243        217        160        190           -          -          -          -           -          1

E.N. CENTRAL           83         98       1,499      1,552        304        498           -          1          -          -           1         15
Ohio                   35         34         366        177         45         37           -          -          -          -           -          1
Ind.                   14         23          98         89         27         55           -          1          -          -           1          3
Ill.                   27         37         220        384          -        133           -          -          -          -           -          -
Mich.                   7          -         789        777        231        225           -          -          -          -           -         10
Wis.                    -          4          26        125          1         48           -          -          -          -           -          1

W.N. CENTRAL           49         51         374        876        244        209           -          -          -          -           -          -
Minn.                  13         37          33         69         19         18           -          -          -          -           -          -
Iowa                   13          1          76        355        103         33           -          -          -          -           -          -
Mo.                    16          8         195        365         94        129           -          -          -          -           -          -
N. Dak.                 -          -           1          3          -          4           U          -          U          -           -          -
S. Dak.                 1          -           8         16          1          1           -          -          -          -           -          -
Nebr.                   3          -          33         14         10          9           -          -          -          -           -          -
Kans.                   3          5          28         54         17         15           U          -          U          -           -          -

S. ATLANTIC           144        112         954        863        571        466           -          1          -          3           4          6
Del.                    -          -           2          3          -          -           -          -          -          -           -          1
Md.                    33         38         159        175         85         88           -          -          -          -           -          1
D.C.                    4          -          32         30         11          6           -          -          -          -           -          -
Va.                    12         12          79        129         51         53           -          1          -          2           3          2
W. Va.                  4          4          17          1         13          3           -          -          -          -           -          -
N.C.                   22         15          65         51        117        110           -          -          -          -           -          -
S.C.                    2          3          19         17         38          9           -          -          -          -           -          -
Ga.                    38         22         259        247         66         90           -          -          -          -           -          1
Fla.                   29         18         322        210        190        107           -          -          -          1           1          1

E.S. CENTRAL           46         37         237        225        235        206           -          -          -          -           -          1
Ky.                     6          5          37         14         25         23           -          -          -          -           -          -
Tenn.                  25         23         125        127        118        142           -          -          -          -           -          -
Ala.                   13          7          36         45         47         41           -          -          -          -           -          1
Miss.                   2          2          39         39         45          -           -          -          -          -           -          -

W.S. CENTRAL           34         30       1,415      1,992        298      1,009           -          1          -          2           3          -
Ark.                    1          -          26         43         25         49           -          -          -          -           -          -
La.                     7         13          59         41         72         47           -          -          -          -           -          -
Okla.                  24         15         258        290         67         31           -          -          -          -           -          -
Tex.                    2          2       1,072      1,618        134        882           -          1          -          2           3          -

MOUNTAIN               60         77         747      1,725        321        437           -          2          -          -           2          -
Mont.                   1          -          12         56         16          3           -          -          -          -           -          -
Idaho                   1          -          27        140         16         17           U          -          U          -           -          -
Wyo.                    1          -           4         23          5          2           -          -          -          -           -          -
Colo.                   9         14         134        129         45         52           -          -          -          -           -          -
N. Mex.                13          4          29         86        110        168           -          -          -          -           -          -
Ariz.                  29         39         454      1,059         84        107           -          1          -          -           1          -
Utah                    4          3          25        115         17         39           -          1          -          -           1          -
Nev.                    2         17          62        117         28         49           U          -          U          -           -          -

PACIFIC                67         72       1,902      3,041        761        913           1         20          -          3          23          5
Wash.                   2          4         164        570         33         53           -          -          -          -           -          1
Oreg.                  26         30         141        240         50         93           -          8          -          -           8          -
Calif.                 32         31       1,585      2,188        661        752           1         11          -          3          14          4
Alaska                  5          1           3         14         10          7           -          -          -          -           -          -
Hawaii                  2          6           9         29          7          8           -          1          -          -           1          -

Guam                    -          -           2          -          2          2           U          1          U          -           1          -
P.R.                    1          2          80         25         76        130           -          -          -          -           -          -
V.I.                    U          U           U          U          U          U           U          U          U          U           U          U
Amer. Samoa             U          U           U          U          U          U           U          U          U          U           U          U
C.N.M.I.                -          -           -          1          -         35           U          -          U          -           -          -
-----------------------------------------------------------------------------------------------------------------------------------------------------
N: Not notifiable    U: Unavailable     -: no reported cases

 * For imported measles, cases include only those resulting from importation from other countries.
** Of 127 cases among children aged <5 years, serotype was reported for 58 and of those, 13 were type b.
=======================================================================================================================================================

TABLE III. (page 2) Provisional cases of selected notifiable diseases preventable by vaccination, United
States, weeks ending July 3, 1999, and July 4, 1998 (26th Week)

                     Meningococcal
                        Disease                      Mumps                           Pertussis                          Rubella
                   -----------------        --------------------------       ---------------------------       ---------------------------
                     Cum.       Cum.                   Cum.       Cum.                   Cum.       Cum.                  Cum.        Cum.
Reporting Area       1999       1998        1999       1999       1998       1999        1999       1998       1999       1999        1998
------------------------------------------------------------------------------------------------------------------------------------------
UNITED STATES       1,330      1,582           4        180        406         32       2,539      2,448          3        138         291

NEW ENGLAND            74         69           -          3          1          -         254        450          -          6          37
Maine                   5          4           -          -          -          -           -          5          -          -           -
N.H.                   10          8           -          1          -          -          53         34          -          -           -
Vt.                     4          1           -          -          -          -           9         38          -          -           -
Mass.                  45         30           -          2          1          -         176        355          -          6           8
R.I.                    2          3           -          -          -          -           8          3          -          -           -
Conn.                   8         23           -          -          -          -           8         15          -          -          29

MID. ATLANTIC         117        165           1         22        168          9         577        299          -         17         130
Upstate N.Y.           34         43           -          5          2          3         498        148          -         13         108
N.Y. City              27         20           -          3        153          -          10         14          -          -           9
N.J.                   23         39           -          -          5          -          12          8          -          1          12
Pa.                    33         63           1         14          8          6          57        129          -          3           1

E.N. CENTRAL          206        244           -         23         49          1         208        229          -          1           -
Ohio                   91         82           -          7         19          -         107         72          -          -           -
Ind.                   37         43           -          3          5          -          14         61          -          1           -
Ill.                   50         69           -          6          8          -          38         26          -          -           -
Mich.                  27         26           -          7         17          1          22         32          -          -           -
Wis.                    1         24           -          -          -          -          27         38          -          -           -

W.N. CENTRAL          151        133           -          7         20          8          92        176          -         71          29
Minn.                  30         24           -          1         10          8          33        100          -          -           -
Iowa                   28         19           -          3          6          -          20         43          -         21           -
Mo.                    59         52           -          1          3          -          15         13          -          2           2
N. Dak.                 3          -           U          -          1          U           -          -          U          -           -
S. Dak.                 8          6           -          -          -          -           4          4          -          -           -
Nebr.                   9          8           -          -          -          -           1          6          -         48           -
Kans.                  14         24           U          2          -          U          19         10          U          -          27

S. ATLANTIC           231        256           1         36         26          4         142        122          3         20           7
Del.                    3          1           -          -          -          -           -          1          -          -           -
Md.                    35         23           -          3          -          1          39         27          -          1           -
D.C.                    1          -           -          2          -          -           -          1          -          -           -
Va.                    26         23           -          8          5          -          13          6          -          -           -
W. Va.                  4          9           -          -          -          -           1          1          -          -           -
N.C.                   27         39           -          8          8          -          35         44          3         19           5
S.C.                   28         41           -          3          4          -           8         15          -          -           -
Ga.                    41         58           -          2          1          -          16          6          -          -           -
Fla.                   66         62           1         10          8          3          30         21          -          -           2

E.S. CENTRAL          108        116           -          1          8          -          43         53          -          1           -
Ky.                    29         16           -          -          -          -           3         20          -          -           -
Tenn.                  38         41           -          -          1          -          25         17          -          -           -
Ala.                   24         40           -          1          4          -          11         14          -          1           -
Miss.                  17         19           -          -          3          -           4          2          -          -           -

W.S. CENTRAL           97        186           -         21         35          1          62        150          -          5          70
Ark.                   22         23           -          -          -          1           7         16          -          -           -
La.                    34         35           -          3          5          -           3          1          -          -           -
Okla.                  19         27           -          1          -          -           7         15          -          -           -
Tex.                   22        101           -         17         30          -          45        118          -          5          70

MOUNTAIN               89         85           -         12         24          3         248        508          -         14           5
Mont.                   2          3           -          -          -          -           2          1          -          -           -
Idaho                   8          4           U          1          3          U          93        184          U          -           -
Wyo.                    3          3           -          -          1          -           2          7          -          -           -
Colo.                  24         17           -          3          3          -          60        120          -          -           -
N. Mex.                11         15           N          N          N          3          27         64          -          -           1
Ariz.                  28         30           -          -          5          -          29         88          -         13           1
Utah                    8          8           -          5          3          -          33         26          -          -           2
Nev.                    5          5           U          3          9          U           2         18          U          1           1

PACIFIC               257        328           2         55         75          6         913        461          -          3          13
Wash.                  38         41           -          2          5          3         502        148          -          -           9
Oreg.                  44         55           N          N          N          1          18         29          -          -           -
Calif.                166        227           1         46         54          2         383        275          -          3           2
Alaska                  5          1           -          1          2          -           3          2          -          -           -
Hawaii                  4          4           1          6         14          -           7          7          -          -           2

Guam                    -          2           U          1          2          U           1          -          U          -           -
P.R.                    5          6           -          -          2          -           9          3          -          -           -
V.I.                    U          U           U          U          U          U           U          U          U          U           U
Amer. Samoa             U          U           U          U          U          U           U          U          U          U           U
C.N.M.I.                -          -           U          -          2          U           -          1          U          -           -

------------------------------------------------------------------------------------------------------------------------------------------
N: Not notifiable    U: Unavailable     -: no reported cases

=======================================================================================================================================================


Return to top.

Table IV
Note: To print large tables and graphs users may have to change their printer settings to landscape and use a small font size.
TABLE IV. Deaths in 122 U.S. cities,* week ending
July 3, 1999 (26th Week)
===================================================================================================================================
                                                 All Causes, By Age (Years)
                          ------------------------------------------------------------------------        P&I**
Reporting Area            All Ages         >=65        45-64       25-44         1-24           <1        Total
---------------------------------------------------------------------------------------------------------------
NEW ENGLAND                    218          157           43          11            3            4           21
Boston, Mass.                    U            U            U           U            U            U            U
Bridgeport, Conn.               22           14            3           4            1            -            -
Cambridge, Mass.                14           11            3           -            -            -            1
Fall River, Mass.                U            U            U           U            U            U            U
Hartford, Conn.                  U            U            U           U            U            U            U
Lowell, Mass.                   27           20            7           -            -            -            2
Lynn, Mass.                      U            U            U           U            U            U            U
New Bedford, Mass.              28           22            4           2            -            -            4
New Haven, Conn.                35           24            7           2            1            1            4
Providence, R.I.                 U            U            U           U            U            U            U
Somerville, Mass.                6            5            1           -            -            -            -
Springfield, Mass.               U            U            U           U            U            U            U
Waterbury, Conn.                22           15            3           1            1            2            2
Worcester, Mass.                64           46           15           2            -            1            8

MID. ATLANTIC                2,000        1,352          392         162           49           39           66
Albany, N.Y.                    58           42           12           2            -            2            -
Allentown, Pa.                   U            U            U           U            U            U            U
Buffalo, N.Y.                   85           62           15           3            3            2            1
Camden, N.J.                     U            U            U           U            U            U            U
Elizabeth, N.J.                  U            U            U           U            U            U            U
Erie, Pa.                       41           30            9           -            1            -            1
Jersey City, N.J.               32           24            6           1            1            -            -
New York City, N.Y.          1,127          755          223         101           27           21           30
Newark, N.J.                     U            U            U           U            U            U            U
Paterson, N.J.                  22           16            -           1            -            -            -
Philadelphia, Pa.              299          183           68          34           10            4            8
Pittsburgh, Pa.***              45           29            8           4            2            2            6
Reading, Pa.                    34           28            4           -            1            1            2
Rochester, N.Y.                121           87           21           8            2            3           11
Schenectady, N.Y.                U            U            U           U            U            U            U
Scranton, Pa.                   33           22            9           1            1            -            2
Syracuse, N.Y.                  76           57            8           7            -            4            5
Trenton, N.J.                    U            U            U           U            U            U            U
Utica, N.Y.                     27           17            9           -            1            -            -
Yonkers, N.Y.                    U            U            U           U            U            U            U

E.N. CENTRAL                 1,818        1,233          362         131           43           47          107
Akron, Ohio                     54           35           13           5            -            1            -
Canton, Ohio                    27           21            2           2            -            2            1
Chicago, Ill.                  395          249           86          37           10           11           29
Cincinnati, Ohio                70           48            7           5            3            7            4
Cleveland, Ohio                142           97           29           9            3            4            6
Columbus, Ohio                 164          122           30           8            1            3           15
Dayton, Ohio                   112           85           20           6            1            -            7
Detroit, Mich.                 202          116           50          24            6            6            7
Evansville, Ind.                 U            U            U           U            U            U            U
Fort Wayne, Ind.                79           63           12           2            1            1            3
Gary, Ind.                      20            9            5           2            2            2            -
Grand Rapids, Mich.             52           33           12           4            2            1            3
Indianapolis, Ind.             149           95           30          12            8            4            9
Lansing, Mich.                  42           32            8           2            -            -            1
Milwaukee, Wis.                 89           64           14           8            1            2            9
Peoria, Ill.                    53           39            9           2            2            1            2
Rockford, Ill.                  42           31            9           1            1            -            2
South Bend, Ind.                30           24            5           1            -            -            3
Toledo, Ohio                    96           70           21           1            2            2            6
Youngstown, Ohio                 U            U            U           U            U            U            U

W.N. CENTRAL                   424          318           65          20           12            9           26
Des Moines, Iowa                55           43            9           3            -            -            4
Duluth, Minn.                    U            U            U           U            U            U            U
Kansas City, Kans.               U            U            U           U            U            U            U
Kansas City, Mo.                72           54            8           4            4            2            3
Lincoln, Nebr.                  25           20            3           2            -            -            1
Minneapolis, Minn.             205          151           33          10            6            5           13
Omaha, Nebr.                     U            U            U           U            U            U            U
St. Louis, Mo.                   U            U            U           U            U            U            U
St. Paul, Minn.                 67           50           12           1            2            2            5
Wichita, Kans.                   U            U            U           U            U            U            U

S. ATLANTIC                    684          466          142          50           14           12           50
Atlanta, Ga.                     U            U            U           U            U            U            U
Baltimore, Md.                 142           94           28          15            2            3           15
Charlotte, N.C.                 86           50           21          13            2            -           12
Jacksonville, Fla.             138          101           30           4            3            -            7
Miami, Fla.                      U            U            U           U            U            U            U
Norfolk, Va.                    47           33           10           2            1            1            5
Richmond, Va.                   57           37           11           5            -            4            2
Savannah, Ga.                   35           30            4           1            -            -            4
St. Petersburg, Fla.             U            U            U           U            U            U            U
Tampa, Fla.                    179          121           38          10            6            4            5
Washington, D.C.                 U            U            U           U            U            U            U
Wilmington, Del.                 U            U            U           U            U            U            U

E.S. CENTRAL                   809          528          171          71           29            9           34
Birmingham, Ala.               160          103           41          10            5            -           10
Chattanooga, Tenn.              61           47            6           5            3            -            4
Knoxville, Tenn.                91           64           17           8            -            2            4
Lexington, Ky.                  94           63           19           7            2            3            7
Memphis, Tenn.                 200          124           38          23           11            4            9
Mobile, Ala.                    80           55           18           7            -            -            -
Montgomery, Ala.                 U            U            U           U            U            U            U
Nashville, Tenn.               123           72           32          11            8            -            -

W.S. CENTRAL                   751          523          138          50           23           17           46
Austin, Tex.                     U            U            U           U            U            U            U
Baton Rouge, La.                 U            U            U           U            U            U            U
Corpus Christi, Tex.            48           34           11           1            2            -            3
Dallas, Tex.                     U            U            U           U            U            U            U
El Paso, Tex.                    U            U            U           U            U            U            U
Ft. Worth, Tex.                114           76           20           9            2            7            6
Houston, Tex.                    U            U            U           U            U            U            U
Little Rock, Ark.               67           47           14           1            3            2            4
New Orleans, La.               130           89           25          10            6            -            4
San Antonio, Tex.              202          143           33          18            5            3           15
Shreveport, La.                 66           47           12           3            2            2            7
Tulsa, Okla.                   124           87           23           8            3            3            7

MOUNTAIN                       490          332          103          37           12            6           24
Albuquerque, N.M.                U            U            U           U            U            U            U
Boise, Idaho                     U            U            U           U            U            U            U
Colo. Springs, Colo.            52           39            5           6            2            -            1
Denver, Colo.                    U            U            U           U            U            U            U
Las Vegas, Nev.                204          136           49          12            5            2            9
Ogden, Utah                     25           19            4           2            -            -            1
Phoenix, Ariz.                  56           43            5           7            1            -            5
Pueblo, Colo.                   25           19            3           3            -            -            3
Salt Lake City, Utah             U            U            U           U            U            U            U
Tucson, Ariz.                  128           76           37           7            4            4            5

PACIFIC                      1,216          835          231          90           25           33           87
Berkeley, Calif.                19            9            6           2            -            2            1
Fresno, Calif.                 135           96           26           8            2            3           10
Glendale, Calif.                18           16            1           1            -            -            -
Honolulu, Hawaii                67           50           12           4            -            1            5
Long Beach, Calif.              70           52           12           3            1            2           13
Los Angeles, Calif.            269          183           53          19            6            8           18
Pasadena, Calif.                 U            U            U           U            U            U            U
Portland, Oreg.                117           82           20           5            4            6            5
Sacramento, Calif.               U            U            U           U            U            U            U
San Diego, Calif.              134           86           28          18            1            1           14
San Francisco, Calif.            U            U            U           U            U            U            U
San Jose, Calif.               207          144           36          15            8            4           16
Santa Cruz, Calif.               U            U            U           U            U            U            U
Seattle, Wash.                 108           66           26           9            1            6            3
Spokane, Wash.                   U            U            U           U            U            U            U
Tacoma, Wash.                   72           51           11           6            2            -            2

TOTAL                    8,410****        5,744        1,647         622          210          176          461

---------------------------------------------------------------------------------------------------------------
U: Unavailable    -: no reported cases

   * Mortality data in this table are voluntarily reported from 122 cities in the United States, most of which have populations
     of 100,000 or more. A death is reported by the place of its occurrence and by the week that the death certificate was
     filed. Fetal deaths are not included.
  ** Pneumonia and influenza.
 *** Because of changes in reporting methods in this Pennsylvania city, these numbers are partial counts for the current
     week. Complete counts will be available in 4 to 6 weeks.
**** Total includes unknown ages.
===================================================================================================================================


Return to top.

Disclaimer   All MMWR HTML versions of articles are electronic conversions from ASCII text into HTML. This conversion may have resulted in character translation or format errors in the HTML version. Users should not rely on this HTML document, but are referred to the electronic PDF version and/or the original MMWR paper copy for the official text, figures, and tables. An original paper copy of this issue can be obtained from the Superintendent of Documents, U.S. Government Printing Office (GPO), Washington, DC 20402-9371; telephone: (202) 512-1800. Contact GPO for current prices.

**Questions or messages regarding errors in formatting should be addressed to mmwrq@cdc.gov.

Page converted: 07/08/99

HOME  |  ABOUT MMWR  |  MMWR SEARCH  |  DOWNLOADS  |  RSSCONTACT
POLICY  |  DISCLAIMER  |  ACCESSIBILITY

Safer, Healthier People

Morbidity and Mortality Weekly Report
Centers for Disease Control and Prevention
1600 Clifton Rd, MailStop E-90, Atlanta, GA 30333, U.S.A

USA.GovDHHS

Department of Health
and Human Services

This page last reviewed 5/2/01