 |
|
|
|
|
|
|
| ||||||||||
|
|
|
|
|
|
|
||||
| ||||||||||
|
|
|
|
|
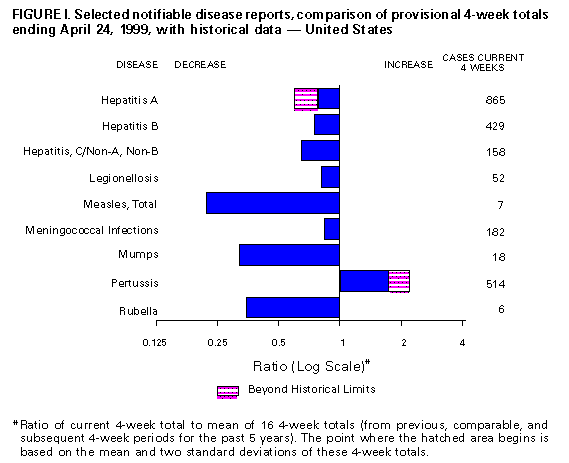
Persons using assistive technology might not be able to fully access information in this file. For assistance, please send e-mail to: mmwrq@cdc.gov. Type 508 Accommodation and the title of the report in the subject line of e-mail. Notifiable Diseases/Deaths in Selected Cities Weekly InformationFigure_I Selected notifiable disease reports, comparison of provisional 4-week totals ending April 24, 1999, with historical data -- United States Table_I Summary -- provisional cases of selected notifiable diseases, United States, cumulative, week ending April 24, 1999 (16th Week) Table_II Provisional cases of selected notifiable diseases, United States, weeks ending April 24, 1999 and April 25, 1998 (16th Week) Table_III Provisional cases of selected notifiable diseases preventable by vaccination, United States, weeks ending April 24, 1999 and April 25, 1998 (16th Week) Table_IV Deaths in 122 U.S. cities, week ending
April 24, 1999 (16th Week)
TABLE I. Summary -- provisional cases of specified notifiable diseases, United
States, cumulative, week ending April 24, 1999 (16th Week)
==================================================================================
                                             Cum. 1999
------------------------------------------------------
Anthrax                                              -
Brucellosis                                         13
Cholera                                              -
Congenital rubella syndrome                          2
Cryptosporidiosis*                                 344
Diphtheria                                           -
Encephalitis:  California*                           2
               eastern equine*                       -
               St. Louis*                            -
               western equine*                       -
Hansen Disease                                      18
Hantavirus pulmonary syndrome*+                      2
Hemolytic uremic syndrome, post-diarrheal*           6
HIV infection, pediatric*&                          37
Plague                                               -
Poliomyelitis, paralytic                             -
Psittacosis                                         10
Rabies, human                                        -
Rocky Mountain spotted fever (RMSF)                 39
Streptococcal disease, invasive Group A            631
Streptococcal toxic-shock syndrome*                 14
Syphilis, congenital@                               15
Tetanus                                              5
Toxic-shock syndrome                                33
Trichinosis                                          5
Typhoid fever                                       83
Yellow fever                                         -
------------------------------------------------------
-: no reported cases
 * Not notifiable in all states
 + Updated weekly from reports to the Division of Viral and Rickettsial
   Diseases, National Center for Infectious Diseases (NCID).
 & Updated monthly from reports to the Division of HIV/AIDS Prevention --
   Surveillance and Epidemiology, National Center for HIV, STD, and TB
   Prevention (NCHSTP), last update March 28, 1999.
 @ Updated from reports to the Division of STD Prevention, NCHSTP.

==================================================================================
Return to top. Table_II Note: To print large tables and graphs users may have to change their printer settings to landscape and use a small font size.
TABLE II. (page 1) Provisional cases of selected notifiable diseases, United States, weeks ending
April 24, 1999, and April 25, 1998 (16th Week)
Escherichia
coli O157:H7
------------------- Hepatitis
AIDS Chlamydia NETSS** PHLIS*** Gonorrhea C/NA,NB
----------------- -------------------- -------- -------- ------------------- ----------------
Cum. Cum. Cum. Cum. Cum. Cum. Cum. Cum. Cum. Cum.
Reporting Area 1999* 1998 1999 1998 1999 1999 1999 1998 1999 1998
------------------------------------------------------------------------------------------------------------------------------
UNITED STATES 11,513 14,555 156,448 173,683 328 168 84,493 101,001 742 1,440
NEW ENGLAND 542 368 5,863 6,472 48 35 1,899 1,750 65 26
Maine 5 8 193 278 4 - 15 12 - -
N.H. 18 12 292 312 3 2 22 29 - -
Vt. 4 10 151 113 6 1 16 8 2 2
Mass. 367 94 2,807 2,693 22 19 844 651 62 24
R.I. 30 42 682 767 1 1 183 102 1 -
Conn. 118 202 1,738 2,309 12 12 819 948 - -
MID. ATLANTIC 2,841 4,301 23,417 21,617 21 2 11,988 12,070 50 116
Upstate N.Y. 360 540 N N 18 - 1,422 2,049 31 100
N.Y. City 1,441 2,404 11,522 11,119 - 1 4,972 4,904 - -
N.J. 600 749 3,522 3,497 3 1 1,738 2,139 - -
Pa. 440 608 8,372 7,001 N - 3,856 2,978 19 16
E.N. CENTRAL 841 1,246 23,419 25,923 52 34 15,645 19,345 153 158
Ohio 147 211 6,488 8,247 26 8 3,798 5,038 - 5
Ind. 124 271 - - 5 8 726 1,905 - 3
Ill. 402 487 8,603 6,818 10 7 6,110 5,550 4 19
Mich. 124 218 6,594 6,674 11 5 4,390 5,215 149 131
Wis. 44 59 1,734 4,184 N 6 621 1,637 - -
W.N. CENTRAL 248 271 5,634 10,965 71 21 1,880 5,082 40 9
Minn. 38 48 1,926 2,194 17 14 715 744 - -
Iowa 29 11 862 1,268 8 2 200 391 - 3
Mo. 97 139 - 3,917 9 4 - 2,688 38 4
N. Dak. 3 4 102 302 2 - 7 30 - -
S. Dak. 6 7 436 520 1 1 39 82 - -
Nebr. 19 24 819 914 27 - 332 358 - 2
Kans. 56 38 1,489 1,850 7 - 587 789 2 -
S. ATLANTIC 3,237 3,703 33,564 34,227 32 17 25,116 27,014 66 37
Del. 40 40 878 786 1 - 530 423 - -
Md. 345 483 2,514 2,541 1 - 2,413 2,740 20 3
D.C. 118 304 N N - - 849 1,096 - -
Va. 179 279 3,670 3,051 9 4 2,489 2,083 6 1
W. Va. 19 34 694 1,488 - 1 165 496 11 3
N.C. 198 270 7,279 6,927 7 6 6,277 5,806 - 7
S.C. 321 236 5,733 5,877 2 1 2,837 3,639 12 -
Ga. 349 374 4,609 7,765 1 - 3,743 6,200 1 8
Fla. 1,668 1,683 8,187 5,792 11 5 5,813 4,531 16 15
E.S. CENTRAL 493 565 12,732 12,013 22 7 10,314 11,327 69 41
Ky. 70 85 1,812 1,882 5 - 883 1,067 1 7
Tenn. 214 159 4,377 3,772 10 3 3,377 3,189 32 31
Ala. 110 183 3,615 3,146 4 3 3,287 3,992 1 3
Miss. 99 138 2,928 3,213 3 1 2,767 3,079 35 -
W.S. CENTRAL 1,182 1,883 17,145 25,516 10 7 10,281 15,170 87 316
Ark. 45 71 1,709 1,099 3 2 788 1,291 1 3
La. 121 301 5,376 3,678 3 3 4,355 3,158 75 1
Okla. 35 72 2,383 3,022 3 2 1,253 1,619 2 -
Tex. 981 1,439 7,677 17,717 1 - 3,885 9,102 9 312
MOUNTAIN 405 514 8,720 9,384 26 14 2,287 2,459 53 184
Mont. 4 12 427 330 - - 16 17 4 4
Idaho 5 12 501 564 1 1 26 48 4 74
Wyo. 2 1 242 218 1 3 9 11 17 42
Colo. 76 90 2,169 2,400 9 4 607 731 9 10
N. Mex. 13 76 1,172 1,117 2 - 209 201 4 27
Ariz. 190 200 2,834 3,288 7 3 1,037 1,108 12 1
Utah 37 44 521 689 6 2 55 72 1 14
Nev. 78 79 854 778 - 1 328 271 2 12
PACIFIC 1,724 1,704 25,954 27,566 46 31 5,083 6,784 159 553
Wash. 90 133 3,630 3,384 10 14 656 585 3 6
Oreg. 45 41 1,656 - 14 10 232 - 4 8
Calif. 1,562 1,483 19,370 22,851 22 6 3,991 5,959 152 504
Alaska 6 11 617 631 - - 116 99 - 1
Hawaii 21 36 681 700 - 1 88 141 - 34
Guam 1 - - 98 N - - 6 - -
P.R. 411 578 U U 4 U 102 122 - -
V.I. 10 15 N N N U U U U U
Amer. Samoa - - U U N U U U U U
C.N.M.I. - - N N N U - 12 - -
------------------------------------------------------------------------------------------------------------------------------
N: Not notifiable U: Unavailable -: no reported cases C.N.M.I.: Commonwealth of North Mariana Islands
* Updated monthly from reports to the Division of HIV/AIDS Prevention -- Surveillance and Epidemiology, National Center for HIV,
STD, and TB Prevention, last update March 28, 1999.
** National Electronic Telecommunications System for Surveillance.
*** Public Health Laboratory Information System.
=======================================================================================================================================================
TABLE II. (page 2) Provisional cases of selected notifiable diseases, United States, weeks ending
April 24, 1999, and April 25, 1998 (16th Week)
Lyme Syphilis Rabies,
Legionellosis Disease Malaria (Primary & Secondary) Tuberculosis Animal
---------------- ---------------- ---------------- --------------------- ----------------- -------
Cum. Cum. Cum. Cum. Cum. Cum. Cum. Cum. Cum. Cum. Cum.
Reporting Area 1999 1998 1999 1998 1999 1998 1999 1998 1999 * 1998 * 1999
-------------------------------------------------------------------------------------------------------------------------------------------
UNITED STATES 252 358 1,142 1,279 294 350 1,780 2,182 1,478 2,381 1,481
NEW ENGLAND 18 20 162 282 4 15 25 23 101 106 252
Maine 2 1 - 2 - - - 1 3 3 41
N.H. 2 2 - 5 - 2 - 1 - 2 15
Vt. 3 1 - 2 1 - 1 - - 1 46
Mass. 4 6 109 64 3 13 15 17 50 53 50
R.I. 1 4 10 18 - - 1 - 15 14 32
Conn. 6 6 43 191 - - 8 4 33 33 68
MID. ATLANTIC 72 83 732 806 73 103 81 88 559 571 299
Upstate N.Y. 21 22 254 384 22 25 9 7 75 76 188
N.Y. City 5 22 5 21 16 52 36 17 337 350 U
N.J. 5 3 118 100 24 15 11 30 147 145 69
Pa. 41 36 355 301 11 11 25 34 U U 42
E.N. CENTRAL 60 137 24 21 28 35 337 311 94 114 12
Ohio 23 47 17 14 4 2 27 52 U U 3
Ind. 5 25 5 4 4 1 32 52 U U -
Ill. 9 18 1 1 11 18 226 131 U U -
Mich. 22 22 1 2 7 12 49 52 68 82 9
Wis. 1 25 U U 2 2 3 24 26 32 -
W.N. CENTRAL 10 23 15 11 14 19 9 61 128 107 151
Minn. - 3 8 3 2 8 4 4 59 35 28
Iowa 7 4 2 7 3 3 1 - 7 - 37
Mo. 2 7 - - 8 7 - 46 49 48 6
N. Dak. - - 1 - - - - - 1 3 30
S. Dak. 1 - - - - - - - 3 4 25
Nebr. - 7 - - - - 1 4 4 2 1
Kans. - 2 4 1 1 1 3 7 5 15 24
S. ATLANTIC 35 42 133 116 79 70 633 847 237 464 559
Del. 2 6 2 2 - 1 1 7 - 8 3
Md. 5 9 101 95 23 27 134 236 U U 117
D.C. - 3 1 4 6 4 12 30 14 33 -
Va. 6 4 3 4 15 9 42 66 44 89 135
W. Va. N N 4 4 1 - 2 - 12 19 33
N.C. 5 4 16 1 6 7 172 231 93 223 128
S.C. 6 4 1 - - - 83 96 74 92 44
Ga. - - - 2 5 13 90 89 U U 46
Fla. 11 12 5 4 23 9 97 92 U U 53
E.S. CENTRAL 8 11 14 13 5 10 341 377 99 189 77
Ky. 2 5 - 2 - - 28 41 U U 13
Tenn. 5 3 5 6 3 5 171 189 U U 26
Ala. 1 1 6 5 2 3 95 79 93 113 38
Miss. - 2 3 - - 2 47 68 6 76 -
W.S. CENTRAL 1 4 - 3 8 11 252 280 70 632 26
Ark. - - - 2 - 1 26 46 40 33 -
La. 1 - - - 6 3 77 94 U U -
Okla. - - - - 1 1 64 13 30 35 26
Tex. - 4 - 1 1 6 85 127 - 564 -
MOUNTAIN 17 17 3 1 14 18 44 79 47 71 49
Mont. - 1 - - 2 - - - - 2 18
Idaho - - - - 1 1 - - - 3 -
Wyo. - 1 1 - - - - - - 1 18
Colo. 1 4 - - 5 6 - 4 U U 1
N. Mex. 1 2 1 - 2 6 - 7 20 18 -
Ariz. 1 2 - - 4 2 41 61 U U 12
Utah 8 6 1 - - 1 1 2 12 18 -
Nev. 6 1 - 1 - 2 2 5 15 29 -
PACIFIC 31 21 59 26 69 69 58 116 143 127 56
Wash. 5 2 - 1 5 3 16 6 82 65 -
Oreg. 1 - 1 1 7 6 - - U U -
Calif. 24 19 58 24 53 59 40 110 U U 51
Alaska 1 - - - - - 1 - 17 13 5
Hawaii - - - - 4 1 1 - 44 49 -
Guam - 1 - - - 1 - - - 37 -
P.R. - - - - - - 63 69 - 30 25
V.I. U U U U U U U U U U U
Amer. Samoa U U U U U U U U U U U
C.N.M.I. - - - - - - - 81 - 49 -
-------------------------------------------------------------------------------------------------------------------------------------------
N: Not notifiable U: Unavailable -: no reported cases
* Cumulative reports of provisional tuberculosis cases for 1998 and 1999 are unavailable ('U') for some areas using the Tuberculosis
Information Management System (TIMS).
=======================================================================================================================================================
Return to top. Table_III Note: To print large tables and graphs users may have to change their printer settings to landscape and use a small font size.
TABLE III. (page 1) Provisional cases of selected notifiable diseases preventable by vaccination, United
States, weeks ending April 24, 1999, and April 25, 1998 (16th Week)
Hepatitis (Viral), by type Measles (Rubeola)
H. influenzae, --------------------------------------- ------------------------------------------------------------
invasive A B Indigenous Imported** Total
---------------- ----------------- ----------------- --------------- --------------- ---------------
Cum. Cum. Cum. Cum. Cum. Cum. Cum. Cum. Cum. Cum.
Reporting Area 1999* 1998 1999 1998 1999 1998 1999 1999 1999 1999 1999 1998
-----------------------------------------------------------------------------------------------------------------------------------------------------
UNITED STATES 376 385 4,572 6,768 1,781 2,647 1 17 4 10 27 18
NEW ENGLAND 28 26 60 103 31 43 - - - 1 1 1
Maine 2 2 2 10 - - - - - - - -
N.H. 5 1 7 6 4 5 - - - 1 1 -
Vt. 4 2 3 7 1 - - - - - - -
Mass. 11 19 17 29 17 23 - - - - - 1
R.I. - 2 6 7 9 4 - - - - - -
Conn. 6 - 25 44 - 11 - - - - - -
MID. ATLANTIC 48 55 310 505 241 404 - - 2 2 2 6
Upstate N.Y. 26 19 77 115 58 101 - - 2 2 2 -
N.Y. City 5 15 47 181 55 115 - - - - - -
N.J. 17 19 42 90 33 71 - - - - - 5
Pa. - 2 144 119 95 117 - - - - - 1
E.N. CENTRAL 42 57 1,063 971 145 505 - - - - - 2
Ohio 22 25 256 117 30 24 - - - - - -
Ind. 1 9 29 89 4 225 - - - - - 1
Ill. 15 22 140 257 - 82 - - - - - -
Mich. 4 - 616 419 111 145 - - - - - 1
Wis. - 1 22 89 - 29 - - - - - -
W.N. CENTRAL 36 28 234 594 104 119 - - - - - -
Minn. 11 17 18 28 13 11 - - - - - -
Iowa 8 1 52 268 18 16 - - - - - -
Mo. 11 6 128 237 63 77 - - - - - -
N. Dak. - - - 2 - 1 U - U - - -
S. Dak. 1 - 8 3 - 1 - - - - - -
Nebr. 3 - 15 15 6 4 - - - - - -
Kans. 2 4 13 41 4 9 - - - - - -
S. ATLANTIC 97 68 546 499 327 264 1 1 2 3 4 6
Del. - - 1 1 - - - - - - - 1
Md. 25 18 107 124 54 53 - - - - - 1
D.C. 2 - 22 21 7 5 - - - - - -
Va. 8 10 41 86 29 30 1 1 2 2 3 2
W. Va. 1 2 5 - 7 2 - - - - - -
N.C. 16 10 44 32 69 68 - - - - - -
S.C. 2 1 7 11 35 - - - - - - -
Ga. 20 18 144 110 38 57 - - - - - 1
Fla. 23 9 175 114 88 49 - - - 1 1 1
E.S. CENTRAL 29 23 142 142 130 145 - - - - - -
Ky. 2 5 6 8 7 14 U - U - - -
Tenn. 15 12 81 79 67 106 - - - - - -
Ala. 10 5 29 32 32 25 - - - - - -
Miss. 2 1 26 23 24 - - - - - - -
W.S. CENTRAL 21 23 483 1,015 150 346 - 1 - 2 3 -
Ark. 1 - 14 15 13 29 - - - - - -
La. 4 11 34 12 45 10 - - - - - -
Okla. 14 10 151 163 37 16 - - - - - -
Tex. 2 2 284 825 55 291 - 1 - 2 3 -
MOUNTAIN 41 62 461 1,046 166 253 - 1 - - 1 -
Mont. 1 - 5 10 7 2 - - - - - -
Idaho 1 - 17 76 9 13 - - - - - -
Wyo. 1 - 2 14 1 2 - - - - - -
Colo. 5 12 89 79 33 35 - 1 - - 1 -
N. Mex. 10 2 17 58 54 99 - - - - - -
Ariz. 19 31 267 661 33 57 - - - - - -
Utah 3 3 21 68 9 21 - - - - - -
Nev. 1 14 43 80 20 24 U - U - - -
PACIFIC 34 43 1,273 1,893 487 568 - 14 - 2 16 3
Wash. - 1 91 283 17 38 - - - - - -
Oreg. 14 21 83 150 28 62 - 8 - - 8 -
Calif. 16 18 1,095 1,433 431 458 - 6 - 2 8 3
Alaska 3 1 3 3 7 4 - - - - - -
Hawaii 1 2 1 24 4 6 - - - - - -
Guam - - - - - 1 U - U - - -
P.R. - 1 39 14 44 179 - - - - - -
V.I. U U U U U U U U U U U U
Amer. Samoa U U U U U U U U U U U U
C.N.M.I. - - - 1 - 27 U - U - - -
-----------------------------------------------------------------------------------------------------------------------------------------------------
N: Not notifiable U: Unavailable -: no reported cases
* Of 75 cases among children aged <5 years, serotype was reported for 32 and of those, 5 were type b.
** For imported measles, cases include only those resulting from importation from other countries.
=======================================================================================================================================================
TABLE III. (page 2) Provisional cases of selected notifiable diseases preventable by vaccination, United
States, weeks ending April 24, 1999, and April 25, 1998 (16th Week)
Meningococcal
Disease Mumps Pertussis Rubella
----------------- -------------------------- --------------------------- ---------------------------
Cum. Cum. Cum. Cum. Cum. Cum. Cum. Cum.
Reporting Area 1999 1998 1999 1999 1998 1999 1999 1998 1999 1999 1998
------------------------------------------------------------------------------------------------------------------------------------------
UNITED STATES 833 1,054 8 114 304 167 1,609 1,316 3 17 173
NEW ENGLAND 40 52 - 1 - 3 129 252 - 3 28
Maine 3 4 - - - - - 5 - - -
N.H. - 1 - 1 - 2 21 21 - - -
Vt. 3 1 - - - - 10 25 - - -
Mass. 27 23 - - - - 90 196 - 3 5
R.I. 2 3 - - - 1 3 - - - -
Conn. 5 20 - - - - 5 5 - - 23
MID. ATLANTIC 76 112 - 15 160 37 397 161 1 2 88
Upstate N.Y. 19 28 - 2 3 35 352 88 1 2 80
N.Y. City 18 13 - 3 153 - 10 9 - - 4
N.J. 16 28 - - 1 - - 7 - - 4
Pa. 23 43 - 10 3 2 35 57 - - -
E.N. CENTRAL 115 154 - 12 25 4 112 153 - - -
Ohio 57 53 - 6 11 3 92 49 - - -
Ind. 7 26 - - 2 - 2 40 - - -
Ill. 33 41 - - 2 - - 9 - - -
Mich. 18 16 - 6 10 1 18 17 - - -
Wis. - 18 - - - - - 38 - - -
W.N. CENTRAL 107 91 - 3 18 1 22 94 - - 2
Minn. 25 16 - - 9 - - 55 - - -
Iowa 24 12 - 2 6 1 10 16 - - -
Mo. 39 39 - 1 2 - 9 9 - - 1
N. Dak. - - U - 1 U - - U - -
S. Dak. 5 5 - - - - 2 4 - - -
Nebr. 4 4 - - - - 1 4 - - -
Kans. 10 15 - - - - - 6 - - 1
S. ATLANTIC 144 159 6 26 16 5 88 90 - 2 3
Del. 2 1 - - - - - - - - -
Md. 23 17 - 3 - - 27 18 - 1 -
D.C. 1 - - 1 - - - 1 - - -
Va. 19 17 5 7 4 5 12 6 - - -
W. Va. 2 4 - - - - 1 1 - - -
N.C. 17 24 1 5 6 - 22 40 - 1 3
S.C. 17 25 - 2 3 - 7 9 - - -
Ga. 23 37 - - - - 7 - - - -
Fla. 40 34 - 8 3 - 12 15 - - -
E.S. CENTRAL 64 81 - 1 3 2 30 35 - - -
Ky. 10 14 U - - U 1 17 U - -
Tenn. 24 30 - - - - 20 7 - - -
Ala. 18 25 - 1 1 2 6 10 - - -
Miss. 12 12 - - 2 - 3 1 - - -
W.S. CENTRAL 51 104 - 14 23 1 42 67 - 5 38
Ark. 12 13 - - - - 5 9 - - -
La. 26 20 - 1 1 - 3 - - - -
Okla. 11 21 - 1 - - 2 6 - - -
Tex. 2 50 - 12 22 1 32 52 - 5 38
MOUNTAIN 65 63 1 8 12 1 177 234 2 3 5
Mont. - 2 - - - - 1 1 - - -
Idaho 7 3 - - - - 85 81 - - -
Wyo. 2 3 - - 1 - 2 7 - - -
Colo. 19 14 1 3 1 - 30 53 - - -
N. Mex. 8 10 N N N - 13 49 - - 1
Ariz. 19 22 - - 4 - 21 23 2 3 1
Utah 5 6 - 4 1 1 23 12 - - 2
Nev. 5 3 U 1 5 U 2 8 U - 1
PACIFIC 171 238 1 34 47 113 612 230 - 2 9
Wash. 20 25 - - 4 104 375 79 - - 7
Oreg. 30 40 N N N - 8 14 - - -
Calif. 114 168 1 28 30 9 223 133 - 2 1
Alaska 3 1 - 1 2 - 2 - - - -
Hawaii 4 4 - 5 11 - 4 4 - - 1
Guam - - U - 2 U - - U - -
P.R. 2 2 - - 1 - - 2 - - -
V.I. U U U U U U U U U U U
Amer. Samoa U U U U U U U U U U U
C.N.M.I. - - U - 2 U - 1 U - -
------------------------------------------------------------------------------------------------------------------------------------------
N: Not notifiable U: Unavailable -: no reported cases
=======================================================================================================================================================
Return to top. Table_IV Note: To print large tables and graphs users may have to change their printer settings to landscape and use a small font size.
TABLE IV. Deaths in 122 U.S. cities,* week ending
April 24, 1999 (16th Week)
===================================================================================================================================
All Causes, By Age (Years)
------------------------------------------------------------------------ P&I**
Reporting Area All Ages >=65 45-64 25-44 1-24 <1 Total
---------------------------------------------------------------------------------------------------------------
NEW ENGLAND 491 375 70 28 14 4 50
Boston, Mass. 161 118 21 12 8 2 18
Bridgeport, Conn. 43 38 5 - - - 1
Cambridge, Mass. 6 4 1 1 - - -
Fall River, Mass. 15 13 2 - - - 1
Hartford, Conn. 50 36 6 5 3 - 4
Lowell, Mass. 21 16 2 1 1 1 1
Lynn, Mass. 13 10 3 - - - 3
New Bedford, Mass. 23 19 1 2 1 - 1
New Haven, Conn. 32 19 10 1 1 1 -
Providence, R.I. U U U U U U U
Somerville, Mass. 8 8 - - - - 1
Springfield, Mass. 34 26 7 1 - - 4
Waterbury, Conn. 34 26 6 2 - - 5
Worcester, Mass. 51 42 6 3 - - 11
MID. ATLANTIC 2,232 1,550 443 159 38 42 95
Albany, N.Y. 59 43 8 4 1 3 7
Allentown, Pa. U U U U U U U
Buffalo, N.Y. 108 75 20 8 4 1 4
Camden, N.J. 22 8 8 4 1 1 -
Elizabeth, N.J. 15 13 2 - - - -
Erie, Pa. 52 42 7 3 - - 3
Jersey City, N.J. 40 32 7 1 - - -
New York City, N.Y. 1,161 787 241 88 19 26 28
Newark, N.J. 47 23 14 7 3 - -
Paterson, N.J. 9 2 2 4 1 - -
Philadelphia, Pa. 300 204 70 19 4 3 22
Pittsburgh, Pa.*** 85 71 8 2 2 2 4
Reading, Pa. 28 23 4 - 1 - 2
Rochester, N.Y. 110 80 22 6 - 2 8
Schenectady, N.Y. 33 26 4 2 - 1 2
Scranton, Pa. 35 27 5 3 - - 3
Syracuse, N.Y. 77 59 12 1 2 3 10
Trenton, N.J. 30 21 6 3 - - 2
Utica, N.Y. 21 14 3 4 - - -
Yonkers, N.Y. U U U U U U U
E.N. CENTRAL 1,755 1,217 324 135 26 53 117
Akron, Ohio 57 42 8 3 1 3 -
Canton, Ohio 27 18 7 1 - 1 3
Chicago, Ill. U U U U U U U
Cincinnati, Ohio 85 51 17 9 2 6 6
Cleveland, Ohio 167 109 33 18 3 4 3
Columbus, Ohio 187 139 28 12 1 7 21
Dayton, Ohio 130 97 26 6 - 1 14
Detroit, Mich. 203 121 53 21 5 3 4
Evansville, Ind. 54 37 11 3 - 3 1
Fort Wayne, Ind. 68 51 11 3 2 1 1
Gary, Ind. 23 13 5 3 1 1 1
Grand Rapids, Mich. 44 33 7 2 - 2 3
Indianapolis, Ind. 188 111 42 19 5 11 14
Lansing, Mich. 46 35 9 2 - - 3
Milwaukee, Wis. 137 97 20 13 2 5 10
Peoria, Ill. 49 37 8 2 1 1 4
Rockford, Ill. 44 32 6 4 - 2 1
South Bend, Ind. 64 50 7 7 - - 16
Toledo, Ohio 114 84 19 6 3 2 11
Youngstown, Ohio 68 60 7 1 - - 1
W.N. CENTRAL 663 469 118 43 14 19 59
Des Moines, Iowa 97 69 17 5 3 3 15
Duluth, Minn. 30 20 6 3 1 - 2
Kansas City, Kans. U U U U U U U
Kansas City, Mo. 114 79 16 11 4 4 9
Lincoln, Nebr. 46 32 10 3 - 1 2
Minneapolis, Minn. 147 108 27 7 1 4 15
Omaha, Nebr. U U U U U U U
St. Louis, Mo. 122 75 27 10 3 7 5
St. Paul, Minn. 107 86 15 4 2 - 11
Wichita, Kans. U U U U U U U
S. ATLANTIC 1,036 646 227 94 25 44 46
Atlanta, Ga. U U U U U U U
Baltimore, Md. 131 79 30 18 4 - 8
Charlotte, N.C. 107 63 21 12 3 8 11
Jacksonville, Fla. 155 96 37 17 3 2 5
Miami, Fla. 107 70 21 11 5 - 1
Norfolk, Va. 51 32 12 2 - 5 1
Richmond, Va. 68 43 17 6 1 1 1
Savannah, Ga. 58 46 8 1 2 1 5
St. Petersburg, Fla. 64 53 10 1 - - 5
Tampa, Fla. 159 108 35 9 4 3 7
Washington, D.C. 119 47 31 14 3 24 2
Wilmington, Del. 17 9 5 3 - - -
E.S. CENTRAL 945 668 167 62 25 21 63
Birmingham, Ala. 216 160 35 10 5 4 26
Chattanooga, Tenn. 109 81 21 4 1 2 4
Knoxville, Tenn. 87 54 17 10 4 2 1
Lexington, Ky. 83 55 21 5 1 1 6
Memphis, Tenn. 212 155 32 16 5 4 20
Mobile, Ala. 84 59 18 4 1 2 2
Montgomery, Ala. U U U U U U U
Nashville, Tenn. 154 104 23 13 8 6 4
W.S. CENTRAL 1,610 1,090 305 130 45 38 127
Austin, Tex. 85 54 20 8 - 3 10
Baton Rouge, La. 34 19 7 6 2 - -
Corpus Christi, Tex. 59 45 10 3 - 1 6
Dallas, Tex. 182 112 35 21 5 9 8
El Paso, Tex. 80 51 18 6 2 1 2
Ft. Worth, Tex. 135 90 33 7 2 3 25
Houston, Tex. 412 280 76 33 15 8 27
Little Rock, Ark. 81 56 14 5 3 3 7
New Orleans, La. 125 82 23 14 4 2 11
San Antonio, Tex. 208 148 35 15 7 3 12
Shreveport, La. 71 53 11 4 1 2 12
Tulsa, Okla. 138 100 23 8 4 3 7
MOUNTAIN 912 657 151 66 19 18 79
Albuquerque, N.M. 93 73 14 3 2 1 7
Boise, Idaho 53 44 7 1 1 - 7
Colo. Springs, Colo. 62 47 10 4 - 1 7
Denver, Colo. 114 78 20 9 2 4 15
Las Vegas, Nev. 218 151 42 17 5 3 14
Ogden, Utah U U U U U U U
Phoenix, Ariz. 86 57 19 4 2 4 5
Pueblo, Colo. 32 26 3 3 - - 1
Salt Lake City, Utah 90 59 16 8 5 2 7
Tucson, Ariz. 164 122 20 17 2 3 16
PACIFIC 1,937 1,412 347 113 34 31 181
Berkeley, Calif. 12 10 1 1 - - 1
Fresno, Calif. 94 67 14 4 8 1 11
Glendale, Calif. 30 24 6 - - - 2
Honolulu, Hawaii 67 50 11 5 - 1 5
Long Beach, Calif. 63 44 14 3 - 2 6
Los Angeles, Calif. 541 401 87 35 10 8 30
Pasadena, Calif. 35 25 5 4 1 - 4
Portland, Oreg. 134 101 21 8 2 2 9
Sacramento, Calif. 173 122 35 10 5 1 33
San Diego, Calif. 157 113 29 6 1 8 11
San Francisco, Calif. 139 91 34 12 - 2 20
San Jose, Calif. 203 144 35 14 5 5 21
Santa Cruz, Calif. 35 25 10 - - - 10
Seattle, Wash. 105 75 21 8 - 1 8
Spokane, Wash. 57 44 10 1 2 - 3
Tacoma, Wash. 92 76 14 2 - - 7
TOTAL 11,581**** 8,084 2,152 830 240 270 817
---------------------------------------------------------------------------------------------------------------
U: Unavailable -: no reported cases
* Mortality data in this table are voluntarily reported from 122 cities in the United States, most of which have populations
of 100,000 or more. A death is reported by the place of its occurrence and by the week that the death certificate was
filed. Fetal deaths are not included.
** Pneumonia and influenza.
*** Because of changes in reporting methods in this Pennsylvania city, these numbers are partial counts for the current
week. Complete counts will be available in 4 to 6 weeks.
**** Total includes unknown ages.
===================================================================================================================================
Return to top. Disclaimer All MMWR HTML versions of articles are electronic conversions from ASCII text into HTML. This conversion may have resulted in character translation or format errors in the HTML version. Users should not rely on this HTML document, but are referred to the electronic PDF version and/or the original MMWR paper copy for the official text, figures, and tables. An original paper copy of this issue can be obtained from the Superintendent of Documents, U.S. Government Printing Office (GPO), Washington, DC 20402-9371; telephone: (202) 512-1800. Contact GPO for current prices. **Questions or messages regarding errors in formatting should be addressed to mmwrq@cdc.gov.Page converted: 04/29/99 |
|||||||||
This page last reviewed 5/2/01
|