 |
|
|
|
|
|
|
| ||||||||||
|
|
|
|
|
|
|
||||
| ||||||||||
|
|
|
|
|
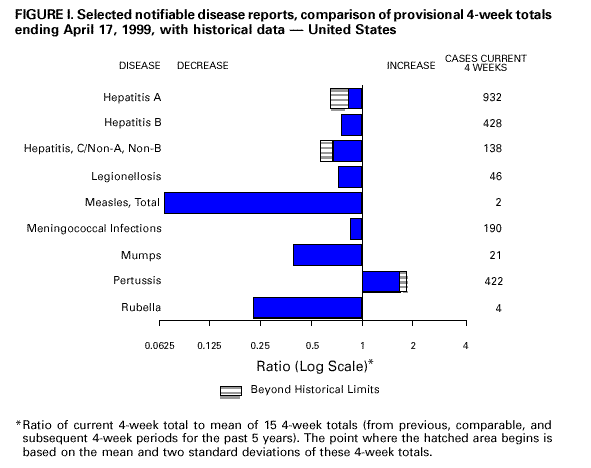
Persons using assistive technology might not be able to fully access information in this file. For assistance, please send e-mail to: mmwrq@cdc.gov. Type 508 Accommodation and the title of the report in the subject line of e-mail. Notifiable Diseases/Deaths in Selected Cities Weekly InformationFigure_I Selected notifiable disease reports, comparison of provisional 4-week totals ending April 17, 1999, with historical data -- United States Table_I Summary -- provisional cases of selected notifiable diseases, United States, cumulative, week ending April 17, 1999 (15th Week) Table_II Provisional cases of selected notifiable diseases, United States, weeks ending April 17, 1999 and April 18 1998 (15th Week) Table_III Provisional cases of selected notifiable diseases preventable by vaccination, United States, weeks ending April 17, 1999 and April 18 1998 (15th Week) Table_IV Deaths in 122 U.S. cities, week ending
April 17, 1999 (15th Week)
TABLE I. Summary -- provisional cases of specified notifiable diseases, United
States, cumulative, week ending April 17, 1999 (15th Week)
==================================================================================
                                             Cum. 1999
------------------------------------------------------
Anthrax                                              -
Brucellosis                                         13
Cholera                                              -
Congenital rubella syndrome                          1
Cryptosporidiosis*                                 323
Diphtheria                                           -
Encephalitis:  California*                           2
               eastern equine*                       -
               St. Louis*                            -
               western equine*                       -
Hansen Disease                                      15
Hantavirus pulmonary syndrome*+                      2
Hemolytic uremic syndrome, post-diarrheal*           6
HIV infection, pediatric*&                          37
Plague                                               -
Poliomyelitis, paralytic                             -
Psittacosis                                         10
Rabies, human                                        -
Rocky Mountain spotted fever (RMSF)                 36
Streptococcal disease, invasive Group A            598
Streptococcal toxic-shock syndrome*                 12
Syphilis, congenital@                               13
Tetanus                                              5
Toxic-shock syndrome                                31
Trichinosis                                          5
Typhoid fever                                       77
Yellow fever                                         -
------------------------------------------------------
-: no reported cases
 * Not notifiable in all states
 + Updated weekly from reports to the Division of Viral and Rickettsial
   Diseases, National Center for Infectious Diseases (NCID).
 & Updated monthly from reports to the Division of HIV/AIDS Prevention --
   Surveillance and Epidemiology, National Center for HIV, STD, and TB
   Prevention (NCHSTP), last update March 28, 1999.
 @ Updated from reports to the Division of STD Prevention, NCHSTP.

==================================================================================
Return to top. Table_II Note: To print large tables and graphs users may have to change their printer settings to landscape and use a small font size.
TABLE II. (page 1) Provisional cases of selected notifiable diseases, United States, weeks ending
April 17, 1999, and April 18 1998 (15th Week)
Escherichia
coli O157:H7
------------------- Hepatitis
AIDS Chlamydia NETSS** PHLIS*** Gonorrhea C/NA,NB
----------------- -------------------- -------- -------- ------------------- ----------------
Cum. Cum. Cum. Cum. Cum. Cum. Cum. Cum. Cum. Cum.
Reporting Area 1999* 1998 1999 1998 1999 1999 1999 1998 1999 1998
------------------------------------------------------------------------------------------------------------------------------
UNITED STATES 11,513 13,775 146,810 162,776 316 152 79,344 94,799 687 1,294
NEW ENGLAND 542 325 5,266 6,139 46 31 1,708 1,638 49 24
Maine 5 8 193 262 4 - 15 11 - -
N.H. 18 12 273 302 3 2 22 27 - -
Vt. 4 9 142 101 3 - 14 6 2 2
Mass. 367 94 2,603 2,535 22 16 796 609 46 22
R.I. 30 42 639 720 1 1 162 97 1 -
Conn. 118 160 1,416 2,219 13 12 699 888 - -
MID. ATLANTIC 2,841 4,064 21,431 20,340 19 1 10,877 11,246 47 109
Upstate N.Y. 360 539 N N 16 - 1,312 1,857 31 93
N.Y. City 1,441 2,403 10,822 10,465 - 1 4,720 4,587 - -
N.J. 600 637 2,966 3,323 3 - 1,319 1,999 - -
Pa. 440 485 7,642 6,552 N - 3,526 2,803 16 16
E.N. CENTRAL 841 1,118 21,938 23,659 49 30 14,605 18,095 137 145
Ohio 147 211 6,066 7,696 26 8 3,554 4,673 - 5
Ind. 124 257 - - 5 8 726 1,783 - 3
Ill. 402 373 8,066 6,669 7 3 5,567 5,432 3 18
Mich. 124 218 6,317 5,392 11 5 4,221 4,686 134 119
Wis. 44 59 1,489 3,902 N 6 537 1,521 - -
W.N. CENTRAL 248 231 4,971 10,465 79 21 1,704 4,768 40 9
Minn. 38 48 1,743 2,079 27 14 635 704 - -
Iowa 29 11 581 1,217 7 2 192 372 - 3
Mo. 97 100 - 3,761 8 4 - 2,480 38 4
N. Dak. 3 3 102 274 2 - 7 29 - -
S. Dak. 6 7 436 464 1 1 39 77 - -
Nebr. 19 24 795 890 27 - 329 347 - 2
Kans. 56 38 1,314 1,780 7 - 502 759 2 -
S. ATLANTIC 3,237 3,601 31,524 31,954 28 15 23,689 25,251 63 37
Del. 40 40 797 724 1 - 467 398 - -
Md. 345 482 2,344 2,394 1 - 2,337 2,676 19 3
D.C. 118 303 N N - - 743 1,007 - -
Va. 179 232 3,341 3,051 6 4 2,310 1,993 6 1
W. Va. 19 34 662 1,418 - 1 147 452 11 3
N.C. 198 217 6,477 6,497 7 6 5,670 5,406 - 7
S.C. 321 236 5,389 5,243 1 1 2,739 3,355 11 -
Ga. 349 374 4,327 7,180 2 - 3,463 5,738 1 8
Fla. 1,668 1,683 8,187 5,447 10 3 5,813 4,226 15 15
E.S. CENTRAL 493 480 12,120 11,469 22 7 9,864 10,781 68 37
Ky. 70 85 1,812 1,798 5 - 883 1,027 1 7
Tenn. 214 159 4,075 3,622 10 3 3,176 3,071 31 27
Ala. 110 119 3,562 2,990 4 3 3,238 3,794 1 3
Miss. 99 117 2,671 3,059 3 1 2,567 2,889 35 -
W.S. CENTRAL 1,182 1,837 16,354 23,766 10 7 9,825 14,215 73 237
Ark. 45 71 1,624 1,030 3 2 758 1,244 1 3
La. 121 257 4,994 3,392 3 3 4,096 2,931 61 -
Okla. 35 71 2,059 2,681 3 2 1,086 1,479 2 -
Tex. 981 1,438 7,677 16,663 1 - 3,885 8,561 9 234
MOUNTAIN 405 417 8,192 8,759 21 10 2,158 2,321 53 176
Mont. 4 12 380 330 - - 12 17 4 4
Idaho 5 12 501 534 1 1 26 48 4 73
Wyo. 2 1 230 206 1 1 9 11 17 40
Colo. 76 90 2,168 2,215 6 4 607 704 9 9
N. Mex. 13 52 1,172 1,117 1 - 209 201 4 26
Ariz. 190 127 2,467 3,010 7 3 928 1,025 12 -
Utah 37 44 481 660 5 1 54 70 1 12
Nev. 78 79 793 687 - - 313 245 2 12
PACIFIC 1,724 1,702 25,014 26,225 42 30 4,914 6,484 157 520
Wash. 90 133 3,524 3,154 6 14 636 551 3 5
Oreg. 45 40 1,567 - 14 10 220 - 4 8
Calif. 1,562 1,482 18,734 21,837 22 6 3,863 5,715 150 472
Alaska 6 11 582 589 - - 113 91 - 1
Hawaii 21 36 607 645 - - 82 127 - 34
Guam 1 - - 91 N - - 6 - -
P.R. 411 578 U U 3 U 97 115 - -
V.I. 10 13 N N N U U U U U
Amer. Samoa - - U U N U U U U U
C.N.M.I. - - N N N U - 9 - -
------------------------------------------------------------------------------------------------------------------------------
N: Not notifiable U: Unavailable -: no reported cases C.N.M.I.: Commonwealth of North Mariana Islands
* Updated monthly from reports to the Division of HIV/AIDS Prevention -- Surveillance and Epidemiology, National Center for HIV,
STD, and TB Prevention, last update March 28, 1999.
** National Electronic Telecommunications System for Surveillance.
*** Public Health Laboratory Information System.
=======================================================================================================================================================
TABLE II. (page 2) Provisional cases of selected notifiable diseases, United States, weeks ending
April 17, 1999, and April 18 1998 (15th Week)
Lyme Syphilis Rabies,
Legionellosis Disease Malaria (Primary & Secondary) Tuberculosis Animal
---------------- ---------------- ---------------- --------------------- ----------------- -------
Cum. Cum. Cum. Cum. Cum. Cum. Cum. Cum. Cum. Cum. Cum.
Reporting Area 1999 1998 1999 1998 1999 1998 1999 1998 1999 * 1998 * 1999
-------------------------------------------------------------------------------------------------------------------------------------------
UNITED STATES 229 340 1,028 1,213 273 327 1,672 2,070 1,312 2,153 1,390
NEW ENGLAND 15 20 155 252 3 14 21 22 95 97 236
Maine 2 1 - 2 - - - 1 3 3 39
N.H. 2 2 - 5 - 2 - 1 - 2 15
Vt. 3 1 - 2 - - 1 - - 1 44
Mass. 4 6 104 54 3 12 15 17 49 46 47
R.I. 1 4 8 18 - - 1 - 15 12 24
Conn. 3 6 43 171 - - 4 3 28 33 67
MID. ATLANTIC 67 77 649 782 72 100 77 84 479 515 286
Upstate N.Y. 20 19 213 379 21 24 7 7 67 63 181
N.Y. City 5 20 5 19 16 51 34 17 273 325 U
N.J. 5 3 117 98 24 14 11 28 139 127 66
Pa. 37 35 314 286 11 11 25 32 U U 39
E.N. CENTRAL 50 132 24 20 18 32 314 301 87 98 10
Ohio 22 44 17 14 4 2 25 51 U U 3
Ind. 5 25 5 4 4 1 32 46 U U -
Ill. 2 18 1 - 1 16 206 128 U U -
Mich. 20 20 1 2 7 11 49 52 65 70 7
Wis. 1 25 U U 2 2 2 24 22 28 -
W.N. CENTRAL 9 21 15 8 14 18 6 60 118 100 142
Minn. - 1 8 1 2 8 1 4 55 32 26
Iowa 6 4 2 6 3 3 1 - 2 - 30
Mo. 2 7 - - 8 6 - 45 48 45 6
N. Dak. - - 1 - - - - - 1 3 30
S. Dak. 1 - - - - - - - 3 4 25
Nebr. - 7 - - - - 1 4 4 1 1
Kans. - 2 4 1 1 1 3 7 5 15 24
S. ATLANTIC 33 39 118 109 74 65 595 791 203 402 519
Del. 2 6 1 2 - 1 1 7 - 7 3
Md. 5 9 90 92 23 25 129 220 U U 109
D.C. - 3 1 4 6 4 10 28 14 31 -
Va. 6 3 3 3 12 9 41 55 17 53 121
W. Va. N N 4 2 1 - 2 - 12 18 30
N.C. 5 4 15 1 6 7 154 223 93 207 119
S.C. 5 4 1 - - - 72 88 67 86 44
Ga. - - - 2 5 12 89 83 U U 46
Fla. 10 10 3 3 21 7 97 87 U U 47
E.S. CENTRAL 8 11 13 12 5 9 314 359 92 178 73
Ky. 2 5 - 2 - - 28 40 U U 13
Tenn. 5 3 5 5 3 4 160 178 U U 26
Ala. 1 1 6 5 2 3 85 76 86 107 34
Miss. - 2 2 - - 2 41 65 6 71 -
W.S. CENTRAL 1 3 - 3 8 8 248 266 54 577 25
Ark. - - - 2 - 1 26 45 28 25 -
La. 1 - - - 6 3 76 87 U U -
Okla. - - - - 1 1 61 13 26 32 25
Tex. - 3 - 1 1 3 85 121 - 520 -
MOUNTAIN 16 17 3 1 14 17 39 78 44 71 47
Mont. - 1 - - 2 - - - - 2 16
Idaho - - - - 1 1 - - - 3 -
Wyo. - 1 1 - - - - - - 1 18
Colo. 1 4 - - 5 5 - 4 U U 1
N. Mex. 1 2 1 - 2 6 - 7 18 18 -
Ariz. 1 2 - - 4 2 37 61 U U 12
Utah 7 6 1 - - 1 1 2 12 18 -
Nev. 6 1 - 1 - 2 1 4 14 29 -
PACIFIC 30 20 51 26 65 64 58 109 140 115 52
Wash. 5 2 - 1 3 2 16 6 80 56 -
Oreg. - - 1 1 7 6 - - U U -
Calif. 24 18 50 24 51 55 40 103 U U 48
Alaska 1 - - - - - 1 - 16 11 4
Hawaii - - - - 4 1 1 - 44 48 -
Guam - 1 - - - 1 - - - 37 -
P.R. - - - - - - 62 65 - 30 24
V.I. U U U U U U U U U U U
Amer. Samoa U U U U U U U U U U U
C.N.M.I. - - - - - - - 66 - 45 -
-------------------------------------------------------------------------------------------------------------------------------------------
N: Not notifiable U: Unavailable -: no reported cases
* Cumulative reports of provisional tuberculosis cases for 1998 and 1999 are unavailable ('U') for some areas using the Tuberculosis
Information Management System (TIMS).
=======================================================================================================================================================
Return to top. Table_III Note: To print large tables and graphs users may have to change their printer settings to landscape and use a small font size.
TABLE III. (page 1) Provisional cases of selected notifiable diseases preventable by vaccination, United
States, weeks ending April 17, 1999, and April 18 1998 (15th Week)
Hepatitis (Viral), by type Measles (Rubeola)
H. influenzae, --------------------------------------- ------------------------------------------------------------
invasive A B Indigenous Imported** Total
---------------- ----------------- ----------------- --------------- --------------- ---------------
Cum. Cum. Cum. Cum. Cum. Cum. Cum. Cum. Cum. Cum.
Reporting Area 1999* 1998 1999 1998 1999 1998 1999 1999 1999 1999 1999 1998
-----------------------------------------------------------------------------------------------------------------------------------------------------
UNITED STATES 342 362 4,310 6,270 1,669 2,457 1 16 - 6 22 16
NEW ENGLAND 24 26 48 102 31 43 - - - 1 1 1
Maine 2 2 2 10 - - - - - - - -
N.H. 4 1 6 6 4 5 - - - 1 1 -
Vt. 3 2 3 6 1 - - - - - - -
Mass. 11 19 11 29 17 23 - - - - - 1
R.I. - 2 6 7 9 4 - - - - - -
Conn. 4 - 20 44 - 11 - - - - - -
MID. ATLANTIC 44 51 273 483 222 371 - - - - - 5
Upstate N.Y. 25 17 74 106 53 90 - - - - - -
N.Y. City 5 15 47 174 55 100 - - - - - -
N.J. 14 17 42 88 33 70 - - - - - 4
Pa. - 2 110 115 81 111 - - - - - 1
E.N. CENTRAL 37 56 1,001 910 133 487 - - - - - 2
Ohio 22 25 245 113 29 24 - - - - - -
Ind. 1 9 29 89 4 225 - - - - - 1
Ill. 10 21 140 239 - 77 - - - - - -
Mich. 4 - 575 385 100 134 - - - - - 1
Wis. - 1 12 84 - 27 - - - - - -
W.N. CENTRAL 36 20 223 559 92 111 - - - - - -
Minn. 11 10 18 22 13 10 - - - - - -
Iowa 8 1 43 251 16 16 - - - - - -
Mo. 11 5 126 226 53 70 - - - - - -
N. Dak. - - - 2 - 1 U - U - - -
S. Dak. 1 - 8 3 - 1 - - - - - -
Nebr. 3 - 15 14 6 4 - - - - - -
Kans. 2 4 13 41 4 9 - - - - - -
S. ATLANTIC 85 65 520 481 314 262 - - - 1 1 5
Del. - - 1 1 - - - - - - - -
Md. 23 17 101 117 51 52 - - - - - 1
D.C. 2 - 22 19 7 4 - - - - - -
Va. 8 10 38 82 26 30 - - - - - 2
W. Va. 1 2 5 - 7 2 - - - - - -
N.C. 13 9 42 28 67 68 - - - - - -
S.C. 2 1 6 11 32 - - - - - - -
Ga. 20 17 140 109 36 57 - - - - - 1
Fla. 16 9 165 114 88 49 - - - 1 1 1
E.S. CENTRAL 28 22 134 137 118 138 - - - - - -
Ky. 2 5 6 7 7 11 U - U - - -
Tenn. 14 11 76 77 59 102 - - - - - -
Ala. 10 5 27 31 28 25 - - - - - -
Miss. 2 1 25 22 24 - - - - - - -
W.S. CENTRAL 21 19 450 851 136 281 1 1 - 2 3 -
Ark. 1 - 12 14 11 27 - - - - - -
La. 4 7 19 8 38 10 - - - - - -
Okla. 14 10 135 147 36 16 - - - - - -
Tex. 2 2 284 682 51 228 1 1 - 2 3 -
MOUNTAIN 36 62 450 989 154 238 - 1 - - 1 -
Mont. 1 - 5 10 7 2 - - - - - -
Idaho 1 - 17 67 7 10 - - - - - -
Wyo. 1 - 2 13 1 2 - - - - - -
Colo. 2 12 89 77 31 32 - 1 - - 1 -
N. Mex. 10 2 14 54 50 96 - - - - - -
Ariz. 18 31 259 633 30 54 - - - - - -
Utah 3 3 21 59 9 19 - - - - - -
Nev. - 14 43 76 19 23 - - - - - -
PACIFIC 31 41 1,211 1,758 469 526 - 14 - 2 16 3
Wash. - 1 83 272 14 38 - - - - - -
Oreg. 13 19 75 139 24 61 - 8 - - 8 -
Calif. 16 18 1,050 1,322 420 418 - 6 - 2 8 3
Alaska 2 1 2 3 7 3 - - - - - -
Hawaii - 2 1 22 4 6 - - - - - -
Guam - - - - - - U - U - - -
P.R. - 1 26 13 32 166 - - - - - -
V.I. U U U U U U U U U U U U
Amer. Samoa U U U U U U U U U U U U
C.N.M.I. - - - - - 26 U - U - - -
-----------------------------------------------------------------------------------------------------------------------------------------------------
N: Not notifiable U: Unavailable -: no reported cases
* Of 70 cases among children aged <5 years, serotype was reported for 30 and of those, 4 were type b.
** For imported measles, cases include only those resulting from importation from other countries.
=======================================================================================================================================================
TABLE III. (page 2) Provisional cases of selected notifiable diseases preventable by vaccination, United
States, weeks ending April 17, 1999, and April 18 1998 (15th Week)
Meningococcal
Disease Mumps Pertussis Rubella
----------------- -------------------------- --------------------------- ---------------------------
Cum. Cum. Cum. Cum. Cum. Cum. Cum. Cum.
Reporting Area 1999 1998 1999 1999 1998 1999 1999 1998 1999 1999 1998
------------------------------------------------------------------------------------------------------------------------------------------
UNITED STATES 775 978 3 103 294 123 1,426 1,238 1 13 160
NEW ENGLAND 40 50 - 1 - - 126 242 - 3 25
Maine 3 4 - - - - - 5 - - -
N.H. - 1 - 1 - - 19 20 - - -
Vt. 3 1 - - - - 10 25 - - -
Mass. 27 22 - - - - 90 187 - 3 3
R.I. 2 3 - - - - 2 - - - -
Conn. 5 19 - - - - 5 5 - - 22
MID. ATLANTIC 74 104 - 15 159 57 360 150 - 1 87
Upstate N.Y. 18 25 - 2 3 57 317 81 - 1 80
N.Y. City 18 11 - 3 152 - 10 6 - - 3
N.J. 16 28 - - 1 - - 6 - - 4
Pa. 22 40 - 10 3 - 33 57 - - -
E.N. CENTRAL 103 149 - 12 22 - 107 147 - - -
Ohio 52 53 - 6 10 - 89 44 - - -
Ind. 7 26 - - 2 - 2 40 - - -
Ill. 29 38 - - 1 - - 8 - - -
Mich. 15 15 - 6 9 - 16 17 - - -
Wis. - 17 - - - - - 38 - - -
W.N. CENTRAL 100 82 - 3 18 1 19 94 - - 2
Minn. 25 8 - - 9 - - 55 - - -
Iowa 22 12 - 2 6 - 7 16 - - -
Mo. 35 38 - 1 2 - 9 9 - - 1
N. Dak. - - U - 1 U - - U - -
S. Dak. 6 5 - - - - 2 4 - - -
Nebr. 4 4 - - - 1 1 4 - - -
Kans. 8 15 - - - - - 6 - - 1
S. ATLANTIC 133 142 1 20 15 2 82 84 - 2 1
Del. 2 1 - - - - - - - - -
Md. 21 17 - 3 - - 26 17 - 1 -
D.C. 1 - - 1 - - - - - - -
Va. 16 16 - 2 4 - 7 6 - - -
W. Va. 1 4 - - - 1 1 1 - - -
N.C. 16 23 - 4 6 - 22 38 - 1 1
S.C. 17 23 - 2 3 - 7 7 - - -
Ga. 21 34 - - - - 7 - - - -
Fla. 38 24 1 8 2 1 12 15 - - -
E.S. CENTRAL 62 79 - 1 1 4 28 32 - - -
Ky. 10 13 U - - U 1 16 U - -
Tenn. 22 30 - - - 4 20 6 - - -
Ala. 18 24 - 1 1 - 4 10 - - -
Miss. 12 12 - - - - 3 - - - -
W.S. CENTRAL 45 84 1 13 22 5 40 61 - 5 34
Ark. 12 13 - - - - 5 6 - - -
La. 22 16 1 1 - 3 3 - - - -
Okla. 9 19 - 1 - - 2 6 - - -
Tex. 2 36 - 11 22 2 30 49 - 5 34
MOUNTAIN 62 62 - 7 12 7 176 217 1 1 5
Mont. - 2 - - - - 1 1 - - -
Idaho 7 3 - - - 1 85 74 - - -
Wyo. 2 3 - - 1 - 2 7 - - -
Colo. 19 14 - 2 1 3 30 47 - - -
N. Mex. 7 10 N N N 1 13 48 - - 1
Ariz. 19 22 - - 4 1 21 23 1 1 1
Utah 4 6 - 4 1 1 22 11 - - 2
Nev. 4 2 - 1 5 - 2 6 - - 1
PACIFIC 156 226 1 31 45 47 488 211 - 1 6
Wash. 19 24 - - 4 46 271 78 - - 4
Oreg. 25 40 N N N - 8 14 - - -
Calif. 105 158 1 27 28 1 205 116 - 1 1
Alaska 3 1 - 1 2 - 2 - - - -
Hawaii 4 3 - 3 11 - 2 3 - - 1
Guam - - U - 2 U - - U - -
P.R. 2 2 - - 1 - - 2 - - -
V.I. U U U U U U U U U U U
Amer. Samoa U U U U U U U U U U U
C.N.M.I. - - U - 2 U - 1 U - -
------------------------------------------------------------------------------------------------------------------------------------------
N: Not notifiable U: Unavailable -: no reported cases
=======================================================================================================================================================
Return to top. Table_IV Note: To print large tables and graphs users may have to change their printer settings to landscape and use a small font size.
TABLE IV. Deaths in 122 U.S. cities,* week ending
April 17, 1999 (15th Week)
===================================================================================================================================
All Causes, By Age (Years)
------------------------------------------------------------------------ P&I**
Reporting Area All Ages >=65 45-64 25-44 1-24 <1 Total
---------------------------------------------------------------------------------------------------------------
NEW ENGLAND 620 460 103 30 16 11 55
Boston, Mass. 160 112 25 13 6 4 17
Bridgeport, Conn. 47 35 10 2 - - 4
Cambridge, Mass. 17 13 2 1 1 - 2
Fall River, Mass. 29 23 2 3 1 - 2
Hartford, Conn. 65 39 13 6 4 3 7
Lowell, Mass. 23 17 6 - - - 3
Lynn, Mass. 14 11 2 - 1 - 1
New Bedford, Mass. 26 20 5 1 - - -
New Haven, Conn. 40 25 11 2 1 1 2
Providence, R.I. 60 46 10 2 1 1 -
Somerville, Mass. 3 3 - - - - 1
Springfield, Mass. 42 33 7 - - 2 4
Waterbury, Conn. 34 31 2 - 1 - 3
Worcester, Mass. 60 52 8 - - - 9
MID. ATLANTIC 2,194 1,565 406 149 34 40 115
Albany, N.Y. 44 32 9 2 - 1 4
Allentown, Pa. 21 19 2 - - - 2
Buffalo, N.Y. 62 43 9 6 - 4 5
Camden, N.J. 25 15 6 4 - - 4
Elizabeth, N.J. U U U U U U U
Erie, Pa. 55 40 10 3 2 - 8
Jersey City, N.J. 45 31 9 3 2 - -
New York City, N.Y. 1,168 819 221 90 17 21 30
Newark, N.J. U U U U U U U
Paterson, N.J. 18 10 6 2 - - -
Philadelphia, Pa. 304 215 65 14 8 2 22
Pittsburgh, Pa.*** 64 39 14 4 2 5 7
Reading, Pa. 31 21 7 2 1 - 1
Rochester, N.Y. 82 64 7 6 1 4 15
Schenectady, N.Y. 29 27 - 2 - - 2
Scranton, Pa. 38 33 3 1 - 1 1
Syracuse, N.Y. 145 109 27 7 1 1 12
Trenton, N.J. 42 28 10 3 - 1 2
Utica, N.Y. 21 20 1 - - - -
Yonkers, N.Y. U U U U U U U
E.N. CENTRAL 2,555 1,797 479 161 55 61 215
Akron, Ohio 49 38 9 - - 2 1
Canton, Ohio 33 23 5 3 1 1 4
Chicago, Ill. 506 332 110 39 16 7 58
Cincinnati, Ohio 118 81 19 7 2 9 15
Cleveland, Ohio 170 114 27 11 6 12 -
Columbus, Ohio 246 179 40 16 3 8 24
Dayton, Ohio 151 115 28 5 2 1 21
Detroit, Mich. 207 120 54 26 5 2 5
Evansville, Ind. 77 61 11 3 2 - 2
Fort Wayne, Ind. 70 53 12 3 - 2 6
Gary, Ind. 22 13 7 2 - - 3
Grand Rapids, Mich. 74 57 14 2 1 - 13
Indianapolis, Ind. 280 190 56 18 7 9 22
Lansing, Mich. 58 46 10 1 1 - 8
Milwaukee, Wis. 133 98 22 10 1 2 9
Peoria, Ill. 61 41 14 3 1 2 5
Rockford, Ill. 51 38 5 5 2 1 6
South Bend, Ind. 54 43 8 3 - - 6
Toledo, Ohio 122 91 23 2 4 2 4
Youngstown, Ohio 73 64 5 2 1 1 3
W.N. CENTRAL 657 487 98 43 12 16 49
Des Moines, Iowa 35 32 3 - - - 6
Duluth, Minn. 38 28 8 1 1 - 4
Kansas City, Kans. U U U U U U U
Kansas City, Mo. 110 71 24 9 4 2 4
Lincoln, Nebr. 32 22 4 6 - - 3
Minneapolis, Minn. 153 126 14 7 3 3 20
Omaha, Nebr. 97 72 17 5 1 2 7
St. Louis, Mo. 95 62 17 7 2 7 -
St. Paul, Minn. 97 74 11 8 1 2 5
Wichita, Kans. U U U U U U U
S. ATLANTIC 1,219 785 248 117 36 29 91
Atlanta, Ga. U U U U U U U
Baltimore, Md. 254 140 58 32 10 11 17
Charlotte, N.C. 128 80 26 15 5 2 10
Jacksonville, Fla. 134 85 31 12 2 4 4
Miami, Fla. 107 63 22 17 2 3 -
Norfolk, Va. 59 39 9 5 4 2 5
Richmond, Va. 90 66 13 6 4 1 3
Savannah, Ga. 63 43 14 4 1 1 10
St. Petersburg, Fla. 65 49 12 4 - - 9
Tampa, Fla. 219 165 38 9 2 4 28
Washington, D.C. 100 55 25 13 6 1 5
Wilmington, Del. U U U U U U U
E.S. CENTRAL 1,044 739 200 59 33 10 93
Birmingham, Ala. 215 160 36 9 5 3 23
Chattanooga, Tenn. 119 85 24 5 5 - 11
Knoxville, Tenn. 78 59 16 2 1 - 1
Lexington, Ky. 83 60 11 5 3 3 13
Memphis, Tenn. 224 153 46 15 9 1 22
Mobile, Ala. 95 63 15 11 6 - 2
Montgomery, Ala. 63 42 19 1 - 1 18
Nashville, Tenn. 167 117 33 11 4 2 3
W.S. CENTRAL 1,626 1,075 278 145 78 50 129
Austin, Tex. 85 56 13 12 2 2 7
Baton Rouge, La. 67 51 8 6 1 1 10
Corpus Christi, Tex. 46 33 6 4 - 3 5
Dallas, Tex. 251 169 52 17 6 7 10
El Paso, Tex. 86 72 4 6 3 1 2
Ft. Worth, Tex. 119 83 21 10 4 1 15
Houston, Tex. 414 267 90 31 20 6 35
Little Rock, Ark. 89 61 15 9 - 4 5
New Orleans, La. 145 58 11 26 34 16 16
San Antonio, Tex. 213 149 40 15 4 5 14
Shreveport, La. U U U U U U U
Tulsa, Okla. 111 76 18 9 4 4 10
MOUNTAIN 927 667 176 49 21 14 81
Albuquerque, N.M. 115 84 21 3 3 4 4
Boise, Idaho 38 25 6 3 3 1 2
Colo. Springs, Colo. 57 47 4 3 2 1 7
Denver, Colo. 115 79 25 5 5 1 13
Las Vegas, Nev. 251 173 59 16 2 1 14
Ogden, Utah 23 17 3 2 1 - 5
Phoenix, Ariz. 29 22 3 1 2 1 3
Pueblo, Colo. 16 14 1 1 - - -
Salt Lake City, Utah 130 91 25 8 3 3 23
Tucson, Ariz. 153 115 29 7 - 2 10
PACIFIC 2,003 1,413 357 149 40 40 194
Berkeley, Calif. 16 13 2 - - 1 1
Fresno, Calif. 153 111 31 9 1 1 15
Glendale, Calif. 25 19 1 3 2 - 2
Honolulu, Hawaii 85 64 16 3 1 1 10
Long Beach, Calif. 75 53 13 6 1 1 14
Los Angeles, Calif. 411 285 73 32 6 15 24
Pasadena, Calif. 10 6 2 1 - 1 1
Portland, Oreg. 182 129 30 15 6 2 13
Sacramento, Calif. 193 128 45 13 6 1 34
San Diego, Calif. 174 112 30 18 7 5 20
San Francisco, Calif. 146 104 21 17 - 3 16
San Jose, Calif. 203 147 36 12 4 4 25
Santa Cruz, Calif. 29 23 5 1 - - 2
Seattle, Wash. 134 78 35 12 5 4 1
Spokane, Wash. 55 50 3 1 - 1 7
Tacoma, Wash. 112 91 14 6 1 - 9
TOTAL 12,845**** 8,988 2,345 902 325 271 1,022
---------------------------------------------------------------------------------------------------------------
U: Unavailable -: no reported cases
* Mortality data in this table are voluntarily reported from 122 cities in the United States, most of which have populations
of 100,000 or more. A death is reported by the place of its occurrence and by the week that the death certificate was
filed. Fetal deaths are not included.
** Pneumonia and influenza.
*** Because of changes in reporting methods in this Pennsylvania city, these numbers are partial counts for the current
week. Complete counts will be available in 4 to 6 weeks.
**** Total includes unknown ages.
===================================================================================================================================
Return to top. Disclaimer All MMWR HTML versions of articles are electronic conversions from ASCII text into HTML. This conversion may have resulted in character translation or format errors in the HTML version. Users should not rely on this HTML document, but are referred to the electronic PDF version and/or the original MMWR paper copy for the official text, figures, and tables. An original paper copy of this issue can be obtained from the Superintendent of Documents, U.S. Government Printing Office (GPO), Washington, DC 20402-9371; telephone: (202) 512-1800. Contact GPO for current prices. **Questions or messages regarding errors in formatting should be addressed to mmwrq@cdc.gov.Page converted: 04/22/99 |
|||||||||
This page last reviewed 5/2/01
|
 ">
">