 |
|
|
|
|
|
|
| ||||||||||
|
|
|
|
|
|
|
||||
| ||||||||||
|
|
|
|
|
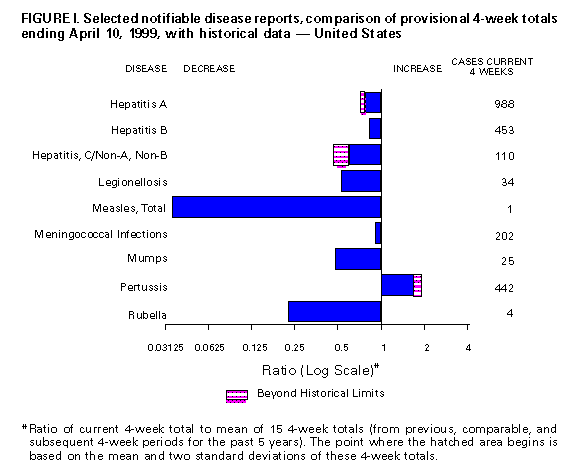
Persons using assistive technology might not be able to fully access information in this file. For assistance, please send e-mail to: mmwrq@cdc.gov. Type 508 Accommodation and the title of the report in the subject line of e-mail. Notifiable Diseases/Deaths in Selected Cities Weekly InformationFigure_I Selected notifiable disease reports, comparison of provisional 4-week totals ending April 10, 1999, with historical data -- United States Table_I Summary -- provisional cases of selected notifiable diseases, United States, cumulative, week ending April 10, 1999 (14th Week) Table_II Provisional cases of selected notifiable diseases, United States, weeks ending April 10, 1999 and April 11, 1998 (14th Week) Table_III Provisional cases of selected notifiable diseases preventable by vaccination, United States, weeks ending April 10, 1999 and April 11, 1998 (14th Week) Table_IV Deaths in 122 U.S. cities, week ending
April 10, 1999 (14th Week)
TABLE I. Summary -- provisional cases of specified notifiable diseases, United
States, cumulative, week ending April 10, 1999 (14th Week)
==================================================================================
                                             Cum. 1999
------------------------------------------------------
Anthrax                                              -
Brucellosis                                         12
Cholera                                              -
Congenital rubella syndrome                          1
Cryptosporidiosis*                                 304
Diphtheria                                           -
Encephalitis:  California*                           1
               eastern equine*                       -
               St. Louis*                            -
               western equine*                       -
Hansen Disease                                      15
Hantavirus pulmonary syndrome*+                      2
Hemolytic uremic syndrome, post-diarrheal*           6
HIV infection, pediatric*&                          37
Plague                                               -
Poliomyelitis, paralytic                             -
Psittacosis                                          9
Rabies, human                                        -
Rocky Mountain spotted fever (RMSF)                 34
Streptococcal disease, invasive Group A            549
Streptococcal toxic-shock syndrome*                 11
Syphilis, congenital@                               13
Tetanus                                              5
Toxic-shock syndrome                                29
Trichinosis                                          3
Typhoid fever                                       71
Yellow fever                                         -
------------------------------------------------------
-: no reported cases
 * Not notifiable in all states
 + Updated weekly from reports to the Division of Viral and Rickettsial
   Diseases, National Center for Infectious Diseases (NCID).
 & Updated monthly from reports to the Division of HIV/AIDS Prevention --
   Surveillance and Epidemiology, National Center for HIV, STD, and TB
   Prevention (NCHSTP), last update March 28, 1999.
 @ Updated from reports to the Division of STD Prevention, NCHSTP.

==================================================================================
Return to top. Table_II Note: To print large tables and graphs users may have to change their printer settings to landscape and use a small font size.
TABLE II. (page 1) Provisional cases of selected notifiable diseases, United States, weeks ending
April 10, 1999, and April 11, 1998 (14th Week)
Escherichia
coli O157:H7
------------------- Hepatitis
AIDS Chlamydia NETSS** PHLIS*** Gonorrhea C/NA,NB
----------------- -------------------- -------- -------- ------------------- ----------------
Cum. Cum. Cum. Cum. Cum. Cum. Cum. Cum. Cum. Cum.
Reporting Area 1999* 1998 1999 1998 1999 1999 1999 1998 1999 1998
------------------------------------------------------------------------------------------------------------------------------
UNITED STATES 11,513 11,980 136,677 150,349 289 131 74,445 88,345 603 1,199
NEW ENGLAND 542 314 5,105 5,751 43 30 1,669 1,544 47 23
Maine 5 8 193 244 4 - 15 11 - -
N.H. 18 12 263 280 3 1 19 27 - -
Vt. 4 8 132 92 3 - 14 2 1 2
Mass. 367 92 2,505 2,365 19 16 774 569 46 21
R.I. 30 34 596 662 1 1 148 88 - -
Conn. 118 160 1,416 2,108 13 12 699 847 - -
MID. ATLANTIC 2,841 3,417 19,593 18,394 15 1 9,870 10,320 45 106
Upstate N.Y. 360 426 N N 12 - 965 1,713 29 90
N.Y. City 1,441 1,933 10,053 9,754 - 1 4,495 4,324 - -
N.J. 600 574 2,716 3,136 3 - 1,211 1,867 - -
Pa. 440 484 6,823 5,504 N - 3,199 2,416 16 16
E.N. CENTRAL 841 993 20,262 22,484 46 28 13,819 16,941 129 133
Ohio 147 173 5,998 7,181 24 8 3,528 4,321 - 5
Ind. 124 257 - - 5 7 726 1,668 - 3
Ill. 402 373 7,540 6,248 6 3 5,182 5,230 3 16
Mich. 124 144 5,418 5,392 11 4 3,886 4,294 126 109
Wis. 44 46 1,306 3,663 N 6 497 1,428 - -
W.N. CENTRAL 248 207 4,560 9,656 73 17 1,558 4,363 32 27
Minn. 38 31 1,572 1,919 24 12 587 643 - -
Iowa 29 11 551 1,088 7 2 179 306 - 3
Mo. 97 100 - 3,523 6 2 - 2,291 30 22
N. Dak. 3 3 102 267 2 - 7 29 - -
S. Dak. 6 7 436 440 1 1 39 73 - -
Nebr. 19 24 714 806 26 - 295 320 - 2
Kans. 56 31 1,185 1,613 7 - 451 701 2 -
S. ATLANTIC 3,237 3,186 29,462 30,089 28 10 22,080 23,867 61 37
Del. 40 40 797 664 1 - 467 380 - -
Md. 345 335 2,189 2,252 1 - 2,255 2,489 19 3
D.C. 118 262 N N - - 742 958 - -
Va. 179 230 3,341 3,044 6 2 2,310 1,980 6 1
W. Va. 19 30 630 1,311 - 1 144 433 9 3
N.C. 198 216 5,687 6,162 7 3 5,028 5,179 - 7
S.C. 321 183 5,284 4,876 1 1 2,682 3,142 10 -
Ga. 349 372 4,157 6,715 2 - 3,142 5,331 1 8
Fla. 1,668 1,518 7,377 5,065 10 3 5,310 3,975 16 15
E.S. CENTRAL 493 442 11,883 10,611 18 7 9,615 10,055 33 35
Ky. 70 65 1,812 1,692 5 - 883 987 1 7
Tenn. 214 141 3,854 3,460 9 3 2,976 2,919 31 25
Ala. 110 119 3,546 2,789 4 3 3,189 3,542 1 3
Miss. 99 117 2,671 2,670 - 1 2,567 2,607 - -
W.S. CENTRAL 1,182 1,356 15,982 22,120 9 6 9,563 13,362 50 168
Ark. 45 52 1,522 1,005 2 2 711 1,161 1 2
La. 121 206 4,724 3,392 3 2 3,881 2,931 38 -
Okla. 35 71 2,059 2,425 3 2 1,086 1,348 2 -
Tex. 981 1,027 7,677 15,298 1 - 3,885 7,922 9 166
MOUNTAIN 405 377 7,501 8,079 17 8 1,981 2,176 50 164
Mont. 4 10 309 256 - - 8 15 4 4
Idaho 5 8 459 510 - 1 26 47 4 66
Wyo. 2 1 180 197 1 1 7 11 14 40
Colo. 76 65 2,063 2,055 5 2 545 684 9 9
N. Mex. 13 52 1,126 1,095 1 - 198 192 4 23
Ariz. 190 127 2,168 2,775 5 3 843 953 12 -
Utah 37 35 428 615 5 1 46 67 1 11
Nev. 78 79 768 576 - - 308 207 2 11
PACIFIC 1,724 1,688 22,329 23,165 40 24 4,290 5,717 156 506
Wash. 90 133 3,294 2,984 5 8 564 509 2 5
Oreg. 45 40 1,383 - 14 10 195 - 4 7
Calif. 1,562 1,481 16,493 19,036 21 6 3,344 5,003 150 459
Alaska 6 11 552 558 - - 105 85 - 1
Hawaii 21 23 607 587 - - 82 120 - 34
Guam 1 - - 81 N - - 6 - -
P.R. 411 457 U U 3 U 83 106 - -
V.I. 10 13 N N N U U U U U
Amer. Samoa - - U U N U U U U U
C.N.M.I. - - N N N U - 9 - -
------------------------------------------------------------------------------------------------------------------------------
N: Not notifiable U: Unavailable -: no reported cases C.N.M.I.: Commonwealth of North Mariana Islands
* Updated monthly from reports to the Division of HIV/AIDS Prevention -- Surveillance and Epidemiology, National Center for HIV,
STD, and TB Prevention, last update March 28, 1999.
** National Electronic Telecommunications System for Surveillance.
*** Public Health Laboratory Information System.
=======================================================================================================================================================
TABLE II. (page 2) Provisional cases of selected notifiable diseases, United States, weeks ending
April 10, 1999, and April 11, 1998 (14th Week)
Lyme Syphilis Rabies,
Legionellosis Disease Malaria (Primary & Secondary) Tuberculosis Animal
---------------- ---------------- ---------------- --------------------- ----------------- -------
Cum. Cum. Cum. Cum. Cum. Cum. Cum. Cum. Cum. Cum. Cum.
Reporting Area 1999 1998 1999 1998 1999 1998 1999 1998 1999 * 1998 * 1999
-------------------------------------------------------------------------------------------------------------------------------------------
UNITED STATES 210 320 948 1,091 261 305 1,544 1,942 1,206 1,972 1,279
NEW ENGLAND 14 19 149 219 3 13 19 21 95 88 222
Maine 2 1 - 2 - - - 1 3 3 39
N.H. 2 2 - 5 - 1 - 1 - 2 15
Vt. 3 1 - 2 - - 1 - - 1 43
Mass. 3 6 98 49 3 12 13 17 49 43 45
R.I. 1 4 8 16 - - 1 - 15 12 20
Conn. 3 5 43 145 - - 4 2 28 27 60
MID. ATLANTIC 61 71 588 694 71 96 69 78 457 469 279
Upstate N.Y. 16 16 212 326 21 23 5 7 56 62 181
N.Y. City 5 19 4 18 16 50 30 16 273 291 U
N.J. 5 3 97 83 24 14 11 25 128 116 60
Pa. 35 33 275 267 10 9 23 30 U U 38
E.N. CENTRAL 47 128 22 19 17 26 279 273 66 77 9
Ohio 19 43 15 14 4 1 25 51 U U 2
Ind. 5 25 5 4 4 1 32 41 U U -
Ill. 2 17 1 - - 14 193 120 U U -
Mich. 20 18 1 1 7 8 27 38 48 49 7
Wis. 1 25 U U 2 2 2 23 18 28 -
W.N. CENTRAL 8 19 14 9 13 17 6 53 111 92 135
Minn. - 1 7 1 2 8 1 3 49 29 26
Iowa 6 3 2 6 3 2 1 - 2 - 25
Mo. 1 7 - 1 7 6 - 39 47 44 5
N. Dak. - - 1 - - - - - 1 1 30
S. Dak. 1 - - - - - - - 3 4 25
Nebr. - 7 - - - - 1 4 4 - 1
Kans. - 1 4 1 1 1 3 7 5 14 23
S. ATLANTIC 33 37 112 108 71 60 558 753 185 376 462
Del. 2 6 - 2 - 1 1 7 - 5 3
Md. 5 8 87 91 20 24 123 209 U U 99
D.C. - 3 1 4 6 3 10 26 12 30 -
Va. 6 3 3 3 12 7 41 52 17 53 98
W. Va. N N 2 2 1 - 2 - 11 17 24
N.C. 5 4 15 1 6 7 142 218 89 191 108
S.C. 5 4 1 - - - 68 85 56 80 43
Ga. - - - 2 5 12 82 73 U U 46
Fla. 10 9 3 3 21 6 89 83 U U 41
E.S. CENTRAL 8 11 13 12 3 9 291 335 89 167 64
Ky. 2 5 - 2 - - 28 38 U U 13
Tenn. 5 3 5 5 2 4 144 163 U U 23
Ala. 1 1 6 5 1 3 78 73 83 105 28
Miss. - 2 2 - - 2 41 61 6 62 -
W.S. CENTRAL 1 2 - 3 8 5 238 251 53 530 23
Ark. - - - 2 - 1 25 38 28 22 -
La. 1 - - - 6 3 67 87 U U -
Okla. - - - - 1 - 61 13 25 31 23
Tex. - 2 - 1 1 1 85 113 - 477 -
MOUNTAIN 14 15 3 1 13 17 35 74 38 66 36
Mont. - 1 - - 2 - - - - 2 16
Idaho - - - - 1 1 - - - 2 -
Wyo. - 1 1 - - - - - - 1 8
Colo. 1 4 - - 4 5 - 4 U U 1
N. Mex. 1 1 1 - 2 6 - 7 13 15 -
Ariz. 1 1 - - 4 2 33 57 U U 11
Utah 5 6 1 - - 1 1 2 11 17 -
Nev. 6 1 - 1 - 2 1 4 14 29 -
PACIFIC 24 18 47 26 62 62 49 104 112 107 49
Wash. 4 1 - 1 3 1 11 4 58 51 -
Oreg. - - 1 1 7 6 - - U U -
Calif. 20 17 46 24 48 54 36 100 U U 46
Alaska - - - - - - 1 - 12 11 3
Hawaii - - - - 4 1 1 - 42 45 -
Guam - 1 - - - 1 - - - 37 -
P.R. - - - - - - 59 61 - 30 21
V.I. U U U U U U U U U U U
Amer. Samoa U U U U U U U U U U U
C.N.M.I. - - - - - - - 62 - 40 -
-------------------------------------------------------------------------------------------------------------------------------------------
N: Not notifiable U: Unavailable -: no reported cases
* Cumulative reports of provisional tuberculosis cases for 1998 and 1999 are unavailable ('U') for some areas using the Tuberculosis
Information Management System (TIMS).
=======================================================================================================================================================
Return to top. Table_III Note: To print large tables and graphs users may have to change their printer settings to landscape and use a small font size.
TABLE III. (page 1) Provisional cases of selected notifiable diseases preventable by vaccination, United
States, weeks ending April 10, 1999, and April 11, 1998 (14th Week)
Hepatitis (Viral), by type Measles (Rubeola)
H. influenzae, --------------------------------------- ------------------------------------------------------------
invasive A B Indigenous Imported** Total
---------------- ----------------- ----------------- --------------- --------------- ---------------
Cum. Cum. Cum. Cum. Cum. Cum. Cum. Cum. Cum. Cum.
Reporting Area 1999* 1998 1999 1998 1999 1998 1999 1999 1999 1999 1999 1998
-----------------------------------------------------------------------------------------------------------------------------------------------------
UNITED STATES 316 324 4,087 5,526 1,535 2,238 - 14 1 6 20 13
NEW ENGLAND 24 22 43 97 28 35 - - - 1 1 1
Maine 2 2 2 10 - - - - - - - -
N.H. 4 1 6 6 4 4 - - - 1 1 -
Vt. 3 2 2 6 1 - - - - - - -
Mass. 11 17 11 26 17 19 - - - - - 1
R.I. - - 2 6 6 1 - - - - - -
Conn. 4 - 20 43 - 11 - - - - - -
MID. ATLANTIC 40 45 255 442 198 339 - - - - - 3
Upstate N.Y. 24 17 70 94 51 83 - - - - - -
N.Y. City 4 13 43 164 42 93 - - - - - -
N.J. 12 14 36 81 27 61 - - - - - 2
Pa. - 1 106 103 78 102 - - - - - 1
E.N. CENTRAL 34 48 959 862 131 469 - - - - - 1
Ohio 21 22 233 105 29 22 - - - - - -
Ind. 1 5 29 89 4 225 - - - - - -
Ill. 8 20 130 225 - 68 - - - - - -
Mich. 4 - 565 361 98 128 - - - - - 1
Wis. - 1 2 82 - 26 - - - - - -
W.N. CENTRAL 31 13 211 516 86 102 - - - - - -
Minn. 11 4 18 20 13 7 - - - - - -
Iowa 6 1 38 230 15 13 - - - - - -
Mo. 10 4 121 209 48 68 - - - - - -
N. Dak. - - - 2 - 1 U - U - - -
S. Dak. 1 - 8 2 - 1 - - - - - -
Nebr. 1 - 14 13 6 4 - - - - - -
Kans. 2 4 12 40 4 8 - - - - - -
S. ATLANTIC 79 62 503 457 297 252 - - 1 1 1 5
Del. - - 1 - - - - - - - - -
Md. 22 16 100 106 52 45 - - - - - 1
D.C. 2 - 16 15 6 3 - - - - - -
Va. 8 9 38 77 26 28 - - - - - 2
W. Va. 1 2 4 - 5 2 - - - - - -
N.C. 12 8 42 28 63 68 - - - - - -
S.C. 2 1 5 8 32 - - - - - - -
Ga. 18 17 139 109 33 57 - - - - - 1
Fla. 14 9 158 114 80 49 - - 1 1 1 1
E.S. CENTRAL 27 21 107 129 92 131 - - - - - -
Ky. 2 5 6 6 7 10 U - U - - -
Tenn. 14 10 72 72 58 96 - - - - - -
Ala. 10 5 27 31 27 25 - - - - - -
Miss. 1 1 2 20 - - - - - - - -
W.S. CENTRAL 18 17 437 542 114 199 - - - 2 2 -
Ark. - - 11 13 10 25 - - - - - -
La. 4 7 14 8 27 10 - - - - - -
Okla. 12 8 128 127 34 14 - - - - - -
Tex. 2 2 284 394 43 150 - - - 2 2 -
MOUNTAIN 36 58 408 934 142 222 - 1 - - 1 -
Mont. 1 - 5 9 7 2 - - - - - -
Idaho 1 - 16 59 7 9 - - - - - -
Wyo. 1 - 1 12 - 2 U - U - - -
Colo. 2 12 85 73 29 30 - 1 - - 1 -
N. Mex. 10 - 11 51 47 86 - - - - - -
Ariz. 18 31 233 602 25 52 - - - - - -
Utah 3 3 16 55 8 19 - - - - - -
Nev. - 12 41 73 19 22 - - - - - -
PACIFIC 27 38 1,164 1,547 447 489 - 13 - 2 15 3
Wash. - 1 77 178 11 35 - - - - - -
Oreg. 13 19 70 126 21 52 - 8 - - 8 -
Calif. 12 15 1,014 1,218 404 394 - 5 - 2 7 3
Alaska 2 1 2 3 7 2 - - - - - -
Hawaii - 2 1 22 4 6 - - - - - -
Guam - - - - - - U - U - - -
P.R. - 1 25 13 31 158 - - - - - -
V.I. U U U U U U U U U U U U
Amer. Samoa U U U U U U U U U U U U
C.N.M.I. - - - - - 26 U - U - - -
-----------------------------------------------------------------------------------------------------------------------------------------------------
N: Not notifiable U: Unavailable -: no reported cases
* Of 63 cases among children aged <5 years, serotype was reported for 27 and of those, 4 were type b.
** For imported measles, cases include only those resulting from importation from other countries.
=======================================================================================================================================================
TABLE III. (page 2) Provisional cases of selected notifiable diseases preventable by vaccination, United
States, weeks ending April 10, 1999, and April 11, 1998 (14th Week)
Meningococcal
Disease Mumps Pertussis Rubella
----------------- -------------------------- --------------------------- ---------------------------
Cum. Cum. Cum. Cum. Cum. Cum. Cum. Cum.
Reporting Area 1999 1998 1999 1999 1998 1999 1999 1998 1999 1999 1998
------------------------------------------------------------------------------------------------------------------------------------------
UNITED STATES 725 916 4 100 132 43 1,239 1,169 1 12 130
NEW ENGLAND 36 50 - 1 - 1 126 232 - 3 22
Maine 3 4 - - - - - 5 - - -
N.H. - 1 - 1 - - 19 20 - - -
Vt. 2 1 - - - - 10 25 - - -
Mass. 26 22 - - - - 90 177 - 3 2
R.I. 2 3 - - - - 2 - - - -
Conn. 3 19 - - - 1 5 5 - - 20
MID. ATLANTIC 72 95 1 15 10 5 303 149 1 1 72
Upstate N.Y. 18 24 - 2 2 4 260 80 1 1 67
N.Y. City 18 10 - 3 5 - 10 6 - - 1
N.J. 16 23 - - - - - 6 - - 4
Pa. 20 38 1 10 3 1 33 57 - - -
E.N. CENTRAL 99 141 - 12 20 - 106 134 - - -
Ohio 49 51 - 6 10 - 89 38 - - -
Ind. 7 24 - - - - 2 34 - - -
Ill. 28 36 - - 1 - - 8 - - -
Mich. 15 13 - 6 9 - 15 16 - - -
Wis. - 17 - - - - - 38 - - -
W.N. CENTRAL 92 76 - 3 15 - 18 87 - - 2
Minn. 25 6 - - 8 - - 50 - - -
Iowa 20 12 - 2 5 - 7 15 - - -
Mo. 33 34 - 1 1 - 9 11 - - 1
N. Dak. - - U - 1 U - - U - -
S. Dak. 5 5 - - - - 2 2 - - -
Nebr. 2 4 - - - - - 3 - - -
Kans. 7 15 - - - - - 6 - - 1
S. ATLANTIC 123 135 2 19 15 5 80 84 - 2 1
Del. 2 1 - - - - - - - - -
Md. 19 16 - 3 - 1 25 17 - 1 -
D.C. 1 - - 1 - - - - - - -
Va. 16 15 - 2 4 - 7 6 - - -
W. Va. 1 4 - - - - - 1 - - -
N.C. 16 22 1 4 6 - 22 38 - 1 1
S.C. 15 19 - 2 3 1 7 7 - - -
Ga. 16 34 - - - - 7 - - - -
Fla. 37 24 1 7 2 3 12 15 - - -
E.S. CENTRAL 54 78 - 1 1 4 21 17 - - -
Ky. 10 13 U - - U 1 2 U - -
Tenn. 21 27 - - - 4 16 6 - - -
Ala. 18 28 - 1 1 - 4 9 - - -
Miss. 5 10 - - - - - - - - -
W.S. CENTRAL 44 66 - 12 22 5 34 55 - 5 26
Ark. 12 12 - - - - 5 5 - - -
La. 21 16 - - - - - - - - -
Okla. 9 18 - 1 - - 2 6 - - -
Tex. 2 20 - 11 22 5 27 44 - 5 26
MOUNTAIN 57 62 - 7 11 5 165 207 - - 5
Mont. - 2 - - - - 1 1 - - -
Idaho 7 3 - - - 2 84 74 - - -
Wyo. 2 3 U - 1 U 1 7 U - -
Colo. 18 14 - 2 1 - 24 43 - - -
N. Mex. 7 10 N N N 2 12 48 - - 1
Ariz. 17 22 - - 4 - 20 23 - - 1
Utah 4 6 - 4 1 1 21 7 - - 2
Nev. 2 2 - 1 4 - 2 4 - - 1
PACIFIC 148 213 1 30 38 18 386 204 - 1 2
Wash. 17 24 - - 4 14 225 76 - - -
Oreg. 25 40 N N N 4 8 12 - - -
Calif. 99 145 1 26 24 - 149 113 - 1 1
Alaska 3 1 - 1 2 - 2 - - - -
Hawaii 4 3 - 3 8 - 2 3 - - 1
Guam - - U - 2 U - - U - -
P.R. 2 2 - - 1 - - 2 - - -
V.I. U U U U U U U U U U U
Amer. Samoa U U U U U U U U U U U
C.N.M.I. - - U - 2 U - 1 U - -
------------------------------------------------------------------------------------------------------------------------------------------
N: Not notifiable U: Unavailable -: no reported cases
=======================================================================================================================================================
Return to top. Table_IV Note: To print large tables and graphs users may have to change their printer settings to landscape and use a small font size.
TABLE IV. Deaths in 122 U.S. cities,* week ending
April 10, 1999 (14th Week)
===================================================================================================================================
All Causes, By Age (Years)
------------------------------------------------------------------------ P&I**
Reporting Area All Ages >=65 45-64 25-44 1-24 <1 Total
---------------------------------------------------------------------------------------------------------------
NEW ENGLAND 522 380 92 23 10 17 41
Boston, Mass. 161 96 40 10 6 9 10
Bridgeport, Conn. 26 17 7 2 - - 2
Cambridge, Mass. 13 10 1 - 1 1 2
Fall River, Mass. 24 21 3 - - - 1
Hartford, Conn. 67 54 7 3 1 2 7
Lowell, Mass. 23 19 2 1 1 - 2
Lynn, Mass. 19 16 1 1 1 - -
New Bedford, Mass. 25 21 3 1 - - -
New Haven, Conn. 47 31 10 2 - 4 2
Providence, R.I. U U U U U U U
Somerville, Mass. 1 1 - - - - -
Springfield, Mass. 42 34 6 2 - - 4
Waterbury, Conn. 23 19 4 - - - 2
Worcester, Mass. 51 41 8 1 - 1 9
MID. ATLANTIC 2,106 1,492 382 156 35 41 100
Albany, N.Y. 39 32 2 3 1 1 3
Allentown, Pa. 24 19 5 - - - 3
Buffalo, N.Y. U U U U U U U
Camden, N.J. 33 17 11 2 3 - 4
Elizabeth, N.J. 18 10 3 5 - - -
Erie, Pa. 47 39 4 3 1 - 4
Jersey City, N.J. 55 39 9 5 1 1 -
New York City, N.Y. 1,110 774 211 83 17 25 22
Newark, N.J. 74 40 19 9 4 2 3
Paterson, N.J. 39 20 7 9 - 3 -
Philadelphia, Pa. 297 224 47 17 4 5 22
Pittsburgh, Pa.*** 45 27 10 4 3 1 3
Reading, Pa. 32 28 3 - - 1 3
Rochester, N.Y. 130 100 23 5 1 1 13
Schenectady, N.Y. 27 19 8 - - - -
Scranton, Pa. 36 30 3 3 - - 4
Syracuse, N.Y. 67 49 12 5 - 1 13
Trenton, N.J. 17 11 3 3 - - 1
Utica, N.Y. 16 14 2 - - - 2
Yonkers, N.Y. U U U U U U U
E.N. CENTRAL 2,422 1,697 458 158 47 59 233
Akron, Ohio 57 44 7 1 - 5 2
Canton, Ohio 45 31 10 2 1 1 5
Chicago, Ill. 460 301 100 41 10 5 43
Cincinnati, Ohio 110 77 22 5 3 3 16
Cleveland, Ohio 187 125 43 11 3 5 3
Columbus, Ohio 272 193 46 18 6 9 43
Dayton, Ohio 120 81 27 5 2 5 12
Detroit, Mich. 205 106 52 34 6 7 3
Evansville, Ind. 53 43 8 2 - - 11
Fort Wayne, Ind. 59 47 9 - 2 1 1
Gary, Ind. 18 13 5 - - - -
Grand Rapids, Mich. 66 57 5 3 - 1 10
Indianapolis, Ind. 251 173 51 15 9 3 26
Lansing, Mich. 32 21 5 2 1 3 4
Milwaukee, Wis. 131 98 21 8 2 2 17
Peoria, Ill. 46 36 5 - 1 4 5
Rockford, Ill. 62 49 8 3 - 2 6
South Bend, Ind. 66 54 8 3 - 1 8
Toledo, Ohio 107 83 18 4 1 1 12
Youngstown, Ohio 75 65 8 1 - 1 6
W.N. CENTRAL 974 708 167 57 23 19 80
Des Moines, Iowa 164 124 27 8 4 1 20
Duluth, Minn. 29 23 5 - - 1 1
Kansas City, Kans. U U U U U U U
Kansas City, Mo. 148 105 25 12 5 1 11
Lincoln, Nebr. 33 24 5 3 - 1 3
Minneapolis, Minn. 260 190 40 20 5 5 26
Omaha, Nebr. 109 80 18 3 5 3 10
St. Louis, Mo. 126 81 33 6 1 5 1
St. Paul, Minn. 105 81 14 5 3 2 8
Wichita, Kans. U U U U U U U
S. ATLANTIC 1,223 839 227 102 30 25 113
Atlanta, Ga. U U U U U U U
Baltimore, Md. 259 173 52 27 3 4 33
Charlotte, N.C. 139 93 27 9 5 5 14
Jacksonville, Fla. 144 104 27 6 3 4 7
Miami, Fla. 100 57 23 16 4 - 1
Norfolk, Va. 45 34 5 3 - 3 3
Richmond, Va. 50 37 10 2 1 - 2
Savannah, Ga. 70 54 11 4 1 - 8
St. Petersburg, Fla. 60 42 5 8 4 1 10
Tampa, Fla. 194 150 23 13 5 3 29
Washington, D.C. 143 84 36 14 4 5 6
Wilmington, Del. 19 11 8 - - - -
E.S. CENTRAL 1,031 729 201 62 23 14 94
Birmingham, Ala. 211 143 42 15 6 3 29
Chattanooga, Tenn. 79 60 13 4 1 1 8
Knoxville, Tenn. 95 78 13 3 1 - 2
Lexington, Ky. 97 65 19 6 4 3 17
Memphis, Tenn. 249 169 50 20 6 4 27
Mobile, Ala. 79 62 13 2 1 1 2
Montgomery, Ala. 76 59 11 3 2 1 6
Nashville, Tenn. 145 93 40 9 2 1 3
W.S. CENTRAL 1,608 1,088 301 141 50 27 138
Austin, Tex. 83 50 22 6 2 3 4
Baton Rouge, La. 18 15 3 - - - 1
Corpus Christi, Tex. 55 40 9 4 2 - 2
Dallas, Tex. 182 117 35 22 3 5 5
El Paso, Tex. 72 48 13 8 2 1 5
Ft. Worth, Tex. 117 80 21 11 4 1 18
Houston, Tex. 399 249 94 35 15 6 39
Little Rock, Ark. 90 65 11 6 5 3 8
New Orleans, La. 161 112 26 16 5 2 16
San Antonio, Tex. 199 143 33 15 4 3 13
Shreveport, La. 75 56 11 3 4 1 17
Tulsa, Okla. 157 113 23 15 4 2 10
MOUNTAIN 917 638 165 65 28 21 74
Albuquerque, N.M. 123 85 25 9 3 1 9
Boise, Idaho 35 30 3 1 1 - 2
Colo. Springs, Colo. 55 41 8 3 1 2 6
Denver, Colo. 115 75 23 11 2 4 12
Las Vegas, Nev. 217 150 43 17 3 4 8
Ogden, Utah U U U U U U U
Phoenix, Ariz. 60 40 13 3 3 1 5
Pueblo, Colo. 26 19 4 2 - 1 2
Salt Lake City, Utah 146 99 23 13 6 5 15
Tucson, Ariz. 140 99 23 6 9 3 15
PACIFIC 1,450 1,056 265 77 26 22 142
Berkeley, Calif. 19 14 2 2 - 1 1
Fresno, Calif. 84 62 15 4 2 1 10
Glendale, Calif. U U U U U U U
Honolulu, Hawaii 83 59 16 5 1 2 6
Long Beach, Calif. 96 69 17 6 2 2 10
Los Angeles, Calif. U U U U U U U
Pasadena, Calif. 20 12 6 1 1 - 3
Portland, Oreg. 128 85 27 11 2 3 6
Sacramento, Calif. 198 154 29 7 4 4 33
San Diego, Calif. 143 106 29 6 1 1 12
San Francisco, Calif. 153 112 26 10 3 1 19
San Jose, Calif. 176 124 38 8 3 3 19
Santa Cruz, Calif. 39 33 3 1 2 - 5
Seattle, Wash. 143 97 27 10 5 4 6
Spokane, Wash. 63 44 16 3 - - 6
Tacoma, Wash. 105 85 14 3 - - 6
TOTAL 12,253**** 8,627 2,258 841 272 245 1,015
---------------------------------------------------------------------------------------------------------------
U: Unavailable -: no reported cases
* Mortality data in this table are voluntarily reported from 122 cities in the United States, most of which have populations
of 100,000 or more. A death is reported by the place of its occurrence and by the week that the death certificate was
filed. Fetal deaths are not included.
** Pneumonia and influenza.
*** Because of changes in reporting methods in this Pennsylvania city, these numbers are partial counts for the current
week. Complete counts will be available in 4 to 6 weeks.
**** Total includes unknown ages.
===================================================================================================================================
Return to top. Disclaimer All MMWR HTML versions of articles are electronic conversions from ASCII text into HTML. This conversion may have resulted in character translation or format errors in the HTML version. Users should not rely on this HTML document, but are referred to the electronic PDF version and/or the original MMWR paper copy for the official text, figures, and tables. An original paper copy of this issue can be obtained from the Superintendent of Documents, U.S. Government Printing Office (GPO), Washington, DC 20402-9371; telephone: (202) 512-1800. Contact GPO for current prices. **Questions or messages regarding errors in formatting should be addressed to mmwrq@cdc.gov.Page converted: 04/15/99 |
|||||||||
This page last reviewed 5/2/01
|