 |
|
|
|
|
|
|
| ||||||||||
|
|
|
|
|
|
|
||||
| ||||||||||
|
|
|
|
|
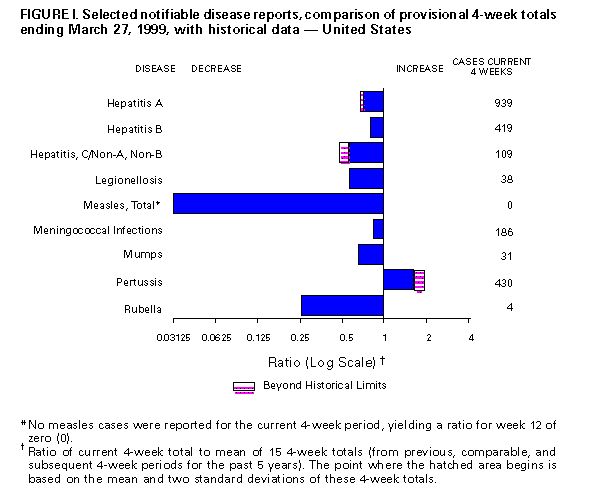
Persons using assistive technology might not be able to fully access information in this file. For assistance, please send e-mail to: mmwrq@cdc.gov. Type 508 Accommodation and the title of the report in the subject line of e-mail. Notifiable Diseases/Deaths in Selected Cities Weekly InformationFigure_I Selected notifiable disease reports, comparison of provisional 4-week totals ending March 27, 1999, with historical data -- United States Table_I Summary -- provisional cases of selected notifiable diseases, United States, cumulative, week ending March 27, 1999 (12th Week) Table_II Provisional cases of selected notifiable diseases, United States, weeks ending March 27, 1999 and March 28, 1998 (12th Week) Table_III Provisional cases of selected notifiable diseases preventable by vaccination, United States, weeks ending March 27, 1999 and March 28, 1998 (12th Week) Table_IV Deaths in 122 U.S. cities, week ending
March 27, 1999 (12th Week)
TABLE I. Summary -- provisional cases of specified notifiable diseases, United
States, cumulative, week ending March 27, 1999 (12th Week)
==================================================================================
                                             Cum. 1999
------------------------------------------------------
Anthrax                                              -
Brucellosis                                         10
Cholera                                              -
Congenital rubella syndrome                          -
Cryptosporidiosis*                                 221
Diphtheria                                           -
Encephalitis:  California*                           1
               eastern equine*                       -
               St. Louis*                            -
               western equine*                       -
Hansen Disease                                      12
Hantavirus pulmonary syndrome*+                      2
Hemolytic uremic syndrome, post-diarrheal*           5
HIV infection, pediatric*&                          18
Plague                                               -
Poliomyelitis, paralytic                             -
Psittacosis                                          8
Rabies, human                                        -
Rocky Mountain spotted fever (RMSF)                 29
Streptococcal disease, invasive Group A            411
Streptococcal toxic-shock syndrome*                 11
Syphilis, congenital@                                -
Tetanus                                              4
Toxic-shock syndrome                                24
Trichinosis                                          3
Typhoid fever                                       58
Yellow fever                                         -
------------------------------------------------------
-: no reported cases
 * Not notifiable in all states
 + Updated weekly from reports to the Division of Viral and Rickettsial
   Diseases, National Center for Infectious Diseases (NCID).
 & Updated monthly from reports to the Division of HIV/AIDS Prevention --
   Surveillance and Epidemiology, National Center for HIV, STD, and TB
   Prevention (NCHSTP), last update February 21, 1999.
 @ Updated from reports to the Division of STD Prevention, NCHSTP.

==================================================================================
Return to top. Table_II Note: To print large tables and graphs users may have to change their printer settings to landscape and use a small font size.
TABLE II. (page 1) Provisional cases of selected notifiable diseases, United States, weeks ending
March 27, 1999, and March 28, 1998 (12th Week)
Escherichia
coli O157:H7
------------------- Hepatitis
AIDS Chlamydia NETSS** PHLIS*** Gonorrhea C/NA,NB
----------------- -------------------- -------- -------- ------------------- ----------------
Cum. Cum. Cum. Cum. Cum. Cum. Cum. Cum. Cum. Cum.
Reporting Area 1999* 1998 1999 1998 1999 1999 1999 1998 1999 1998
------------------------------------------------------------------------------------------------------------------------------
UNITED STATES 7,049 10,878 114,094 130,076 249 117 63,077 76,310 500 924
NEW ENGLAND 359 310 4,343 4,847 42 27 1,434 1,367 46 21
Maine 5 4 153 211 3 - 10 11 - -
N.H. 13 12 225 233 2 1 19 26 - -
Vt. 4 8 107 66 3 - 12 1 1 2
Mass. 245 92 2,060 1,924 19 16 644 501 45 19
R.I. 20 34 510 577 1 1 126 74 - -
Conn. 72 160 1,288 1,836 14 9 623 754 - -
MID. ATLANTIC 1,497 3,359 16,204 15,704 13 1 8,540 9,094 32 86
Upstate N.Y. 74 426 N N 10 - 727 1,510 28 75
N.Y. City 837 1,934 7,966 8,251 - 1 3,825 3,817 - -
N.J. 375 516 2,310 2,748 3 - 1,161 1,649 - -
Pa. 211 483 5,928 4,705 N - 2,827 2,118 4 11
E.N. CENTRAL 487 793 17,035 19,675 40 25 11,571 14,915 107 113
Ohio 95 154 5,418 6,530 21 8 3,205 3,826 - 5
Ind. 52 80 - - 5 7 726 1,456 - 2
Ill. 231 373 6,456 4,536 4 3 4,277 4,095 2 15
Mich. 80 144 4,249 5,392 10 4 2,967 4,294 105 91
Wis. 29 42 912 3,217 N 3 396 1,244 - -
W.N. CENTRAL 161 195 3,774 8,266 54 15 1,319 3,536 21 143
Minn. 26 31 1,284 1,653 16 12 496 565 - -
Iowa 12 9 396 874 5 2 160 239 - 3
Mo. 84 100 - 2,927 4 1 - 1,701 20 140
N. Dak. 3 3 102 234 2 - 7 21 - -
S. Dak. 4 7 418 390 1 - 38 66 - -
Nebr. 11 14 679 713 19 - 291 288 - -
Kans. 21 31 895 1,475 7 - 327 656 1 -
S. ATLANTIC 1,888 2,971 25,922 25,643 26 10 19,353 20,594 50 27
Del. 31 40 694 563 1 - 403 334 - -
Md. 254 334 1,805 1,740 1 - 2,114 2,073 18 3
D.C. 67 193 N N - - 588 813 - -
Va. 103 176 3,153 2,774 6 2 2,170 1,820 6 1
W. Va. 14 19 547 1,117 - 1 94 365 6 2
N.C. 126 216 5,062 5,097 7 3 4,448 4,416 - 7
S.C. 132 162 4,816 4,026 1 1 2,397 2,607 6 -
Ga. 209 370 3,366 5,866 1 - 2,422 4,663 1 8
Fla. 952 1,461 6,479 4,460 9 3 4,717 3,503 13 6
E.S. CENTRAL 303 382 8,722 9,063 17 4 7,615 8,664 25 30
Ky. 37 63 - 1,448 5 - - 850 1 6
Tenn. 132 140 3,370 3,030 8 3 2,627 2,597 23 21
Ala. 71 118 3,290 2,379 4 - 3,010 2,965 1 3
Miss. 63 61 2,062 2,206 - 1 1,978 2,252 - -
W.S. CENTRAL 989 1,356 12,798 18,501 6 6 7,823 11,038 24 16
Ark. 34 52 1,234 849 2 2 590 1,092 2 2
La. 69 207 3,881 2,813 1 2 3,349 2,442 12 -
Okla. 20 71 1,944 2,183 2 2 1,011 1,169 1 -
Tex. 866 1,026 5,739 12,656 1 - 2,873 6,335 9 14
MOUNTAIN 213 348 6,355 6,952 16 6 1,702 1,848 46 136
Mont. 3 10 271 211 - - 5 11 4 4
Idaho 5 8 399 454 - 1 25 41 4 54
Wyo. 1 1 180 180 1 1 7 10 14 32
Colo. 57 65 1,748 1,813 5 2 460 588 7 8
N. Mex. 9 52 971 951 1 - 173 176 4 19
Ariz. 89 126 1,837 2,382 4 1 724 805 10 -
Utah 27 35 356 512 5 1 38 58 1 9
Nev. 22 51 593 449 - - 270 159 2 10
PACIFIC 1,152 1,164 18,941 21,425 35 23 3,720 5,254 149 352
Wash. 59 74 2,810 2,526 4 8 495 443 2 5
Oreg. 32 40 1,119 1,362 12 9 162 198 - 8
Calif. 1,040 1,027 14,124 16,568 19 6 2,906 4,445 147 304
Alaska 5 - 453 466 - - 90 71 - 1
Hawaii 16 23 435 503 - - 67 97 - 34
Guam 1 - - 73 N - - 6 - -
P.R. 214 271 U U 1 U 68 102 - -
V.I. 3 13 N N N U U U U U
Amer. Samoa - - U U N U U U U U
C.N.M.I. - - N N N U - 8 - -
------------------------------------------------------------------------------------------------------------------------------
N: Not notifiable U: Unavailable -: no reported cases C.N.M.I.: Commonwealth of North Mariana Islands
* Updated monthly from reports to the Division of HIV/AIDS Prevention -- Surveillance and Epidemiology, National Center for HIV,
STD, and TB Prevention, last update February 21, 1999.
** National Electronic Telecommunications System for Surveillance.
*** Public Health Laboratory Information System.
=======================================================================================================================================================
TABLE II. (page 2) Provisional cases of selected notifiable diseases, United States, weeks ending
March 27, 1999, and March 28, 1998 (12th Week)
Lyme Syphilis Rabies,
Legionellosis Disease Malaria (Primary & Secondary) Tuberculosis Animal
---------------- ---------------- ---------------- --------------------- ----------------- -------
Cum. Cum. Cum. Cum. Cum. Cum. Cum. Cum. Cum. Cum. Cum.
Reporting Area 1999 1998 1999 1998 1999 1998 1999 1998 1999 * 1998 * 1999
-------------------------------------------------------------------------------------------------------------------------------------------
UNITED STATES 168 280 695 899 223 259 1,260 1,647 990 1,598 984
NEW ENGLAND 12 17 137 172 3 9 16 18 77 78 176
Maine 2 1 - 1 - - - 1 3 2 32
N.H. 1 2 - 5 - - - 1 - 2 13
Vt. 3 - - 2 - - 1 - - 1 34
Mass. 2 5 91 39 3 9 10 14 41 41 40
R.I. 1 4 8 14 - - 1 - 15 9 15
Conn. 3 5 38 111 - - 4 2 18 23 42
MID. ATLANTIC 42 60 377 565 60 90 47 64 374 359 211
Upstate N.Y. 12 13 116 241 18 21 4 7 32 44 130
N.Y. City 3 15 2 17 13 48 22 9 227 221 U
N.J. 5 3 97 67 21 12 1 20 115 94 51
Pa. 22 29 162 240 8 9 20 28 U U 30
E.N. CENTRAL 39 109 19 19 14 18 235 236 45 64 1
Ohio 17 33 13 14 2 1 20 46 U U -
Ind. 5 25 5 4 4 1 32 37 U U -
Ill. 2 15 - - - 9 157 98 U U -
Mich. 14 15 1 1 6 6 26 38 38 40 1
Wis. 1 21 U U 2 1 - 17 7 24 -
W.N. CENTRAL 6 17 9 9 8 11 6 45 87 56 92
Minn. - 1 3 1 - 4 1 2 36 26 20
Iowa 4 2 1 6 2 2 1 - - - 20
Mo. 1 7 - 1 5 4 - 33 41 13 4
N. Dak. - - 1 - - - - - 1 1 29
S. Dak. 1 - - - - - - - 3 4 -
Nebr. - 7 - - - - 1 4 4 - 1
Kans. - - 4 1 1 1 3 6 2 12 18
S. ATLANTIC 30 34 98 97 65 54 475 631 149 334 374
Del. 2 6 - 2 - 1 1 6 - 5 -
Md. 5 8 78 85 19 22 102 167 U U 78
D.C. - 2 1 4 6 3 10 21 10 25 -
Va. 4 3 - 1 10 5 36 49 17 53 98
W. Va. N N 1 - 1 - 1 - 10 17 16
N.C. 4 4 13 - 5 6 130 192 60 161 90
S.C. 5 4 1 - - - 61 73 52 73 24
Ga. - - - 2 5 12 56 51 U U 33
Fla. 10 7 4 3 19 5 78 72 U U 35
E.S. CENTRAL 8 9 12 11 3 8 228 296 73 132 51
Ky. 2 5 - 1 - - - 34 U U 13
Tenn. 5 2 4 5 2 4 126 148 U U 21
Ala. 1 1 6 5 1 2 75 62 67 87 17
Miss. - 1 2 - - 2 27 52 6 45 -
W.S. CENTRAL 1 2 - - 5 5 199 211 49 439 16
Ark. - - - - - 1 24 30 27 18 -
La. 1 - - - 3 3 59 82 U U -
Okla. - - - - 1 - 60 12 22 26 16
Tex. - 2 - - 1 1 56 87 - 395 -
MOUNTAIN 11 15 2 1 10 13 18 59 35 52 30
Mont. - 1 - - 1 - - - - 2 12
Idaho - - - - 1 1 - - - 1 -
Wyo. - 1 1 - - - - - - 1 8
Colo. 1 4 - - 4 4 - 4 U U 1
N. Mex. 1 1 1 - 1 4 - 4 10 9 -
Ariz. 1 1 - - 3 2 16 46 U U 9
Utah 4 6 - - - 1 1 2 11 11 -
Nev. 4 1 - 1 - 1 1 3 14 28 -
PACIFIC 19 17 41 25 55 51 36 87 101 84 33
Wash. 2 1 - - 3 - 5 4 58 41 -
Oreg. - - 1 2 7 10 - 2 U U -
Calif. 17 16 40 23 42 41 29 81 U U 30
Alaska - - - - - - 1 - 8 10 3
Hawaii - - - - 3 - 1 - 35 33 -
Guam - 1 - - - 1 - - - 34 -
P.R. - - - - - - 52 52 - 6 14
V.I. U U U U U U U U U U U
Amer. Samoa U U U U U U U U U U U
C.N.M.I. - - - - - - - 50 - 26 -
-------------------------------------------------------------------------------------------------------------------------------------------
N: Not notifiable U: Unavailable -: no reported cases
* Cumulative reports of provisional tuberculosis cases for 1998 and 1999 are unavailable ('U') for some areas using the Tuberculosis
Information Management System (TIMS).
=======================================================================================================================================================
Return to top. Table_III Note: To print large tables and graphs users may have to change their printer settings to landscape and use a small font size.
TABLE III. (page 1) Provisional cases of selected notifiable diseases preventable by vaccination, United
States, weeks ending March 27, 1999, and March 28, 1998 (12th Week)
Hepatitis (Viral), by type Measles (Rubeola)
H. influenzae, --------------------------------------- ------------------------------------------------------------
invasive A B Indigenous Imported** Total
---------------- ----------------- ----------------- --------------- --------------- ---------------
Cum. Cum. Cum. Cum. Cum. Cum. Cum. Cum. Cum. Cum.
Reporting Area 1999* 1998 1999 1998 1999 1998 1999 1999 1999 1999 1999 1998
-----------------------------------------------------------------------------------------------------------------------------------------------------
UNITED STATES 267 299 3,298 4,569 1,236 1,934 - 8 - 9 17 9
NEW ENGLAND 21 21 34 86 20 32 - - - 1 1 1
Maine 2 2 2 9 - - - - - - - -
N.H. 2 1 5 5 2 4 - - - 1 1 -
Vt. 3 2 1 4 1 - - - - - - -
Mass. 11 16 11 25 15 16 - - - - - 1
R.I. - - - 5 2 1 - - - - - -
Conn. 3 - 15 38 - 11 - - - - - -
MID. ATLANTIC 35 41 187 366 142 284 - - - - - 1
Upstate N.Y. 21 15 57 79 33 70 U - U - - -
N.Y. City 2 12 28 139 28 72 - - - - - -
N.J. 12 13 33 69 24 51 - - - - - 1
Pa. - 1 69 79 57 91 - - - - - -
E.N. CENTRAL 25 41 808 750 110 433 - - - - - 1
Ohio 16 19 192 94 26 20 - - - - - -
Ind. 1 5 29 87 4 214 U - U - - -
Ill. 7 16 89 196 - 58 - - - - - -
Mich. 1 - 496 311 80 119 - - - - - 1
Wis. - 1 2 62 - 22 - - - - - -
W.N. CENTRAL 22 8 166 421 68 103 - - - - - -
Minn. 5 2 11 15 9 6 - - - - - -
Iowa 5 1 28 176 12 13 U - U - - -
Mo. 8 1 103 179 39 72 - - - - - -
N. Dak. - - - 2 - 1 - - - - - -
S. Dak. 1 - 2 2 - 1 - - - - - -
Nebr. 1 - 13 10 6 4 - - - - - -
Kans. 2 4 9 37 2 6 - - - - - -
S. ATLANTIC 70 58 392 389 229 204 - - - - - 5
Del. - - - - - - - - - - - -
Md. 22 14 92 94 42 39 - - - - - 1
D.C. 2 - 15 13 6 3 - - - - - -
Va. 8 9 31 60 23 25 - - - - - 2
W. Va. 1 2 2 - 1 1 - - - - - -
N.C. 11 8 39 24 44 48 - - - - - -
S.C. 2 1 5 8 25 - - - - - - -
Ga. 12 17 74 109 27 57 U - U - - 1
Fla. 12 7 134 81 61 31 - - - - - 1
E.S. CENTRAL 22 20 97 118 84 120 - - - - - -
Ky. 2 5 6 5 7 8 U - U - - -
Tenn. 11 9 65 64 52 90 - - - - - -
Ala. 8 5 24 30 25 22 - - - - - -
Miss. 1 1 2 19 - - - - - - - -
W.S. CENTRAL 12 17 261 292 76 126 - - - 2 2 -
Ark. - - 8 11 9 23 - - - - - -
La. 3 7 9 8 8 10 - - - - - -
Okla. 7 8 91 105 22 7 - - - - - -
Tex. 2 2 153 168 37 86 - - - 2 2 -
MOUNTAIN 36 49 342 782 112 185 - 1 - - 1 -
Mont. 1 - 4 7 1 2 - - - - - -
Idaho 1 - 9 46 6 7 - - - - - -
Wyo. 1 - 1 11 - 2 - - - - - -
Colo. 2 9 76 62 26 23 - 1 - - 1 -
N. Mex. 10 - 8 42 41 75 - - - - - -
Ariz. 17 25 193 507 16 41 - - - - - -
Utah 4 4 14 45 8 16 - - - - - -
Nev. - 11 37 62 14 19 U - U - - -
PACIFIC 24 44 1,011 1,365 395 447 - 7 - 6 13 1
Wash. - 1 67 136 7 30 - - - - - -
Oreg. 10 30 58 188 19 70 - 6 - - 6 -
Calif. 12 10 883 1,019 360 340 - 1 - 6 7 1
Alaska 2 1 2 1 6 2 - - - - - -
Hawaii - 2 1 21 3 5 - - - - - -
Guam - - - - - - U - U - - -
P.R. - 1 17 13 24 144 - - - - - -
V.I. U U U U U U U U U U U U
Amer. Samoa U U U U U U U U U U U U
C.N.M.I. - - - - - 21 U - U - - -
-----------------------------------------------------------------------------------------------------------------------------------------------------
N: Not notifiable U: Unavailable -: no reported cases
* Of 55 cases among children aged <5 years, serotype was reported for 23 and of those, 4 were type b.
** For imported measles, cases include only those resulting from importation from other countries.
=======================================================================================================================================================
TABLE III. (page 2) Provisional cases of selected notifiable diseases preventable by vaccination, United
States, weeks ending March 27, 1999, and March 28, 1998 (12th Week)
Meningococcal
Disease Mumps Pertussis Rubella
----------------- -------------------------- --------------------------- ---------------------------
Cum. Cum. Cum. Cum. Cum. Cum. Cum. Cum.
Reporting Area 1999 1998 1999 1999 1998 1999 1999 1998 1999 1999 1998
------------------------------------------------------------------------------------------------------------------------------------------
UNITED STATES 608 827 11 86 107 75 916 998 1 6 104
NEW ENGLAND 32 45 - 1 - 1 99 212 - - 16
Maine 3 4 - - - - - 4 - - -
N.H. - 1 - 1 - - 18 17 - - -
Vt. 2 1 - - - - 10 25 - - -
Mass. 22 19 - - - 1 65 161 - - 1
R.I. 2 3 - - - - 2 - - - -
Conn. 3 17 - - - - 4 5 - - 15
MID. ATLANTIC 57 83 - 10 9 - 126 110 - - 58
Upstate N.Y. 9 21 U 2 2 U 97 70 U - 53
N.Y. City 18 10 - - 5 - - 6 - - 1
N.J. 15 19 - - - - - 6 - - 4
Pa. 15 33 - 8 2 - 29 28 - - -
E.N. CENTRAL 91 128 3 10 14 4 97 122 - - -
Ohio 47 48 3 6 7 4 83 34 - - -
Ind. 7 24 U - - U 2 34 U - -
Ill. 26 28 - - - - - 5 - - -
Mich. 11 13 - 4 7 - 12 13 - - -
Wis. - 15 - - - - - 36 - - -
W.N. CENTRAL 70 66 - 2 9 1 13 76 - - -
Minn. 18 3 - - 4 - - 39 - - -
Iowa 15 10 U 2 3 U 5 15 U - -
Mo. 26 30 - - 1 - 6 11 - - -
N. Dak. - - - - 1 - - - - - -
S. Dak. 5 5 - - - 1 2 2 - - -
Nebr. 2 3 - - - - - 3 - - -
Kans. 4 15 - - - - - 6 - - -
S. ATLANTIC 108 115 4 17 13 8 70 68 1 2 1
Del. 2 1 - - - - - - - - -
Md. 17 14 - 3 - 1 22 15 - 1 -
D.C. 1 - - 1 - - - - - - -
Va. 14 14 - 2 2 - 7 - - - -
W. Va. 1 3 - - - - - 1 - - -
N.C. 14 19 2 3 6 1 22 34 1 1 1
S.C. 15 15 - 2 3 - 6 6 - - -
Ga. 14 33 U - - U 4 - U - -
Fla. 30 16 2 6 2 6 9 12 - - -
E.S. CENTRAL 46 67 - 1 1 - 14 14 - - -
Ky. 10 11 U - - U 1 1 U - -
Tenn. 18 24 - - - - 9 4 - - -
Ala. 13 24 - 1 1 - 4 9 - - -
Miss. 5 8 - - - - - - - - -
W.S. CENTRAL 30 50 2 11 21 1 27 43 - 4 22
Ark. 11 9 - - - 1 4 4 - - -
La. 7 16 - - - - - - - - -
Okla. 10 17 - 1 - - 2 6 - - -
Tex. 2 8 2 10 21 - 21 33 - 4 22
MOUNTAIN 51 53 - 7 8 12 155 176 - - 5
Mont. - 2 - - - - 1 1 - - -
Idaho 5 3 - - - 6 81 66 - - -
Wyo. 2 3 - - 1 - 1 - - - -
Colo. 16 13 - 2 1 2 21 40 - - -
N. Mex. 7 7 N N N 1 10 47 - - 1
Ariz. 16 18 - - 2 1 20 14 - - 1
Utah 3 6 - 4 - 2 19 4 - - 2
Nev. 2 1 U 1 4 U 2 4 U - 1
PACIFIC 123 220 2 27 32 48 315 177 - - 2
Wash. 16 23 - - 4 44 174 62 - - -
Oreg. 19 63 N N N - 3 17 - - -
Calif. 81 130 2 23 19 4 137 95 - - 1
Alaska 3 1 - 1 2 - 1 - - - -
Hawaii 4 3 - 3 7 - - 3 - - 1
Guam - - U - 2 U - - U - -
P.R. 2 2 - - 1 - - 2 - - -
V.I. U U U U U U U U U U U
Amer. Samoa U U U U U U U U U U U
C.N.M.I. - - U - 2 U - 1 U - -
------------------------------------------------------------------------------------------------------------------------------------------
N: Not notifiable U: Unavailable -: no reported cases
=======================================================================================================================================================
Return to top. Table_IV Note: To print large tables and graphs users may have to change their printer settings to landscape and use a small font size.
TABLE IV. Deaths in 122 U.S. cities,* week ending
March 27, 1999 (12th Week)
===================================================================================================================================
All Causes, By Age (Years)
------------------------------------------------------------------------ P&I**
Reporting Area All Ages >=65 45-64 25-44 1-24 <1 Total
---------------------------------------------------------------------------------------------------------------
NEW ENGLAND 581 437 100 31 6 7 57
Boston, Mass. 133 92 32 8 - 1 12
Bridgeport, Conn. 52 38 11 3 - - 2
Cambridge, Mass. 21 17 3 - 1 - -
Fall River, Mass. 36 31 2 2 1 - 3
Hartford, Conn. 50 34 10 5 1 - 5
Lowell, Mass. 24 21 1 2 - - 6
Lynn, Mass. 23 18 3 2 - - 3
New Bedford, Mass. 24 22 2 - - - 1
New Haven, Conn. 33 22 6 3 - 2 3
Providence, R.I. 59 46 11 1 1 - 1
Somerville, Mass. 2 2 - - - - -
Springfield, Mass. 37 26 4 3 1 3 5
Waterbury, Conn. 34 28 4 2 - - 2
Worcester, Mass. 53 40 11 - 1 1 14
MID. ATLANTIC 2,470 1,792 440 167 34 36 123
Albany, N.Y. 59 45 7 7 - - 6
Allentown, Pa. 26 22 4 - - - -
Buffalo, N.Y. 107 77 24 2 1 2 5
Camden, N.J. 23 14 3 4 1 1 1
Elizabeth, N.J. 19 16 3 - - - -
Erie, Pa. 43 37 4 - 2 - 7
Jersey City, N.J. 30 22 4 3 1 - -
New York City, N.Y. 1,246 880 244 91 15 16 27
Newark, N.J. 52 23 15 12 1 1 3
Paterson, N.J. 20 13 6 - 1 - -
Philadelphia, Pa. 402 288 62 32 12 8 24
Pittsburgh, Pa.*** 94 70 15 4 - 5 10
Reading, Pa. 27 25 1 1 - - 2
Rochester, N.Y. 133 108 20 4 - 1 15
Schenectady, N.Y. 26 20 4 2 - - 2
Scranton, Pa. 29 24 4 1 - - 2
Syracuse, N.Y. 80 65 11 2 - 2 16
Trenton, N.J. 23 18 4 1 - - 1
Utica, N.Y. 31 25 5 1 - - 2
Yonkers, N.Y. U U U U U U U
E.N. CENTRAL 2,319 1,645 395 143 63 73 216
Akron, Ohio 62 48 8 4 1 1 1
Canton, Ohio 43 35 3 3 - 2 5
Chicago, Ill. 465 309 73 47 17 19 44
Cincinnati, Ohio 111 78 19 4 1 9 19
Cleveland, Ohio 187 120 46 7 7 7 7
Columbus, Ohio 172 113 28 13 12 6 21
Dayton, Ohio 183 143 30 7 2 1 27
Detroit, Mich. 236 147 50 23 6 10 12
Evansville, Ind. 64 48 12 2 2 - 4
Fort Wayne, Ind. 95 78 10 3 1 3 9
Gary, Ind. 23 12 7 3 1 - -
Grand Rapids, Mich. 62 47 6 3 2 4 13
Indianapolis, Ind. 201 141 44 8 3 5 4
Lansing, Mich. 60 51 5 3 1 - 6
Milwaukee, Wis. 127 96 24 5 1 1 20
Peoria, Ill. 55 38 12 1 2 2 4
Rockford, Ill. 52 46 2 2 - 2 10
South Bend, Ind. 51 38 7 3 3 - 4
Toledo, Ohio U U U U U U U
Youngstown, Ohio 70 57 9 2 1 1 6
W.N. CENTRAL 800 600 129 38 16 17 95
Des Moines, Iowa 102 80 18 2 - 2 14
Duluth, Minn. 26 21 3 - 1 1 4
Kansas City, Kans. U U U U U U U
Kansas City, Mo. 96 69 18 6 3 - 10
Lincoln, Nebr. 41 34 2 4 - 1 1
Minneapolis, Minn. 225 176 29 8 6 6 30
Omaha, Nebr. 103 73 24 1 3 2 17
St. Louis, Mo. 123 84 24 10 2 3 11
St. Paul, Minn. 84 63 11 7 1 2 8
Wichita, Kans. U U U U U U U
S. ATLANTIC 1,052 738 198 72 27 17 88
Atlanta, Ga. U U U U U U U
Baltimore, Md. 183 114 38 19 9 3 31
Charlotte, N.C. 143 96 31 11 4 1 12
Jacksonville, Fla. 155 112 30 6 4 3 6
Miami, Fla. U U U U U U U
Norfolk, Va. 64 42 9 8 4 1 2
Richmond, Va. 67 43 19 2 2 1 3
Savannah, Ga. 36 23 11 2 - - 9
St. Petersburg, Fla. 68 59 5 3 1 - 3
Tampa, Fla. 221 168 35 10 3 5 19
Washington, D.C. 101 69 18 11 - 3 3
Wilmington, Del. 14 12 2 - - - -
E.S. CENTRAL 962 695 161 70 11 21 74
Birmingham, Ala. 221 164 39 10 - 4 29
Chattanooga, Tenn. 79 64 6 7 2 - 9
Knoxville, Tenn. 97 77 13 4 2 1 1
Lexington, Ky. 70 43 22 4 1 - 4
Memphis, Tenn. 203 149 27 17 3 7 13
Mobile, Ala. 94 61 20 10 - 3 1
Montgomery, Ala. 28 23 3 2 - - 6
Nashville, Tenn. 170 114 31 16 3 6 11
W.S. CENTRAL 1,571 1,074 310 106 45 36 139
Austin, Tex. 89 62 17 9 - 1 9
Baton Rouge, La. 88 62 18 3 3 2 1
Corpus Christi, Tex. 58 46 8 1 2 1 7
Dallas, Tex. 208 141 41 15 6 5 5
El Paso, Tex. 110 82 19 4 1 4 7
Ft. Worth, Tex. 152 98 36 5 8 5 24
Houston, Tex. 388 237 89 38 14 10 40
Little Rock, Ark. 81 54 19 5 1 2 3
New Orleans, La. U U U U U U U
San Antonio, Tex. 205 149 34 14 5 3 22
Shreveport, La. 75 54 13 3 3 2 10
Tulsa, Okla. 117 89 16 9 2 1 11
MOUNTAIN 963 712 152 53 29 17 80
Albuquerque, N.M. 99 76 8 9 4 2 5
Boise, Idaho 45 30 9 2 4 - 3
Colo. Springs, Colo. 71 48 14 5 2 2 6
Denver, Colo. 117 87 17 5 3 5 16
Las Vegas, Nev. 202 144 40 9 6 3 14
Ogden, Utah 32 28 3 1 - - 5
Phoenix, Ariz. 95 68 13 7 6 1 2
Pueblo, Colo. 22 18 2 1 - 1 2
Salt Lake City, Utah 116 84 21 8 2 1 14
Tucson, Ariz. 164 129 25 6 2 2 13
PACIFIC 1,666 1,200 290 108 40 23 153
Berkeley, Calif. 19 13 6 - - - -
Fresno, Calif. 99 76 15 5 3 - 10
Glendale, Calif. 20 19 - 1 - - 2
Honolulu, Hawaii 59 41 13 3 1 1 5
Long Beach, Calif. 57 45 9 2 1 - 9
Los Angeles, Calif. 369 255 72 28 7 7 20
Pasadena, Calif. 18 15 2 - 1 - 2
Portland, Oreg. 111 74 24 8 3 2 6
Sacramento, Calif. 185 143 27 9 6 - 34
San Diego, Calif. 147 93 34 14 6 - 14
San Francisco, Calif. U U U U U U U
San Jose, Calif. 230 175 34 13 - 8 26
Santa Cruz, Calif. 33 28 2 3 - - 2
Seattle, Wash. 141 92 24 13 7 5 11
Spokane, Wash. 69 51 15 2 1 - 8
Tacoma, Wash. 109 80 13 7 4 - 4
TOTAL 12,384**** 8,893 2,175 788 271 247 1,025
---------------------------------------------------------------------------------------------------------------
U: Unavailable -: no reported cases
* Mortality data in this table are voluntarily reported from 122 cities in the United States, most of which have populations
of 100,000 or more. A death is reported by the place of its occurrence and by the week that the death certificate was
filed. Fetal deaths are not included.
** Pneumonia and influenza.
*** Because of changes in reporting methods in this Pennsylvania city, these numbers are partial counts for the current
week. Complete counts will be available in 4 to 6 weeks.
**** Total includes unknown ages.
===================================================================================================================================
Return to top. Disclaimer All MMWR HTML versions of articles are electronic conversions from ASCII text into HTML. This conversion may have resulted in character translation or format errors in the HTML version. Users should not rely on this HTML document, but are referred to the electronic PDF version and/or the original MMWR paper copy for the official text, figures, and tables. An original paper copy of this issue can be obtained from the Superintendent of Documents, U.S. Government Printing Office (GPO), Washington, DC 20402-9371; telephone: (202) 512-1800. Contact GPO for current prices. **Questions or messages regarding errors in formatting should be addressed to mmwrq@cdc.gov.Page converted: 04/01/99 |
|||||||||
This page last reviewed 5/2/01
|