 |
|
|
|
|
|
|
| ||||||||||
|
|
|
|
|
|
|
||||
| ||||||||||
|
|
|
|
|
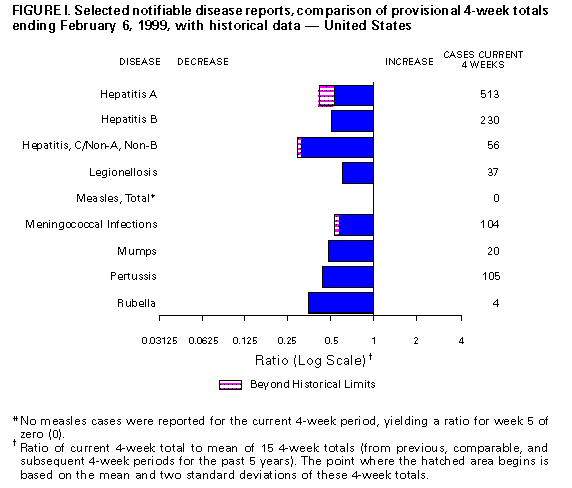
Persons using assistive technology might not be able to fully access information in this file. For assistance, please send e-mail to: mmwrq@cdc.gov. Type 508 Accommodation and the title of the report in the subject line of e-mail. Notifiable Diseases/Deaths in Selected Cities Weekly InformationFigure_I Selected notifiable disease reports, comparison of provisional 4-week totals ending February 6, 1999, with historical data -- United States Table_I Summary -- provisional cases of selected notifiable diseases, United States, cumulative, week ending February 6, 1999 (5th Week) Table_II Provisional cases of selected notifiable diseases, United States, weeks ending February 6, 1999 and February 7, 1998 (5th Week) Table_III Provisional cases of selected notifiable diseases preventable by vaccination, United States, weeks ending February 6, 1999 and February 7, 1998 (5th Week) Table_IV Deaths in 122 U.S. cities, week ending
February 6, 1999 (5th Week)
TABLE I. Summary -- provisional cases of specified notifiable diseases, United
States, cumulative, week ending February 6, 1999 (5th Week)
==================================================================================
                                             Cum. 1999
------------------------------------------------------
Anthrax                                              -
Brucellosis                                          2
Cholera                                              1
Congenital rubella syndrome                          -
Cryptosporidiosis*                                  51
Diphtheria                                           -
Encephalitis:  California*                           1
               eastern equine*                       -
               St. Louis*                            -
               western equine*                       -
Hansen Disease                                       3
Hantavirus pulmonary syndrome*+                      -
Hemolytic uremic syndrome, post-diarrheal*           4
HIV infection, pediatric*&                           7
Plague                                               -
Poliomyelitis, paralytic                             -
Psittacosis                                          2
Rabies, human                                        -
Rocky Mountain spotted fever (RMSF)                 13
Streptococcal disease, invasive Group A             71
Streptococcal toxic-shock syndrome*                  3
Syphilis, congenital@                                -
Tetanus                                              1
Toxic-shock syndrome                                 5
Trichinosis                                          2
Typhoid fever                                       10
Yellow fever                                         -
------------------------------------------------------
-: no reported cases
 * Not notifiable in all states
 + Updated weekly from reports to the Division of Viral and Rickettsial
   Diseases, National Center for Infectious Diseases (NCID).
 & Updated monthly from reports to the Division of HIV/AIDS Prevention --
   Surveillance and Epidemiology, National Center for HIV, STD, and TB
   Prevention (NCHSTP), last update January 24, 1999.
 @ Updated from reports to the Division of STD Prevention, NCHSTP.

==================================================================================
Return to top. Table_II Note: To print large tables and graphs users may have to change their printer settings to landscape and use a small font size.
TABLE II. (page 1) Provisional cases of selected notifiable diseases, United States, weeks ending
February 6, 1999, and February 7, 1998 (5th Week)
Escherichia
coli O157:H7
------------------- Hepatitis
AIDS Chlamydia NETSS** PHLIS*** Gonorrhea C/NA,NB
----------------- -------------------- -------- -------- ------------------- ----------------
Cum. Cum. Cum. Cum. Cum. Cum. Cum. Cum. Cum. Cum.
Reporting Area 1999* 1998 1999 1998 1999 1999 1999 1998 1999 1998
------------------------------------------------------------------------------------------------------------------------------
UNITED STATES 3,137 3,128 38,608 51,577 92 30 24,355 32,256 137 259
NEW ENGLAND 158 64 1,190 1,995 15 10 343 640 35 8
Maine 3 2 35 28 1 - 6 5 - -
N.H. 3 - 84 86 - - 3 14 - -
Vt. - 5 22 27 - - 5 - - 1
Mass. 124 6 832 875 8 6 265 227 35 7
R.I. 9 13 211 241 - - 62 36 - -
Conn. 19 38 6 738 6 4 2 358 - -
MID. ATLANTIC 489 893 6,040 7,542 5 - 3,111 4,648 3 15
Upstate N.Y. 17 114 N N 4 - 89 579 3 13
N.Y. City 237 488 3,715 3,292 - - 1,814 1,643 - -
N.J. 162 131 303 1,099 1 - 146 743 - -
Pa. 73 160 2,022 3,151 N - 1,062 1,683 - 2
E.N. CENTRAL 179 202 6,466 8,330 21 3 4,887 6,377 11 55
Ohio 38 33 2,117 3,077 15 2 1,354 1,832 - 2
Ind. 25 38 - - 5 - 561 564 - 1
Ill. 77 101 2,395 2,019 1 - 1,484 1,898 - 9
Mich. 22 15 1,844 1,940 - - 1,418 1,561 11 43
Wis. 17 15 110 1,294 N 1 70 522 - -
W.N. CENTRAL 110 57 1,182 3,237 17 7 448 1,184 - 39
Minn. 20 15 312 658 8 6 130 258 - -
Iowa 3 6 42 244 4 1 16 57 - 1
Mo. 72 19 - 1,167 1 - - 439 - 37
N. Dak. - - - 87 - - - 10 - -
S. Dak. - 4 125 149 - - 17 22 - -
Nebr. 6 9 242 303 - - 114 117 - -
Kans. 9 4 461 629 4 - 171 281 - 1
S. ATLANTIC 883 773 10,124 9,055 11 3 8,284 8,125 18 7
Del. 13 13 266 182 - - 160 155 - -
Md. 81 52 780 648 1 - 902 764 14 2
D.C. 8 84 N N - - 299 366 - -
Va. 54 38 1,461 992 N - 1,273 759 1 1
W. Va. 10 5 163 294 - 1 54 84 - -
N.C. 69 45 2,076 1,675 2 1 1,958 1,451 - 3
S.C. 60 59 2,732 1,689 1 1 1,535 1,292 1 -
Ga. 111 113 - 1,940 - - - 1,845 - -
Fla. 477 364 2,646 1,635 3 - 2,103 1,409 2 1
E.S. CENTRAL 157 156 3,583 3,589 4 - 3,410 3,855 10 11
Ky. 15 19 - 497 - - - 389 - 2
Tenn. 64 52 1,281 1,235 3 - 1,103 1,221 9 8
Ala. 31 56 1,213 910 1 - 1,277 1,302 1 1
Miss. 47 29 1,089 947 - - 1,030 943 - -
W.S. CENTRAL 532 379 3,188 7,052 1 - 2,388 4,633 3 3
Ark. 19 17 425 256 - - 252 431 - -
La. 27 66 1,836 1,270 - - 1,617 1,063 3 -
Okla. 6 14 927 674 - - 519 403 - -
Tex. 480 282 - 4,852 1 - - 2,736 - 3
MOUNTAIN 45 87 1,826 2,392 5 1 449 744 9 30
Mont. - 5 60 61 - - 1 - - 3
Idaho 4 3 - 111 - - - 12 2 11
Wyo. - - - 77 - - - 5 - 7
Colo. 26 21 653 539 2 1 98 265 1 2
N. Mex. 4 9 471 438 1 - 97 78 3 3
Ariz. 4 33 522 813 1 - 243 314 2 -
Utah 4 13 120 173 1 - 10 19 1 3
Nev. 3 3 - 180 - - - 51 - 1
PACIFIC 584 517 5,009 8,385 13 6 1,035 2,050 48 91
Wash. 29 31 - 1,014 - 2 - 179 1 -
Oreg. 15 13 245 586 6 4 42 94 - 1
Calif. 525 468 4,552 6,397 7 - 959 1,704 47 80
Alaska 5 - 156 177 - - 27 32 - -
Hawaii 10 5 56 211 - - 7 41 - 10
Guam 1 - - 10 N - - 3 - -
P.R. 92 87 U U - U 29 59 - -
V.I. - 1 N N N U U U U U
Amer. Samoa - - U U N U U U U U
C.N.M.I. - - N N N U - 6 - -
------------------------------------------------------------------------------------------------------------------------------
N: Not notifiable U: Unavailable -: no reported cases C.N.M.I.: Commonwealth of North Mariana Islands
* Updated monthly from reports to the Division of HIV/AIDS Prevention -- Surveillance and Epidemiology, National Center for HIV,
STD, and TB Prevention, last update January 24, 1999.
** National Electronic Telecommunications System for Surveillance.
*** Public Health Laboratory Information System.
=======================================================================================================================================================
TABLE II. (page 2) Provisional cases of selected notifiable diseases, United States, weeks ending
February 6, 1999, and February 7, 1998 (5th Week)
Lyme Syphilis Rabies,
Legionellosis Disease Malaria (Primary & Secondary) Tuberculosis Animal
---------------- ---------------- ---------------- --------------------- ----------------- -------
Cum. Cum. Cum. Cum. Cum. Cum. Cum. Cum. Cum. Cum. Cum.
Reporting Area 1999 1998 1999 1998 1999 1998 1999 1998 1999 * 1998 1999
-------------------------------------------------------------------------------------------------------------------------------------------
UNITED STATES 47 101 166 267 74 115 422 679 756 870 285
NEW ENGLAND 2 4 20 27 1 6 10 10 19 22 58
Maine - - - 1 - - - - - - 4
N.H. 1 2 - - - - - 1 - - 4
Vt. - - - - - - 1 - - 1 10
Mass. - - 20 9 1 6 7 9 6 7 19
R.I. 1 - - 1 - - - - 9 2 5
Conn. - 2 - 16 - - 2 - 4 12 16
MID. ATLANTIC 8 21 62 171 17 41 17 40 89 65 69
Upstate N.Y. 1 2 13 45 6 9 1 2 - 5 40
N.Y. City - 5 - 5 - 24 10 4 30 39 U
N.J. 2 1 41 29 10 4 1 13 35 16 18
Pa. 5 13 8 92 1 4 5 21 24 5 11
E.N. CENTRAL 13 41 6 12 1 13 77 98 80 59 -
Ohio 7 13 5 8 1 1 9 26 27 13 -
Ind. 3 5 1 3 - 1 26 15 4 19 -
Ill. - 10 - - - 7 42 31 49 26 -
Mich. 3 5 - 1 - 3 - 15 - - -
Wis. - 8 U U - 1 - 11 - 1 -
W.N. CENTRAL 1 7 3 3 5 4 1 12 17 18 31
Minn. - - - - - - - - 13 6 9
Iowa 1 - 1 3 2 - - - - - 6
Mo. - 3 - - 3 3 - 7 3 10 -
N. Dak. - - 1 - - - - - - - 10
S. Dak. - - - - - - - - 1 - -
Nebr. - 4 - - - - 1 2 - - -
Kans. - - 1 - - 1 - 3 - 2 6
S. ATLANTIC 12 9 38 40 24 23 168 242 58 110 111
Del. 1 1 - - - 1 1 - - - -
Md. - 3 30 39 10 12 27 70 15 11 21
D.C. - 1 1 1 5 2 1 7 4 10 -
Va. 2 2 - - 2 1 17 27 - 5 29
W. Va. N N - - - - 1 - - 9 -
N.C. 2 1 7 - 1 2 62 53 19 39 35
S.C. 1 - - - - - 24 30 20 26 8
Ga. - - - - - 3 - 25 - 10 -
Fla. 6 1 - - 6 2 35 30 - - 18
E.S. CENTRAL 2 4 5 4 1 1 101 120 36 87 7
Ky. - 3 - - - - - 9 - 9 -
Tenn. 2 - 2 4 1 - 49 61 - 29 7
Ala. - - 3 - - - 34 26 34 33 -
Miss. - 1 - - - 1 18 24 2 16 -
W.S. CENTRAL - - - - 2 2 41 88 7 155 -
Ark. - - - - - - 5 14 - - -
La. - - - - 1 2 18 36 - - -
Okla. - - - - - - 18 6 7 8 -
Tex. - - - - 1 - - 32 - 147 -
MOUNTAIN 3 7 - - 3 5 - 27 16 29 5
Mont. - - - - 1 - - - - - 1
Idaho - - - - - - - - - - -
Wyo. - - - - - - - - - - -
Colo. 1 2 - - - 3 - 2 - 5 1
N. Mex. - 1 - - 1 2 - 2 3 2 -
Ariz. - - - - 1 - - 19 5 11 3
Utah 2 4 - - - - - 2 8 - -
Nev. - - - - - - - 2 - 11 -
PACIFIC 6 8 32 10 20 20 7 42 434 325 4
Wash. - - - - 1 - - 1 22 19 -
Oreg. - - - - - 3 - 1 5 10 -
Calif. 6 8 32 10 18 17 7 40 391 286 4
Alaska - - - - - - - - 4 3 -
Hawaii - - - - 1 - - - 12 7 -
Guam - - - - - - - - - 4 -
P.R. - - - - - - 28 23 - 3 4
V.I. U U U U U U U U U U U
Amer. Samoa U U U U U U U U U U U
C.N.M.I. - - - - - - - 1 - 6 -
-------------------------------------------------------------------------------------------------------------------------------------------
N: Not notifiable U: Unavailable -: no reported cases
=======================================================================================================================================================
Return to top. Table_III Note: To print large tables and graphs users may have to change their printer settings to landscape and use a small font size.
TABLE III. (page 1) Provisional cases of selected notifiable diseases preventable by vaccination, United
States, weeks ending February 6, 1999, and February 7, 1998 (5th Week)
Hepatitis (Viral), by type Measles (Rubeola)
H. influenzae, --------------------------------------- ------------------------------------------------------------
invasive A B Indigenous Imported** Total
---------------- ----------------- ----------------- --------------- --------------- ---------------
Cum. Cum. Cum. Cum. Cum. Cum. Cum. Cum. Cum. Cum.
Reporting Area 1999* 1998 1999 1998 1999 1998 1999 1999 1999 1999 1999 1998
-----------------------------------------------------------------------------------------------------------------------------------------------------
UNITED STATES 67 110 942 1,611 378 760 - 7 - 2 9 1
NEW ENGLAND 3 9 10 43 4 10 - - - - - 1
Maine - - 1 5 - - - - - - - -
N.H. 1 1 1 3 - 1 - - - - - -
Vt. 1 - - 1 - - - - - - - -
Mass. 1 8 5 11 2 5 - - - - - 1
R.I. - - - 2 2 - - - - - - -
Conn. - - 3 21 - 4 - - - - - -
MID. ATLANTIC 11 12 47 110 39 114 - - - - - -
Upstate N.Y. 9 4 9 27 13 23 - - - - - -
N.Y. City - 4 5 43 1 27 - - - - - -
N.J. 2 4 15 19 8 22 - - - - - -
Pa. - - 18 21 17 42 - - - - - -
E.N. CENTRAL 9 20 134 320 17 219 - - - - - -
Ohio 8 8 56 49 12 9 - - - - - -
Ind. - 2 27 41 4 106 - - - - - -
Ill. 1 9 4 88 - 30 - - - - - -
Mich. - - 47 123 1 58 U - U - - -
Wis. - 1 - 19 - 16 U - U - - -
W.N. CENTRAL 3 - 15 162 4 45 - - - - - -
Minn. - - - - - - - - - - - -
Iowa 1 - 5 53 1 8 - - - - - -
Mo. - - 3 99 - 34 - - - - - -
N. Dak. - - - - - - - - - - - -
S. Dak. 1 - - 1 - 1 - - - - - -
Nebr. - - 4 2 2 - - - - - - -
Kans. 1 - 3 7 1 2 - - - - - -
S. ATLANTIC 25 18 111 82 66 45 - - - - - -
Del. - - - - - - - - - - - -
Md. 15 7 35 32 17 17 - - - - - -
D.C. - - 6 2 - 1 - - - - - -
Va. - 3 8 14 6 5 - - - - - -
W. Va. - 1 - - - - - - - - - -
N.C. 2 1 10 9 26 16 - - - - - -
S.C. 1 - - 5 7 - - - - - - -
Ga. - 6 21 11 2 5 - - - - - -
Fla. 7 - 31 9 8 1 - - - - - -
E.S. CENTRAL 2 9 38 49 19 42 - - - - - -
Ky. - 2 - 2 - 1 U - U - - -
Tenn. 2 2 21 23 12 31 - - - - - -
Ala. - 5 16 12 7 10 - - - - - -
Miss. - - 1 12 - - - - - - - -
W.S. CENTRAL 3 4 34 107 13 50 - - - 2 2 -
Ark. - - 3 1 5 10 - - - - - -
La. 1 2 2 2 - 1 - - - - - -
Okla. 1 1 2 36 - 3 - - - - - -
Tex. 1 1 27 68 8 36 - - - 2 2 -
MOUNTAIN 6 24 100 293 53 81 - 1 - - 1 -
Mont. - - - 6 - 1 - - - - - -
Idaho - - 1 15 4 3 - - - - - -
Wyo. - - - 3 - 1 U - U - - -
Colo. - 1 34 26 14 10 - 1 - - 1 -
N. Mex. 2 - 5 19 24 27 - - - - - -
Ariz. - 14 50 176 6 20 - - - - - -
Utah 4 1 10 19 5 8 - - - - - -
Nev. - 8 - 29 - 11 U - U - - -
PACIFIC 5 14 453 445 163 154 - 6 - - 6 -
Wash. - - 5 38 - 12 - - - - - -
Oreg. 4 7 6 35 4 12 - 6 - - 6 -
Calif. - 6 440 367 157 126 - - - - - -
Alaska 1 - 1 - 2 1 - - - - - -
Hawaii - 1 1 5 - 3 - - - - - -
Guam - - - - - - U - U - - -
P.R. - 1 4 2 3 35 - - - - - -
V.I. U U U U U U U U U U U U
Amer. Samoa U U U U U U U U U U U U
C.N.M.I. - - - - - 6 U - U - - -
-----------------------------------------------------------------------------------------------------------------------------------------------------
N: Not notifiable U: Unavailable -: no reported cases
* Of 7 cases among children aged <5 years, serotype was reported for 1 which was not type b.
** For imported measles, cases include only those resulting from importation from other countries.
=======================================================================================================================================================
TABLE III. (page 2) Provisional cases of selected notifiable diseases preventable by vaccination, United
States, weeks ending February 6, 1999, and February 7, 1998 (5th Week)
Meningococcal
Disease Mumps Pertussis Rubella
----------------- -------------------------- --------------------------- ---------------------------
Cum. Cum. Cum. Cum. Cum. Cum. Cum. Cum.
Reporting Area 1999 1998 1999 1999 1998 1999 1999 1998 1999 1999 1998
------------------------------------------------------------------------------------------------------------------------------------------
UNITED STATES 178 329 14 29 28 31 185 346 - 3 14
NEW ENGLAND 14 24 - 1 - 2 32 75 - - -
Maine 2 1 - - - - - 4 - - -
N.H. - 1 - 1 - - 1 7 - - -
Vt. 1 1 - - - 2 7 17 - - -
Mass. 11 8 - - - - 24 46 - - -
R.I. - 3 - - - - - - - - -
Conn. - 10 - - - - - 1 - - -
MID. ATLANTIC 18 32 - 2 1 3 7 22 - - 11
Upstate N.Y. 3 5 - - 1 3 7 19 - - 10
N.Y. City 4 6 - - - - - - - - -
N.J. 7 13 - - - - - 3 - - 1
Pa. 4 8 - 2 - - - - - - -
E.N. CENTRAL 27 56 1 1 4 4 40 48 - - -
Ohio 16 25 1 1 3 3 39 18 - - -
Ind. 6 6 - - - 1 1 1 - - -
Ill. 5 17 - - - - - - - - -
Mich. - 3 U - 1 U - 8 U - -
Wis. - 5 U - - U - 21 U - -
W.N. CENTRAL 11 22 - 1 - 1 3 15 - - -
Minn. - - - - - - - 6 - - -
Iowa 3 2 - 1 - - 1 4 - - -
Mo. 3 10 - - - 1 1 - - - -
N. Dak. - - - - - - - - - - -
S. Dak. 3 3 - - - - 1 - - - -
Nebr. - 1 - - - - - 2 - - -
Kans. 2 6 - - - - - 3 - - -
S. ATLANTIC 36 46 1 4 7 4 22 28 - 3 1
Del. - - - - - - - - - - -
Md. 6 7 - - - - 9 5 - - -
D.C. - - - - - - - - - - -
Va. 2 6 - - - - 1 - - - -
W. Va. - 2 - - - - - - - - -
N.C. 3 4 - 1 4 3 10 23 - 3 1
S.C. 5 5 1 2 2 1 2 - - - -
Ga. 2 16 - - - - - - - - -
Fla. 18 6 - 1 1 - - - - - -
E.S. CENTRAL 14 28 - - - 1 7 10 - - -
Ky. - 7 U - - U - - U - -
Tenn. 7 9 - - - 1 4 2 - - -
Ala. 7 10 - - - - 3 8 - - -
Miss. - 2 - - - - - - - - -
W.S. CENTRAL 5 20 6 8 5 1 9 8 - - 1
Ark. - 4 - - - - 3 2 - - -
La. 4 4 - - - - - - - - -
Okla. - 11 - - - - - - - - -
Tex. 1 1 6 8 5 1 6 6 - - 1
MOUNTAIN 16 26 2 2 2 13 59 87 - - -
Mont. - 1 - - - - - 1 - - -
Idaho 2 1 - - - 5 36 36 - - -
Wyo. - 1 U - - U - - U - -
Colo. 3 10 1 1 - 1 2 13 - - -
N. Mex. 3 3 N N N 1 6 34 - - -
Ariz. 5 8 - - 1 1 2 - - - -
Utah 3 1 1 1 - 5 13 2 - - -
Nev. - 1 U - 1 U - 1 U - -
PACIFIC 37 75 4 10 9 2 6 53 - - 1
Wash. 3 8 - - - - 2 5 - - -
Oreg. 3 22 N N N 1 3 8 - - -
Calif. 27 44 3 8 3 - - 40 - - 1
Alaska 3 - 1 1 2 1 1 - - - -
Hawaii 1 1 - 1 4 - - - - - -
Guam - - U - - U - - U - -
P.R. - - - - - - - - - - -
V.I. U U U U U U U U U U U
Amer. Samoa U U U U U U U U U U U
C.N.M.I. - - U - - U - - U - -
------------------------------------------------------------------------------------------------------------------------------------------
N: Not notifiable U: Unavailable -: no reported cases
=======================================================================================================================================================
Return to top. Table_IV Note: To print large tables and graphs users may have to change their printer settings to landscape and use a small font size.
TABLE IV. Deaths in 122 U.S. cities,* week ending
February 6, 1999 (5th Week)
===================================================================================================================================
All Causes, By Age (Years)
------------------------------------------------------------------------ P&I**
Reporting Area All Ages >=65 45-64 25-44 1-24 <1 Total
---------------------------------------------------------------------------------------------------------------
NEW ENGLAND 600 452 98 26 13 11 73
Boston, Mass. 172 114 36 12 8 2 15
Bridgeport, Conn. 45 34 6 1 3 1 3
Cambridge, Mass. 21 17 3 1 - - 4
Fall River, Mass. 32 27 4 1 - - 4
Hartford, Conn. 75 54 17 3 - 1 12
Lowell, Mass. 33 29 3 1 - - 6
Lynn, Mass. 5 5 - - - - -
New Bedford, Mass. 24 20 4 - - - 4
New Haven, Conn. 45 31 9 - - 5 3
Providence, R.I. U U U U U U U
Somerville, Mass. 4 2 2 - - - -
Springfield, Mass. 48 42 3 1 - 2 5
Waterbury, Conn. 42 35 4 2 1 - 7
Worcester, Mass. 54 42 7 4 1 - 10
MID. ATLANTIC 2,829 2,070 496 187 44 32 112
Albany, N.Y. 56 42 9 2 2 1 3
Allentown, Pa. 27 21 5 - 1 - 2
Buffalo, N.Y. U U U U U U U
Camden, N.J. 33 22 5 4 - 2 5
Elizabeth, N.J. 13 5 5 3 - - -
Erie, Pa. 56 45 6 5 - - 4
Jersey City, N.J. 63 46 12 5 - - -
New York City, N.Y. 1,653 1,215 291 104 24 19 9
Newark, N.J. 56 29 12 12 2 1 5
Paterson, N.J. 29 24 4 - - 1 1
Philadelphia, Pa. 399 258 90 40 11 - 27
Pittsburgh, Pa.*** 44 32 7 3 1 1 3
Reading, Pa. 40 33 5 1 1 - 7
Rochester, N.Y. 152 129 16 4 2 1 20
Schenectady, N.Y. 26 20 4 2 - - 4
Scranton, Pa. 36 32 2 - - 2 -
Syracuse, N.Y. 94 73 16 1 - 4 15
Trenton, N.J. 31 25 5 1 - - 6
Utica, N.Y. 21 19 2 - - - 1
Yonkers, N.Y. U U U U U U U
E.N. CENTRAL 2,325 1,612 412 170 60 68 163
Akron, Ohio 61 46 3 7 2 3 2
Canton, Ohio 32 23 6 - 2 1 1
Chicago, Ill. 521 328 108 49 15 18 44
Cincinnati, Ohio 120 92 16 5 2 5 13
Cleveland, Ohio 154 101 31 12 4 6 5
Columbus, Ohio 221 152 40 18 4 7 18
Dayton, Ohio 151 112 22 8 6 3 12
Detroit, Mich. 236 141 54 31 5 5 13
Evansville, Ind. U U U U U U U
Fort Wayne, Ind. 67 54 9 2 - 2 4
Gary, Ind. 33 14 8 3 6 2 2
Grand Rapids, Mich. 52 40 2 3 4 3 5
Indianapolis, Ind. 162 116 24 11 7 4 2
Lansing, Mich. 41 24 11 4 1 1 4
Milwaukee, Wis. 137 111 18 5 - 3 15
Peoria, Ill. 51 40 8 2 1 - 3
Rockford, Ill. 63 43 13 4 - 3 6
South Bend, Ind. 56 40 14 1 1 - 1
Toledo, Ohio 116 100 12 3 - 1 8
Youngstown, Ohio 51 35 13 2 - 1 5
W.N. CENTRAL 716 522 119 36 18 21 63
Des Moines, Iowa U U U U U U U
Duluth, Minn. 19 14 3 - 2 - 1
Kansas City, Kans. U U U U U U U
Kansas City, Mo. 98 72 12 8 2 4 11
Lincoln, Nebr. 40 30 6 4 - - 2
Minneapolis, Minn. 227 173 33 11 7 3 26
Omaha, Nebr. 89 57 19 3 3 7 7
St. Louis, Mo. 120 83 26 5 2 4 5
St. Paul, Minn. 123 93 20 5 2 3 11
Wichita, Kans. U U U U U U U
S. ATLANTIC 1,300 873 251 115 33 27 80
Atlanta, Ga. U U U U U U U
Baltimore, Md. 270 171 53 32 7 6 17
Charlotte, N.C. 128 83 29 11 4 1 12
Jacksonville, Fla. 166 112 34 14 5 1 7
Miami, Fla. 105 76 20 4 5 - 1
Norfolk, Va. 69 39 13 5 4 8 3
Richmond, Va. 85 54 17 7 2 5 5
Savannah, Ga. 59 41 12 2 2 2 10
St. Petersburg, Fla. 63 50 9 3 - 1 6
Tampa, Fla. 238 173 48 12 2 3 12
Washington, D.C. 102 69 14 17 2 - 7
Wilmington, Del. 15 5 2 8 - - -
E.S. CENTRAL 1,030 680 220 67 38 20 73
Birmingham, Ala. 243 158 49 17 7 7 26
Chattanooga, Tenn. 87 60 23 4 - - 8
Knoxville, Tenn. 106 68 25 9 3 1 4
Lexington, Ky. 59 38 15 1 3 2 3
Memphis, Tenn. 194 125 38 16 9 6 20
Mobile, Ala. 107 76 17 7 6 1 2
Montgomery, Ala. 59 38 13 4 3 1 5
Nashville, Tenn. 175 117 40 9 7 2 5
W.S. CENTRAL 1,773 1,182 348 149 58 36 116
Austin, Tex. 89 68 15 5 1 - 3
Baton Rouge, La. 75 58 8 7 2 - -
Corpus Christi, Tex. 60 45 10 3 - 2 4
Dallas, Tex. 185 118 42 16 5 4 5
El Paso, Tex. 92 61 18 10 2 1 6
Ft. Worth, Tex. 138 95 26 8 6 3 12
Houston, Tex. 427 261 95 39 20 12 35
Little Rock, Ark. 73 50 17 3 3 - 7
New Orleans, La. 141 81 24 23 8 5 -
San Antonio, Tex. 242 168 46 21 5 2 20
Shreveport, La. 106 70 20 10 4 2 13
Tulsa, Okla. 145 107 27 4 2 5 11
MOUNTAIN 945 681 178 57 16 13 89
Albuquerque, N.M. 139 103 23 7 3 3 9
Boise, Idaho 51 34 11 4 1 1 5
Colo. Springs, Colo. 67 47 13 4 - 3 2
Denver, Colo. 108 67 26 10 4 1 13
Las Vegas, Nev. 222 165 42 11 3 1 19
Ogden, Utah 23 18 4 1 - - 3
Phoenix, Ariz. 122 85 25 6 3 3 8
Pueblo, Colo. 33 28 4 1 - - 7
Salt Lake City, Utah U U U U U U U
Tucson, Ariz. 180 134 30 13 2 1 23
PACIFIC 1,125 830 191 58 29 16 118
Berkeley, Calif. 13 12 1 - - - 1
Fresno, Calif. 101 71 23 3 4 - 10
Glendale, Calif. U U U U U U U
Honolulu, Hawaii 80 61 12 4 2 1 8
Long Beach, Calif. 78 56 13 2 3 4 14
Los Angeles, Calif. U U U U U U U
Pasadena, Calif. 37 29 6 1 - 1 4
Portland, Oreg. 149 113 22 5 5 4 7
Sacramento, Calif. U U U U U U U
San Diego, Calif. 163 122 24 10 4 3 17
San Francisco, Calif. 149 112 29 6 2 - 28
San Jose, Calif. U U U U U U U
Santa Cruz, Calif. 44 35 7 2 - - 9
Seattle, Wash. 161 111 26 17 5 2 4
Spokane, Wash. 70 54 10 2 3 1 9
Tacoma, Wash. 80 54 18 6 1 - 7
TOTAL 12,643**** 8,902 2,313 865 309 244 887
---------------------------------------------------------------------------------------------------------------
U: Unavailable -: no reported cases
* Mortality data in this table are voluntarily reported from 122 cities in the United States, most of which have populations
of 100,000 or more. A death is reported by the place of its occurrence and by the week that the death certificate was
filed. Fetal deaths are not included.
** Pneumonia and influenza.
*** Because of changes in reporting methods in this Pennsylvania city, these numbers are partial counts for the current
week. Complete counts will be available in 4 to 6 weeks.
**** Total includes unknown ages.
===================================================================================================================================
Return to top. Disclaimer All MMWR HTML versions of articles are electronic conversions from ASCII text into HTML. This conversion may have resulted in character translation or format errors in the HTML version. Users should not rely on this HTML document, but are referred to the electronic PDF version and/or the original MMWR paper copy for the official text, figures, and tables. An original paper copy of this issue can be obtained from the Superintendent of Documents, U.S. Government Printing Office (GPO), Washington, DC 20402-9371; telephone: (202) 512-1800. Contact GPO for current prices. **Questions or messages regarding errors in formatting should be addressed to mmwrq@cdc.gov.Page converted: 02/11/99 |
|||||||||
This page last reviewed 5/2/01
|