 |
|
|
|
|
|
|
| ||||||||||
|
|
|
|
|
|
|
||||
| ||||||||||
|
|
|
|
|
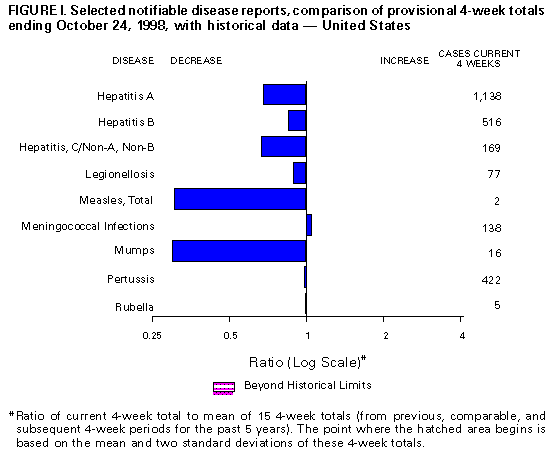
Persons using assistive technology might not be able to fully access information in this file. For assistance, please send e-mail to: mmwrq@cdc.gov. Type 508 Accommodation and the title of the report in the subject line of e-mail. Notifiable Diseases/Deaths in Selected Cities Weekly InformationFigure_I Selected notifiable disease reports, comparison of provisional 4-week totals ending October 24, 1998, with historical data -- United States Table_I Summary -- provisional cases of selected notifiable diseases, United States, cumulative, week ending October 24, 1998 (42nd Week) Table_II Provisional cases of selected notifiable diseases, United States, weeks ending October 24, 1998 and October 18, 1997 (42nd Week) Table_III Provisional cases of selected notifiable diseases preventable by vaccination, United States, weeks ending October 24, 1998 and October 18, 1997 (42nd Week) Table_IV Deaths in 122 U.S. cities, week ending
October 24, 1998 (42nd Week)
TABLE I. Summary -- provisional cases of specified notifiable diseases, United
States, cumulative, week ending October 24, 1998 (42nd Week)
==================================================================================
                                             Cum. 1998
------------------------------------------------------
Anthrax                                              -
Brucellosis                                         43
Cholera                                              7
Congenital rubella syndrome                          3
Cryptosporidiosis*                               2,678
Diphtheria                                           1
Encephalitis:  California*                          78
               eastern equine*                       4
               St. Louis*                           20
               western equine*                       -
Hansen Disease                                      92
Hantavirus pulmonary syndrome*+                     15
Hemolytic uremic syndrome, post-diarrheal*          61
HIV infection, pediatric*&                         178
Plague                                               7
Poliomyelitis, paralytic                             1
Psittacosis                                         36
Rabies, human                                        -
Rocky Mountain spotted fever (RMSF)                271
Streptococcal disease, invasive Group A          1,775
Streptococcal toxic-shock syndrome*                 44
Syphilis, congenital@                              307
Tetanus                                             34
Toxic-shock syndrome                               108
Trichinosis                                         10
Typhoid fever                                      271
Yellow fever                                         -
------------------------------------------------------
-: no reported cases
 * Not notifiable in all states
 + Updated weekly from reports to the Division of Viral and Rickettsial
   Diseases, National Center for Infectious Diseases (NCID).
 & Updated monthly to the Division of HIV/AIDS Prevention -- Surveillance
   and Epidemiology, National Center for HIV, STD, and TB Prevention
   (NCHSTP), last update September 27, 1998.
 @ Updated from reports to the Division of STD Prevention, NCHSTP.

==================================================================================
Return to top. Table_II Note: To print large tables and graphs users may have to change their printer settings to landscape and use a small font size.
TABLE II. (page 1) Provisional cases of selected notifiable diseases, United States, weeks ending
October 24, 1998, and October 18, 1997 (42nd Week)
Escherichia
coli O157:H7
------------------- Hepatitis
AIDS* Chlamydia NETSS** PHLIS*** Gonorrhea C\NA,NB
----------------- -------------------- -------- -------- ------------------- ----------------
Cum. Cum. Cum. Cum. Cum. Cum. Cum. Cum. Cum. Cum.
Reporting Area 1998 1997 1998 1997 1998 1998 1998 1997 1998 1997
------------------------------------------------------------------------------------------------------------------------------
UNITED STATES 35,486 45,134 430,743 374,873 2,446 1,623 258,503 236,724 3,261 2,839
NEW ENGLAND 1,381 1,895 15,141 14,421 284 228 4,336 4,817 71 49
Maine 24 46 825 822 33 - 57 59 - -
N.H. 28 29 757 651 41 42 75 78 - -
Vt. 17 31 338 340 18 15 33 44 - 3
Mass. 712 640 6,817 5,865 133 132 1,819 1,720 68 39
R.I. 94 119 1,808 1,626 11 1 299 368 3 7
Conn. 506 1,030 4,596 5,117 48 38 2,053 2,548 - -
MID. ATLANTIC 9,642 13,768 49,541 46,166 247 65 29,053 30,677 298 260
Upstate N.Y. 1,102 2,133 N N 188 - 4,969 5,269 234 189
N.Y. City 5,457 7,287 28,264 22,005 7 12 12,600 11,411 - -
N.J. 1,765 2,742 8,191 8,064 52 43 5,240 6,167 - -
Pa. 1,318 1,606 13,086 16,097 N 10 6,244 7,830 64 71
E.N. CENTRAL 2,567 3,369 70,146 50,699 378 275 49,991 32,488 415 465
Ohio 540 722 20,734 17,978 103 59 13,452 11,713 7 16
Ind. 414 444 4,656 7,464 80 41 3,782 4,962 5 12
Ill. 993 1,346 19,539 U 95 39 16,354 U 28 76
Mich. 468 648 16,763 16,363 100 62 12,733 11,937 375 336
Wis. 152 209 8,454 8,894 N 74 3,670 3,876 - 25
W.N. CENTRAL 664 902 24,349 26,472 451 342 12,171 11,494 260 50
Minn. 136 156 5,068 5,367 218 181 1,931 1,864 9 3
Iowa 58 85 2,063 3,712 87 49 660 941 8 25
Mo. 312 446 9,850 9,789 40 56 6,967 5,874 238 9
N. Dak. 4 10 616 693 10 15 51 56 - 2
S. Dak. 13 8 1,249 1,082 25 31 189 121 - -
Nebr. 59 83 1,509 2,145 45 - 508 945 3 2
Kans. 82 114 3,994 3,684 26 10 1,865 1,693 2 9
S. ATLANTIC 9,235 11,113 86,312 75,037 202 138 71,374 74,284 149 202
Del. 112 183 2,079 6 - 2 1,214 985 - -
Md. 1,304 1,682 6,029 5,698 28 12 7,482 9,426 8 7
D.C. 691 828 N N 1 - 2,806 3,553 - -
Va. 688 880 10,912 9,266 N 42 7,337 6,788 11 24
W. Va. 70 88 2,079 2,336 8 6 640 733 6 16
N.C. 638 680 17,547 13,854 46 44 15,296 13,752 19 42
S.C. 604 621 13,833 10,148 11 8 8,720 9,408 5 35
Ga. 972 1,265 18,562 12,561 66 - 15,748 14,734 9 -
Fla. 4,156 4,886 15,271 21,168 42 24 12,131 14,905 91 78
E.S. CENTRAL 1,444 1,554 31,637 28,076 103 36 31,119 28,211 171 294
Ky. 222 292 5,166 5,136 30 - 3,004 3,319 18 12
Tenn. 522 631 10,886 10,186 48 31 9,478 8,874 146 196
Ala. 395 384 8,202 6,934 22 2 10,528 9,657 5 10
Miss. 305 247 7,383 5,820 3 3 8,109 6,361 2 76
W.S. CENTRAL 4,202 4,686 65,179 53,628 103 22 38,859 34,911 403 410
Ark. 159 180 3,017 2,417 10 10 2,573 4,066 13 11
La. 708 813 11,978 7,745 5 6 10,154 7,539 82 179
Okla. 238 240 7,974 6,089 13 6 4,383 3,936 12 7
Tex. 3,097 3,453 42,210 37,377 75 - 21,749 19,370 296 213
MOUNTAIN 1,230 1,290 25,934 23,658 295 207 7,296 6,492 307 255
Mont. 23 35 1,043 863 15 - 32 48 7 20
Idaho 19 41 1,626 1,319 35 22 142 121 87 53
Wyo. 1 13 570 476 53 54 27 44 57 64
Colo. 230 313 6,631 5,743 72 56 1,888 1,841 28 28
N. Mex. 179 141 2,763 3,090 17 13 679 705 82 47
Ariz. 499 317 9,261 8,420 21 26 3,337 2,817 11 25
Utah 101 110 1,709 1,390 71 21 182 224 23 4
Nev. 178 320 2,331 2,357 11 15 1,009 692 12 14
PACIFIC 5,121 6,557 62,504 56,716 383 310 14,304 13,350 1,187 854
Wash. 335 527 8,635 7,356 83 104 1,554 1,561 21 22
Oreg. 138 249 4,714 3,950 96 94 670 596 5 3
Calif. 4,500 5,687 45,762 42,767 199 99 11,442 10,471 1,106 687
Alaska 17 43 1,506 1,213 5 - 253 311 1 -
Hawaii 131 51 1,887 1,430 N 13 385 411 54 142
Guam - 2 201 193 N - 24 27 - -
P.R. 1,246 1,510 U U 6 U 296 478 - -
V.I. 24 79 N N N U U U U U
Amer. Samoa - - U U N U U U U U
C.N.M.I. - 1 N N N U 28 20 - 2
------------------------------------------------------------------------------------------------------------------------------
N: Not notifiable U: Unavailable -: no reported cases C.N.M.I.: Commonwealth of North Mariana Islands
* Updated monthly to the Division of HIV/AIDS Prevention, -- Surveillance and Epidemiology, National Center for HIV, STD,
and TB Prevention, last update September 27, 1998.
** National Electronic Telecommunications System for Surveillance.
*** Public Health Laboratory Information System.
=======================================================================================================================================================
TABLE II. (page 2) Provisional cases of selected notifiable diseases, United States, weeks ending
October 24, 1998, and October 18, 1997 (42nd Week)
Lyme Syphilis Rabies,
Legionellosis Disease Malaria (Primary & Secondary) Tuberculosis Animal
---------------- ---------------- ---------------- --------------------- ----------------- -------
Cum. Cum. Cum. Cum. Cum. Cum. Cum. Cum. Cum. Cum. Cum.
Reporting Area 1998 1997 1998 1997 1998 1997 1998 1997 1998 * 1997 1998
-------------------------------------------------------------------------------------------------------------------------------------------
UNITED STATES 968 799 9,970 9,985 1,083 1,497 5,497 6,924 11,657 14,303 5,661
NEW ENGLAND 69 70 2,417 2,653 53 74 62 116 359 355 1,199
Maine 1 3 11 8 5 1 1 - 10 17 186
N.H. 5 7 38 33 5 8 2 - 9 13 69
Vt. 5 11 8 8 1 2 4 - 2 5 56
Mass. 28 25 687 275 16 27 36 58 203 201 422
R.I. 19 7 508 356 8 5 1 2 41 30 80
Conn. 11 17 1,165 1,973 18 31 18 56 94 89 386
MID. ATLANTIC 213 159 6,292 5,725 262 441 217 330 2,281 2,513 1,285
Upstate N.Y. 74 46 3,492 2,371 82 61 33 31 298 341 915
N.Y. City 25 18 19 151 112 277 59 71 1,202 1,275 U
N.J. 11 21 1,402 1,680 44 80 67 134 487 521 170
Pa. 103 74 1,379 1,523 24 23 58 94 294 376 200
E.N. CENTRAL 295 260 110 514 109 141 809 536 1,018 1,438 119
Ohio 111 93 71 35 14 17 116 182 81 228 52
Ind. 61 43 33 25 10 15 166 148 89 124 9
Ill. 27 27 5 12 35 57 316 U 524 747 14
Mich. 65 63 1 24 43 37 160 111 306 249 34
Wis. 31 34 U 418 7 15 51 95 18 90 10
W.N. CENTRAL 64 45 176 116 76 46 104 153 318 453 596
Minn. 6 2 144 88 42 19 7 16 119 120 104
Iowa 10 9 21 5 8 9 - 7 38 46 134
Mo. 22 12 2 16 15 9 79 101 91 183 24
N. Dak. - 2 - - 2 3 - - 8 10 122
S. Dak. 3 2 - 1 - 1 1 - 16 10 130
Nebr. 16 14 3 2 1 1 4 3 13 19 7
Kans. 7 4 6 4 8 4 13 26 33 65 75
S. ATLANTIC 117 99 720 670 266 263 1,994 2,834 1,638 2,686 1,647
Del. 12 10 34 109 3 5 20 17 18 27 17
Md. 24 17 517 435 75 75 539 765 235 249 397
D.C. 6 4 4 7 16 15 63 95 83 78 -
Va. 17 21 56 52 49 63 121 198 222 254 481
W. Va. N N 11 7 2 - 2 3 32 47 65
N.C. 11 13 48 31 23 16 608 755 351 344 136
S.C. 10 7 5 2 6 16 240 315 207 272 121
Ga. 8 - 5 1 34 30 234 440 420 494 259
Fla. 27 27 40 26 58 43 167 246 70 921 171
E.S. CENTRAL 55 45 78 80 26 34 1,007 1,452 847 1,050 235
Ky. 24 10 20 14 4 12 87 114 136 154 28
Tenn. 19 25 41 37 14 7 468 628 243 362 121
Ala. 5 3 16 9 6 10 236 365 302 334 84
Miss. 7 7 1 20 2 5 216 345 166 200 2
W.S. CENTRAL 39 26 23 73 27 48 867 1,075 1,776 2,040 131
Ark. - 1 6 18 1 5 90 130 114 153 31
La. 3 3 4 3 14 12 347 301 200 183 -
Okla. 12 2 2 19 4 6 105 107 140 171 100
Tex. 24 20 11 33 8 25 325 537 1,322 1,533 -
MOUNTAIN 62 53 15 11 50 62 200 141 347 464 188
Mont. 2 1 - - 1 2 - - 18 6 47
Idaho 2 2 4 3 8 - 2 1 12 10 -
Wyo. 1 1 1 2 - 2 1 - 4 2 55
Colo. 16 18 5 - 19 27 11 12 U 71 35
N. Mex. 2 2 3 1 12 8 22 8 51 55 5
Ariz. 16 12 - 2 8 11 151 105 155 207 18
Utah 20 10 - 1 1 3 4 5 46 26 26
Nev. 3 7 2 2 1 9 9 10 61 87 2
PACIFIC 54 42 139 143 214 388 237 287 3,073 3,304 261
Wash. 9 7 7 8 17 19 27 9 177 245 -
Oreg. - - 20 17 16 19 5 9 117 123 7
Calif. 43 34 111 116 176 338 203 267 2,611 2,732 231
Alaska 1 - 1 2 2 3 1 1 35 61 23
Hawaii 1 1 - - 3 9 1 1 133 143 -
Guam 2 - - - 1 - 1 3 36 13 -
P.R. - - - - - 5 155 205 68 164 44
V.I. U U U U U U U U U U U
Amer. Samoa U U U U U U U U U U U
C.N.M.I. - - - - - - 164 9 77 6 -
-------------------------------------------------------------------------------------------------------------------------------------------
N: Not notifiable U: Unavailable -: no reported cases
* Additional information about areas displaying 'U' for cumulative Tuberculosis cases can be found in Notices to Readers, MMWR Vol. 47, No. 2, p. 39.
=======================================================================================================================================================
Return to top. Table_III Note: To print large tables and graphs users may have to change their printer settings to landscape and use a small font size.
TABLE III. (page 1) Provisional cases of selected notifiable diseases preventable by vaccination, United
States, weeks ending October 24, 1998, and October 18, 1997 (42nd Week)
Hepatitis (Viral), by type Measles (Rubeola)
H. influenzae, --------------------------------------- ------------------------------------------------------------
invasive A B Indigenous Imported** Total
---------------- ----------------- ----------------- --------------- --------------- ---------------
Cum. Cum. Cum. Cum. Cum. Cum. Cum. Cum. Cum. Cum.
Reporting Area 1998* 1997 1998 1997 1998 1997 1998 1998 1998 1998 1998 1997
-----------------------------------------------------------------------------------------------------------------------------------------------------
UNITED STATES 850 874 17,514 22,974 6,561 7,626 - 54 - 21 75 123
NEW ENGLAND 59 50 214 560 137 146 - 1 - 2 3 19
Maine 3 5 16 52 2 6 - - - - - 1
N.H. 9 9 10 27 16 14 - - - - - 1
Vt. 7 3 14 11 4 8 - - - 1 1 -
Mass. 34 29 84 229 39 61 - 1 - 1 2 16
R.I. 5 2 14 123 58 14 - - - - - -
Conn. 1 2 76 118 18 43 - - - - - 1
MID. ATLANTIC 122 138 1,162 1,713 874 1,099 - 8 - 5 13 26
Upstate N.Y. 49 44 298 275 238 239 - 1 - 1 2 5
N.Y. City 26 37 291 780 230 399 - - - - - 10
N.J. 42 40 278 246 168 202 U 7 U 1 8 3
Pa. 5 17 295 412 238 259 U - U 3 3 8
E.N. CENTRAL 141 143 2,668 2,394 776 1,195 - 11 - 3 14 10
Ohio 45 76 263 266 66 62 - - - 1 1 -
Ind. 36 14 140 245 173 85 - 2 - 1 3 -
Ill. 47 36 447 658 130 225 - - - - - 7
Mich. 7 16 1,676 1,061 378 350 - 9 - 1 10 2
Wis. 6 1 142 164 29 473 - - - - - 1
W.N. CENTRAL 79 39 1,190 1,814 351 388 - 1 - - 1 17
Minn. 62 27 110 166 41 35 - - - - - 8
Iowa 2 5 383 385 60 32 - 1 - - 1 -
Mo. 8 4 543 927 210 277 - - - - - 1
N. Dak. - - 3 10 4 5 - - - - - -
S. Dak. - 2 28 19 2 1 - - - - - 8
Nebr. 1 1 36 75 12 12 - - - - - -
Kans. 6 - 87 232 22 26 - - - - - -
S. ATLANTIC 172 131 1,601 1,532 935 997 - 3 - 5 8 13
Del. - - 3 28 3 6 - - - 1 1 -
Md. 49 47 262 164 132 138 - - - 1 1 2
D.C. - - 53 17 11 27 U - U - - 1
Va. 16 12 174 191 84 104 - - - 2 2 1
W. Va. 5 3 6 10 8 14 - - - - - -
N.C. 23 20 99 165 174 202 - - - - - 2
S.C. 3 4 35 93 33 87 - - - - - 1
Ga. 37 25 509 415 129 110 - 1 - 1 2 1
Fla. 39 20 460 449 361 309 - 2 - - 2 5
E.S. CENTRAL 48 46 317 506 336 568 - - - 2 2 1
Ky. 7 6 19 65 36 34 - - - - - -
Tenn. 27 26 192 310 231 359 - - - 1 1 -
Ala. 12 12 63 70 67 59 - - - 1 1 1
Miss. 2 2 43 61 2 116 - - - - - -
W.S. CENTRAL 51 42 3,273 4,709 1,080 1,050 - 1 - - 1 8
Ark. - 2 83 188 80 71 - - - - - -
La. 23 11 94 191 128 128 - 1 - - 1 -
Okla. 26 27 497 1,230 71 40 - - - - - 1
Tex. 2 2 2,599 3,100 801 811 - - - - - 7
MOUNTAIN 83 73 2,704 3,558 683 721 - - - - - 8
Mont. - - 88 65 5 9 - - - - - -
Idaho - 1 223 115 38 35 - - - - - -
Wyo. 1 4 33 28 7 22 - - - - - -
Colo. 18 13 277 338 98 129 - - - - - -
N. Mex. 7 7 123 295 282 216 - - - - - -
Ariz. 45 29 1,697 1,855 155 167 - - - - - 5
Utah 5 3 169 492 63 77 - - - - - 1
Nev. 7 16 94 370 35 66 U - U - - 2
PACIFIC 95 212 4,385 6,188 1,389 1,462 - 29 - 4 33 21
Wash. 9 5 831 545 95 59 - - - 1 1 2
Oreg. 36 29 314 316 99 93 - - - - - -
Calif. 42 163 3,188 5,167 1,177 1,290 - 5 - 2 7 15
Alaska 1 8 16 26 12 11 - 24 - 1 25 -
Hawaii 7 7 36 134 6 9 - - - - - 4
Guam - - - - 2 3 U - U - - -
P.R. 2 - 49 238 322 635 - - - - - -
V.I. U U U U U U U U U U U U
Amer. Samoa U U U U U U U U U U U U
C.N.M.I. - 6 3 1 53 41 U - U - - 1
-----------------------------------------------------------------------------------------------------------------------------------------------------
N: Not notifiable U: Unavailable -: no reported cases
* Of 199 cases among children aged <5 years, serotype was reported for 98 and of those, 36 were type b.
** For imported measles, cases include only those resulting from importation from other countries.
=======================================================================================================================================================
TABLE III. (page 2) Provisional cases of selected notifiable diseases preventable by vaccination, United
States, weeks ending October 24, 1998, and October 18, 1997 (42nd Week)
Meningococcal
Disease Mumps Pertussis Rubella
----------------- -------------------------- --------------------------- ---------------------------
Cum. Cum. Cum. Cum. Cum. Cum. Cum. Cum.
Reporting Area 1998 1997 1998 1998 1997 1998 1998 1997 1998 1998 1997
------------------------------------------------------------------------------------------------------------------------------------------
UNITED STATES 2,161 2,656 4 386 513 102 4,699 4,345 - 325 155
NEW ENGLAND 88 168 - 7 8 17 757 781 - 39 1
Maine 6 17 - - - - 5 12 - - -
N.H. 4 13 - - - 7 95 107 - - -
Vt. 5 4 - - - - 65 203 - - -
Mass. 41 82 - 4 2 9 544 417 - 9 1
R.I. 7 18 - 1 5 - 9 16 - 1 -
Conn. 25 34 - 2 1 1 39 26 - 29 -
MID. ATLANTIC 192 279 - 21 49 9 453 325 - 130 31
Upstate N.Y. 56 72 - 6 11 9 260 125 - 111 4
N.Y. City 20 46 - 4 3 - 23 59 - 14 27
N.J. 50 57 U 2 7 U 5 13 U 4 -
Pa. 66 104 U 9 28 U 165 128 U 1 -
E.N. CENTRAL 319 406 - 64 63 14 491 461 - - 6
Ohio 123 144 - 26 24 7 232 128 - - -
Ind. 53 45 - 6 9 4 110 50 - - -
Ill. 79 123 - 10 10 3 77 67 - - 2
Mich. 36 58 - 22 16 - 55 50 - - -
Wis. 28 36 - - 4 - 17 166 - - 4
W.N. CENTRAL 181 185 - 27 14 32 461 342 - 27 -
Minn. 29 29 - 12 5 29 270 221 - - -
Iowa 36 40 - 10 7 1 68 33 - - -
Mo. 68 81 - 3 - 2 32 57 - 2 -
N. Dak. 5 2 - 2 - - 2 1 - - -
S. Dak. 7 5 - - - - 8 4 - - -
Nebr. 9 9 - - 1 - 15 5 - - -
Kans. 27 19 - - 1 - 66 21 - 25 -
S. ATLANTIC 371 452 - 44 61 6 274 372 - 19 78
Del. 2 5 - - - - 5 1 - - -
Md. 25 41 - - 1 2 51 106 - 1 -
D.C. 1 8 U - - U 1 3 U - 1
Va. 32 48 - 7 10 2 29 42 - 1 1
W. Va. 13 16 - - - - 1 6 - - -
N.C. 50 80 - 10 10 - 89 106 - 13 59
S.C. 49 49 - 6 10 - 25 24 - - 15
Ga. 84 90 - 1 10 2 24 13 - - -
Fla. 115 115 - 20 20 - 49 71 - 4 2
E.S. CENTRAL 207 201 1 14 25 - 106 123 - 3 1
Ky. 28 42 - - 3 - 45 56 - - -
Tenn. 65 67 - 1 4 - 32 33 - 2 -
Ala. 90 68 1 8 8 - 26 24 - 1 1
Miss. 24 24 - 5 10 - 3 10 - - -
W.S. CENTRAL 266 261 1 53 72 8 313 223 - 88 4
Ark. 28 30 - 7 1 8 72 35 - - -
La. 56 47 1 10 12 - 7 18 - - -
Okla. 37 35 - - - - 28 31 - - -
Tex. 145 149 - 36 59 - 206 139 - 88 4
MOUNTAIN 127 153 - 33 54 7 866 961 - 5 7
Mont. 4 8 - - - - 9 15 - - -
Idaho 10 10 - 4 3 1 240 488 - - 2
Wyo. 5 2 - 1 1 - 8 7 - - -
Colo. 26 42 - 7 3 5 174 294 - - -
N. Mex. 26 24 N N N - 86 88 - 1 -
Ariz. 39 39 - 6 32 1 187 34 - 1 5
Utah 11 12 - 5 8 - 128 16 - 2 -
Nev. 6 16 U 10 7 U 34 19 U 1 -
PACIFIC 410 551 2 123 167 9 978 757 - 14 27
Wash. 57 74 1 9 17 4 270 318 - 9 5
Oreg. 74 102 N N N 2 93 39 - - -
Calif. 271 366 1 90 118 3 589 366 - 3 14
Alaska 3 2 - 2 8 - 14 16 - - -
Hawaii 5 7 - 22 24 - 12 18 - 2 8
Guam 1 1 U 2 1 U - - U - -
P.R. 6 8 - 1 7 - 3 - - - -
V.I. U U U U U U U U U U U
Amer. Samoa U U U U U U U U U U U
C.N.M.I. - - U 2 4 U 1 - U - -
------------------------------------------------------------------------------------------------------------------------------------------
N: Not notifiable U: Unavailable -: no reported cases
=======================================================================================================================================================
Return to top. Table_IV Note: To print large tables and graphs users may have to change their printer settings to landscape and use a small font size.
TABLE IV. Deaths in 122 U.S. cities,* week ending
October 24, 1998 (42nd Week)
===================================================================================================================================
All Causes, By Age (Years)
------------------------------------------------------------------------ P&I**
Reporting Area All Ages >=65 45-64 25-44 1-24 <1 Total
---------------------------------------------------------------------------------------------------------------
NEW ENGLAND 587 421 95 40 10 21 41
Boston, Mass. 143 94 28 11 4 6 15
Bridgeport, Conn. 31 21 4 6 - - -
Cambridge, Mass. 21 14 5 2 - - 6
Fall River, Mass. 28 25 2 1 - - 1
Hartford, Conn. 56 32 13 5 2 4 1
Lowell, Mass. 30 19 8 3 - - 3
Lynn, Mass. 10 10 - - - - -
New Bedford, Mass. 21 18 3 - - - -
New Haven, Conn. 48 30 8 1 2 7 1
Providence, R.I. 48 42 4 2 - - 2
Somerville, Mass. 7 7 - - - - -
Springfield, Mass. 50 35 8 5 1 1 1
Waterbury, Conn. 37 30 4 1 - 2 3
Worcester, Mass. 57 44 8 3 1 1 8
MID. ATLANTIC 2,218 1,536 454 150 39 39 110
Albany, N.Y. 44 35 5 2 - 2 5
Allentown, Pa. 16 13 1 2 - - -
Buffalo, N.Y. 98 72 16 6 2 2 7
Camden, N.J. 31 15 9 3 3 1 4
Elizabeth, N.J. 7 6 1 - - - -
Erie, Pa. 41 37 2 1 - 1 4
Jersey City, N.J. 33 21 6 5 - 1 -
New York City, N.Y. 1,098 763 242 65 12 16 50
Newark, N.J. 51 24 16 10 1 - 4
Paterson, N.J. 28 18 5 5 - - -
Philadelphia, Pa. 399 252 85 38 12 12 20
Pittsburgh, Pa.*** 69 53 10 2 3 1 4
Reading, Pa. 28 23 5 - - - 2
Rochester, N.Y. 128 101 19 5 3 - 6
Schenectady, N.Y. 23 16 6 1 - - 1
Scranton, Pa. 23 18 3 2 - - -
Syracuse, N.Y. 71 49 15 1 3 3 3
Trenton, N.J. 15 8 6 1 - - -
Utica, N.Y. 15 12 2 1 - - -
Yonkers, N.Y. U U U U U U U
E.N. CENTRAL 2,079 1,412 416 140 53 52 105
Akron, Ohio 45 31 8 3 1 2 -
Canton, Ohio 36 25 8 1 - 2 -
Chicago, Ill. 382 239 85 36 9 7 27
Cincinnati, Ohio 104 75 21 5 1 2 10
Cleveland, Ohio 149 102 31 7 6 3 2
Columbus, Ohio 167 112 40 8 4 3 9
Dayton, Ohio 123 86 23 10 2 2 5
Detroit, Mich. 198 112 50 23 3 10 8
Evansville, Ind. 58 41 12 2 3 - 1
Fort Wayne, Ind. 59 46 8 5 - - 7
Gary, Ind. 5 4 - - 1 - -
Grand Rapids, Mich. 65 52 7 3 1 2 4
Indianapolis, Ind. 202 127 44 17 9 5 10
Lansing, Mich. 53 35 13 1 4 - 3
Milwaukee, Wis. 119 78 28 3 2 8 9
Peoria, Ill. 49 41 4 2 - 2 2
Rockford, Ill. 64 51 9 2 - 2 3
South Bend, Ind. 47 39 5 2 - 1 -
Toledo, Ohio 99 76 10 5 7 1 5
Youngstown, Ohio 55 40 10 5 - - -
W.N. CENTRAL 846 611 141 52 23 11 56
Des Moines, Iowa 75 60 13 1 1 - 7
Duluth, Minn. 52 43 5 3 1 - 3
Kansas City, Kans. 18 10 4 3 1 - 2
Kansas City, Mo. 116 73 15 8 6 6 3
Lincoln, Nebr. 28 20 6 2 - - 2
Minneapolis, Minn. 226 160 44 14 4 4 24
Omaha, Nebr. 90 59 15 9 7 - 2
St. Louis, Mo. 90 62 16 9 2 1 3
St. Paul, Minn. 88 75 11 1 1 - 8
Wichita, Kans. 63 49 12 2 - - 2
S. ATLANTIC 1,203 768 236 131 35 32 62
Atlanta, Ga. 174 104 34 26 7 3 7
Baltimore, Md. 238 141 58 28 4 7 13
Charlotte, N.C. 95 61 15 9 5 5 7
Jacksonville, Fla. 137 87 28 15 4 3 9
Miami, Fla. 107 68 20 16 1 2 -
Norfolk, Va. 47 36 3 3 2 3 1
Richmond, Va. U U U U U U U
Savannah, Ga. 69 41 20 4 3 1 4
St. Petersburg, Fla. 65 43 10 7 3 2 7
Tampa, Fla. 150 109 22 12 4 2 10
Washington, D.C. 107 74 22 5 2 4 4
Wilmington, Del. 14 4 4 6 - - -
E.S. CENTRAL 773 499 171 65 17 19 46
Birmingham, Ala. 176 118 38 14 1 3 14
Chattanooga, Tenn. 56 40 14 2 - - 2
Knoxville, Tenn. 83 54 14 8 1 6 9
Lexington, Ky. 67 47 13 6 - 1 4
Memphis, Tenn. 141 88 27 18 7 1 13
Mobile, Ala. 52 29 15 4 2 2 -
Montgomery, Ala. 44 28 8 5 2 1 1
Nashville, Tenn. 154 95 42 8 4 5 3
W.S. CENTRAL 1,410 932 275 131 33 39 66
Austin, Tex. 79 45 18 10 4 2 3
Baton Rouge, La. 28 11 10 5 - 2 1
Corpus Christi, Tex. 46 33 9 2 1 1 1
Dallas, Tex. 175 102 45 19 3 6 6
El Paso, Tex. 73 51 10 5 5 2 1
Ft. Worth, Tex. 119 90 14 10 3 2 8
Houston, Tex. 367 236 83 35 7 6 20
Little Rock, Ark. 62 42 10 6 1 3 1
New Orleans, La. 87 57 18 6 3 3 -
San Antonio, Tex. 201 146 28 20 2 5 11
Shreveport, La. 51 27 12 6 2 4 6
Tulsa, Okla. 122 92 18 7 2 3 8
MOUNTAIN 893 626 150 82 18 16 70
Albuquerque, N.M. 100 71 15 8 3 3 5
Boise, Idaho 38 30 6 1 1 - 4
Colo. Springs, Colo. 69 49 12 7 - 1 6
Denver, Colo. 96 67 11 10 4 4 8
Las Vegas, Nev. 196 126 40 21 6 3 12
Ogden, Utah 29 21 5 3 - - 4
Phoenix, Ariz. 77 59 13 4 - - 7
Pueblo, Colo. 27 24 2 1 - - 3
Salt Lake City, Utah 113 71 20 15 2 5 9
Tucson, Ariz. 148 108 26 12 2 - 12
PACIFIC 1,870 1,342 327 125 38 37 144
Berkeley, Calif. 10 6 4 - - - 1
Fresno, Calif. 121 93 16 6 4 2 9
Glendale, Calif. 18 14 4 - - - 1
Honolulu, Hawaii 50 34 8 6 - 2 4
Long Beach, Calif. 55 41 11 2 1 - 9
Los Angeles, Calif. 439 284 88 45 11 11 18
Pasadena, Calif. 34 25 6 3 - - 2
Portland, Oreg. 143 108 22 6 5 2 5
Sacramento, Calif. 197 142 34 10 5 6 25
San Diego, Calif. 140 105 23 5 2 5 20
San Francisco, Calif. 143 102 22 11 5 2 15
San Jose, Calif. 191 137 36 12 2 4 15
Santa Cruz, Calif. 37 34 3 - - - 5
Seattle, Wash. 146 95 34 14 2 1 3
Spokane, Wash. 55 48 6 1 - - 4
Tacoma, Wash. 91 74 10 4 1 2 8
TOTAL 11,879**** 8,147 2,265 916 266 266 700
---------------------------------------------------------------------------------------------------------------
U: Unavailable -: no reported cases
* Mortality data in this table are voluntarily reported from 122 cities in the United States, most of which have populations
of 100,000 or more. A death is reported by the place of its occurrence and by the week that the death certificate was
filed. Fetal deaths are not included.
** Pneumonia and influenza.
*** Because of changes in reporting methods in this Pennsylvania city, these numbers are partial counts for the current
week. Complete counts will be available in 4 to 6 weeks.
**** Total includes unknown ages.
===================================================================================================================================
Return to top. Disclaimer All MMWR HTML versions of articles are electronic conversions from ASCII text into HTML. This conversion may have resulted in character translation or format errors in the HTML version. Users should not rely on this HTML document, but are referred to the electronic PDF version and/or the original MMWR paper copy for the official text, figures, and tables. An original paper copy of this issue can be obtained from the Superintendent of Documents, U.S. Government Printing Office (GPO), Washington, DC 20402-9371; telephone: (202) 512-1800. Contact GPO for current prices. **Questions or messages regarding errors in formatting should be addressed to mmwrq@cdc.gov.Page converted: 11/10/98 |
|||||||||
This page last reviewed 5/2/01
|