 |
|
|
|
|
|
|
| ||||||||||
|
|
|
|
|
|
|
||||
| ||||||||||
|
|
|
|
|
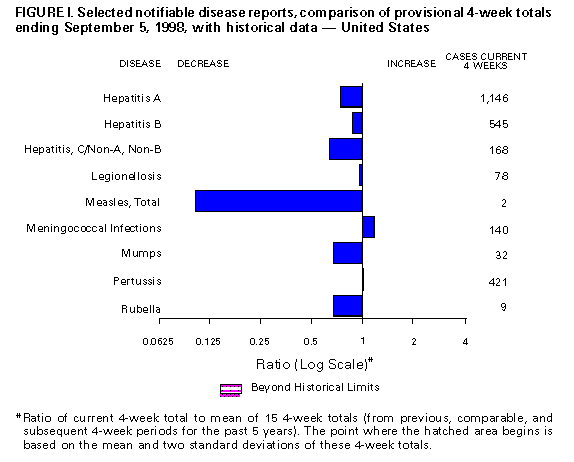
Persons using assistive technology might not be able to fully access information in this file. For assistance, please send e-mail to: mmwrq@cdc.gov. Type 508 Accommodation and the title of the report in the subject line of e-mail. Notifiable Diseases/Deaths in Selected Cities Weekly InformationFigure_I Selected notifiable disease reports, comparison of provisional 4-week totals ending September 5, 1998, with historical data -- United States Table_I Summary -- provisional cases of selected notifiable diseases, United States, cumulative, week ending September 5, 1998 (35th Week) Table_II Provisional cases of selected notifiable diseases, United States, weeks ending September 5, 1998 and August 30, 1997 (35th Week) Table_III Provisional cases of selected notifiable diseases preventable by vaccination, United States, weeks ending September 5, 1998 and August 30, 1997 (35th Week) Table_IV Deaths in 122 U.S. cities, week ending
September 5, 1998 (35th Week)
TABLE I. Summary -- provisional cases of specified notifiable diseases, United
States, cumulative, week ending September 5, 1998 (35th Week)
==================================================================================
                                             Cum. 1998
------------------------------------------------------
Anthrax                                              -
Brucellosis                                         35
Cholera                                              6
Congenital rubella syndrome                          3
Cryptosporidiosis*+                              2,229
Diphtheria                                           2
Encephalitis:  California*                          43
               eastern equine*                       2
               St. Louis*                            2
               western equine*                       -
Hansen Disease                                      76
Hantavirus pulmonary syndrome*&                     12
Hemolytic uremic syndrome, post-diarrheal*          44
HIV infection, pediatric*@                         164
Plague                                               6
Poliomyelitis, paralytic                             1
Psittacosis                                         27
Rabies, human                                        -
Rocky Mountain spotted fever (RMSF)                194
Streptococcal disease, invasive Group A          1,588
Streptococcal toxic-shock syndrome*                 40
Syphilis, congenital**                             196
Tetanus                                             28
Toxic-shock syndrome                                86
Trichinosis                                          9
Typhoid fever                                      220
Yellow fever                                         -
------------------------------------------------------
-: no reported cases
 * Not notifiable in all states
 + Updated weekly from reports to the Division of Viral and Rickettsial
   Diseases, National Center for Infectious Diseases (NCID).
 & Updated monthly to the Division of HIV/AIDS Prevention -- Surveillance
   and Epidemiology, National Center for HIV, STD, and TB Prevention
   (NCHSTP), last update August 30, 1998.
 @ Updated from reports to the Division of STD Prevention, NCHSTP.

==================================================================================
Return to top. Table_II Note: To print large tables and graphs users may have to change their printer settings to landscape and use a small font size.
TABLE II. (page 1) Provisional cases of selected notifiable diseases, United States, weeks ending
September 5, 1998, and August 30, 1997 (35th Week)
Escherichia
coli O157:H7
------------------- Hepatitis
AIDS* Chlamydia NETSS** PHLIS*** Gonorrhea C\NA,NB
----------------- -------------------- -------- -------- ------------------- ----------------
Cum. Cum. Cum. Cum. Cum. Cum. Cum. Cum. Cum. Cum.
Reporting Area 1998 1997 1998 1997 1998 1998 1998 1997 1998 1997
------------------------------------------------------------------------------------------------------------------------------
UNITED STATES 31,523 40,204 356,718 304,137 1,795 1,019 215,231 192,129 2,394 2,351
NEW ENGLAND 1,194 1,732 13,012 11,684 237 161 3,733 3,949 32 45
Maine 22 42 655 646 28 - 44 37 - -
N.H. 28 26 630 524 30 34 60 70 - -
Vt. 17 31 282 269 10 7 25 36 - 2
Mass. 604 598 5,478 4,826 112 104 1,396 1,460 29 36
R.I. 88 113 1,570 1,326 11 1 250 306 3 7
Conn. 435 922 4,397 4,093 46 15 1,958 2,040 - -
MID. ATLANTIC 8,893 12,414 42,949 37,942 183 36 24,674 24,636 271 216
Upstate N.Y. 1,014 1,931 N N 132 - 3,788 4,198 208 157
N.Y. City 5,005 6,451 23,035 18,054 5 7 10,052 8,996 - -
N.J. 1,655 2,598 7,224 6,634 46 28 4,790 5,094 - -
Pa. 1,219 1,434 12,690 13,254 N 1 6,044 6,348 63 59
E.N. CENTRAL 2,276 3,016 59,461 40,558 278 177 41,424 26,212 353 410
Ohio 485 663 17,029 14,601 81 39 10,736 9,555 7 12
Ind. 379 408 4,049 6,049 62 31 2,629 4,037 4 12
Ill. 888 1,176 17,815 U 66 14 14,652 U 23 68
Mich. 390 581 13,964 12,633 69 38 10,620 9,521 319 296
Wis. 134 188 6,604 7,275 N 55 2,787 3,099 - 22
W.N. CENTRAL 599 778 20,768 20,878 261 196 10,177 9,136 127 47
Minn. 119 136 4,149 4,370 102 91 1,518 1,524 7 3
Iowa 51 78 2,063 2,858 74 35 660 756 7 23
Mo. 282 377 7,915 7,925 22 40 5,689 4,871 108 8
N. Dak. 4 10 616 555 7 13 51 38 - 2
S. Dak. 13 7 1,058 836 17 10 168 91 - -
Nebr. 56 71 1,416 1,273 21 - 502 462 2 2
Kans. 74 99 3,551 3,061 18 7 1,589 1,394 3 9
S. ATLANTIC 7,960 9,668 73,490 63,376 158 88 60,933 61,990 133 155
Del. 104 174 1,698 - - 1 933 802 - -
Md. 914 1,167 5,315 4,789 22 10 5,966 7,858 6 4
D.C. 635 717 N N 1 - 2,437 2,983 - -
Va. 650 769 8,444 8,039 N 28 5,506 5,313 11 20
W. Va. 60 77 1,747 1,974 7 4 518 637 4 13
N.C. 536 597 15,002 11,419 40 34 12,968 11,241 17 38
S.C. 507 535 12,049 8,412 8 3 7,587 7,807 3 30
Ga. 846 1,161 15,727 11,245 51 - 14,206 13,025 9 -
Fla. 3,708 4,471 13,508 17,498 29 8 10,812 12,324 83 50
E.S. CENTRAL 1,273 1,366 26,310 23,265 81 27 25,756 23,227 142 252
Ky. 195 237 4,306 4,350 22 - 2,483 2,769 16 11
Tenn. 434 570 8,892 8,527 36 24 7,782 7,225 119 168
Ala. 372 334 6,875 5,682 20 2 8,833 7,956 5 6
Miss. 272 225 6,237 4,706 3 1 6,658 5,277 2 67
W.S. CENTRAL 3,799 4,171 52,130 41,025 91 12 30,421 27,178 470 311
Ark. 136 159 2,417 2,020 7 6 1,238 3,282 6 10
La. 654 733 9,967 6,274 4 2 8,675 5,913 24 144
Okla. 224 216 6,683 5,022 11 4 3,665 3,204 8 7
Tex. 2,785 3,063 33,063 27,709 69 - 16,843 14,779 432 150
MOUNTAIN 1,052 1,127 14,512 19,666 242 149 5,532 5,269 289 201
Mont. 20 33 793 697 11 - 29 31 7 15
Idaho 19 37 1,155 1,027 27 7 113 81 86 40
Wyo. 1 13 399 390 50 53 18 38 69 48
Colo. 209 292 10 4,622 49 38 1,538 1,353 20 22
N. Mex. 166 112 2,405 2,568 17 13 592 585 69 36
Ariz. 385 269 7,537 7,181 21 13 2,724 2,381 3 24
Utah 91 93 1,471 1,146 57 17 157 175 21 3
Nev. 161 278 742 2,035 10 8 361 625 14 13
PACIFIC 4,477 5,932 54,086 45,743 264 173 12,581 10,532 577 714
Wash. 303 454 7,078 6,015 50 56 1,248 1,257 13 20
Oreg. 128 222 3,847 3,273 75 72 558 503 5 2
Calif. 3,919 5,170 40,528 34,317 136 35 10,273 8,176 504 575
Alaska 17 42 1,268 1,003 3 - 216 260 1 -
Hawaii 110 44 1,365 1,135 N 10 286 336 54 117
Guam - 2 8 193 N - 2 27 - -
P.R. 1,246 1,381 U U 6 U 257 403 - -
V.I. 19 74 N N N U U U U U
Amer. Samoa - - U U N U U U U U
C.N.M.I. - 1 N N N U 25 17 - 2
------------------------------------------------------------------------------------------------------------------------------
N: Not notifiable U: Unavailable -: no reported cases C.N.M.I.: Commonwealth of North Mariana Islands
* Updated monthly to the Division of HIV/AIDS Prevention, -- Surveillance and Epidemiology, National Center for HIV, STD,
and TB Prevention, last update August 30, 1998.
** National Electronic Telecommunications System for Surveillance.
*** Public Health Laboratory Information System.
=======================================================================================================================================================
TABLE II. (page 2) Provisional cases of selected notifiable diseases, United States, weeks ending
September 5, 1998, and August 30, 1997 (35th Week)
Lyme Syphilis Rabies,
Legionellosis Disease Malaria (Primary & Secondary) Tuberculosis Animal
---------------- ---------------- ---------------- --------------------- ----------------- -------
Cum. Cum. Cum. Cum. Cum. Cum. Cum. Cum. Cum. Cum. Cum.
Reporting Area 1998 1997 1998 1997 1998 1997 1998 1997 1998 * 1997 1998
-------------------------------------------------------------------------------------------------------------------------------------------
UNITED STATES 793 609 7,352 7,257 833 1,224 4,779 5,773 9,449 11,849 4,735
NEW ENGLAND 38 52 1,936 2,005 41 66 46 104 287 296 957
Maine 1 2 6 8 4 1 1 - 5 17 146
N.H. 3 5 28 15 3 7 1 - 6 10 44
Vt. 4 9 8 6 - 2 4 - 2 4 43
Mass. 13 18 406 247 13 25 28 49 153 162 334
R.I. 8 5 323 219 3 5 1 2 38 24 60
Conn. 9 13 1,165 1,510 18 26 11 53 83 79 330
MID. ATLANTIC 199 116 4,559 4,014 201 367 178 281 1,902 2,097 1,115
Upstate N.Y. 64 31 2,772 1,649 60 52 24 28 237 288 788
N.Y. City 23 13 13 140 88 226 41 63 973 1,069 U
N.J. 11 17 808 1,245 30 68 55 113 415 426 136
Pa. 101 55 966 980 23 21 58 77 277 314 191
E.N. CENTRAL 238 200 79 387 81 115 649 424 821 1,221 101
Ohio 96 79 57 25 9 14 89 145 78 198 46
Ind. 46 30 16 23 10 11 124 102 76 96 8
Ill. 17 16 5 10 22 48 261 U 419 645 10
Mich. 55 47 1 22 36 30 130 93 245 198 28
Wis. 24 28 U 307 4 12 45 84 3 84 9
W.N. CENTRAL 55 35 124 82 64 37 93 122 261 380 518
Minn. 5 1 98 56 36 15 6 14 99 101 91
Iowa 7 9 19 5 7 8 - 6 27 43 118
Mo. 18 5 1 15 10 7 71 76 86 149 19
N. Dak. - 2 - - 2 2 - - 6 8 102
S. Dak. 3 2 - 1 - - 1 - 14 9 109
Nebr. 16 12 3 2 1 1 4 2 11 14 6
Kans. 6 4 3 3 8 4 11 24 18 56 73
S. ATLANTIC 100 80 467 537 195 213 1,962 2,363 1,369 2,191 1,378
Del. 9 7 12 103 1 3 17 17 U 22 17
Md. 20 14 316 344 57 64 419 647 206 210 338
D.C. 6 3 4 7 13 11 53 82 70 69 -
Va. 16 17 47 35 38 51 108 167 174 220 409
W. Va. N N 8 3 1 - 2 3 30 43 60
N.C. 8 11 41 24 15 12 492 583 278 280 136
S.C. 7 3 3 2 5 11 195 269 195 224 104
Ga. 7 - 5 1 25 25 523 376 346 413 165
Fla. 25 25 31 18 40 36 153 219 70 710 149
E.S. CENTRAL 48 40 60 62 22 24 815 1,252 744 897 206
Ky. 23 7 13 12 4 7 73 100 115 120 27
Tenn. 13 24 32 27 11 6 384 534 224 316 106
Ala. 5 2 14 5 5 8 190 314 265 296 71
Miss. 7 7 1 18 2 3 168 304 140 165 2
W.S. CENTRAL 19 12 19 55 18 17 675 869 1,303 1,739 124
Ark. - 1 6 15 1 4 79 117 76 131 29
La. 2 2 3 2 7 8 288 255 73 153 -
Okla. 8 1 2 11 3 5 54 81 115 151 95
Tex. 9 8 8 27 7 - 254 416 1,039 1,304 -
MOUNTAIN 46 40 11 7 40 57 154 120 281 380 136
Mont. 2 1 - - - 2 - - 16 6 36
Idaho 2 2 3 2 7 - 1 - 8 7 -
Wyo. 1 1 - 1 - 2 1 - 4 2 52
Colo. 12 15 3 - 13 26 8 10 U 62 19
N. Mex. 2 2 3 1 11 8 19 5 38 37 5
Ariz. 10 8 - 1 8 7 119 91 138 174 12
Utah 16 7 - - 1 3 3 5 43 18 11
Nev. 1 4 2 2 - 9 3 9 34 74 1
PACIFIC 50 34 97 108 171 328 207 238 2,481 2,648 200
Wash. 9 6 5 6 16 16 23 8 148 214 -
Oreg. - - 12 15 13 16 5 5 94 108 2
Calif. 39 27 79 87 138 288 177 223 2,102 2,137 176
Alaska 1 - 1 - 1 3 1 1 31 57 22
Hawaii 1 1 - - 3 5 1 1 106 132 -
Guam - - - - - - - 3 - 13 -
P.R. - - - - - 5 139 169 68 129 36
V.I. U U U U U U U U U U U
Amer. Samoa U U U U U U U U U U U
C.N.M.I. - - - - - - 156 9 73 2 -
-------------------------------------------------------------------------------------------------------------------------------------------
N: Not notifiable U: Unavailable -: no reported cases
* Additional information about areas displaying 'U' for cumulative Tuberculosis cases can be found in Notices to Readers, MMWR Vol. 47, No. 2, p. 39.
=======================================================================================================================================================
Return to top. Table_III Note: To print large tables and graphs users may have to change their printer settings to landscape and use a small font size.
TABLE III. (page 1) Provisional cases of selected notifiable diseases preventable by vaccination, United
States, weeks ending September 5, 1998, and August 30, 1997 (35th Week)
Hepatitis (Viral), by type Measles (Rubeola)
H. influenzae, --------------------------------------- ------------------------------------------------------------
invasive A B Indigenous Imported** Total
---------------- ----------------- ----------------- --------------- --------------- ---------------
Cum. Cum. Cum. Cum. Cum. Cum. Cum. Cum. Cum. Cum.
Reporting Area 1998* 1997 1998 1997 1998 1997 1998 1998 1998 1998 1998 1997
-----------------------------------------------------------------------------------------------------------------------------------------------------
UNITED STATES 732 761 14,628 18,577 5,519 6,294 1 30 - 19 49 107
NEW ENGLAND 39 43 164 468 112 120 - 1 - 2 3 19
Maine 2 4 16 47 2 6 - - - - - 1
N.H. 7 6 8 21 11 9 - - - - - 1
Vt. 5 3 13 9 3 6 - - - 1 1 -
Mass. 22 26 46 196 22 52 - 1 - 1 2 16
R.I. 2 2 12 107 56 12 - - - - - -
Conn. 1 2 69 88 18 35 - - - - - 1
MID. ATLANTIC 105 118 990 1,454 777 923 - 9 - 4 13 23
Upstate N.Y. 43 35 238 220 206 192 - 2 - - 2 5
N.Y. City 20 31 240 649 198 344 - - - - - 7
N.J. 37 37 224 214 144 173 - 7 - 1 8 3
Pa. 5 15 288 371 229 214 - - - 3 3 8
E.N. CENTRAL 124 126 2,113 1,917 564 1,018 - 11 - 3 14 10
Ohio 42 70 230 234 55 58 - - - 1 1 -
Ind. 31 13 110 211 70 76 U 2 U 1 3 -
Ill. 44 28 339 513 111 194 - - - - - 7
Mich. 3 15 1,310 819 303 298 - 9 - 1 10 2
Wis. 4 - 124 140 25 392 - - - - - 1
W.N. CENTRAL 70 39 1,011 1,457 269 332 - - - - - 12
Minn. 55 27 90 133 31 27 - - - - - 3
Iowa 2 5 377 290 48 26 - - - - - -
Mo. 8 4 411 740 157 241 - - - - - 1
N. Dak. - - 3 10 4 4 U - U - - -
S. Dak. - 2 21 18 1 1 - - - - - 8
Nebr. - 1 29 69 9 10 - - - - - -
Kans. 5 - 80 197 19 23 - - - - - -
S. ATLANTIC 150 117 1,250 1,146 813 826 - 3 - 5 8 10
Del. - - 3 23 - 4 - - - 1 1 -
Md. 42 44 211 137 111 114 - - - 1 1 2
D.C. - - 42 17 9 25 - - - - - 1
Va. 14 10 156 150 74 85 - - - 2 2 1
W. Va. 4 3 3 8 5 11 - - - - - -
N.C. 23 17 76 138 150 177 - - - - - 1
S.C. 3 4 23 74 24 71 - - - - - 1
Ga. 32 23 365 264 124 94 - 1 - 1 2 1
Fla. 32 16 371 335 316 245 - 2 - - 2 3
E.S. CENTRAL 40 40 275 437 273 479 - - - 2 2 1
Ky. 6 6 18 56 32 27 - - - - - -
Tenn. 22 24 160 268 191 311 - - - 1 1 -
Ala. 10 8 54 61 49 46 - - - 1 1 1
Miss. 2 2 43 52 1 95 - - - - - -
W.S. CENTRAL 42 34 2,870 3,727 951 769 1 1 - - 1 7
Ark. - 2 70 162 58 58 - - - - - -
La. 19 7 53 145 67 95 1 1 - - 1 -
Okla. 20 23 402 1,074 59 29 - - - - - -
Tex. 3 2 2,345 2,346 767 587 - - - - - 7
MOUNTAIN 74 70 2,202 2,913 575 601 - - - - - 7
Mont. - - 72 58 5 7 - - - - - -
Idaho - 1 189 98 24 24 - - - - - -
Wyo. 1 3 29 24 4 22 - - - - - -
Colo. 16 13 198 297 80 113 - - - - - -
N. Mex. 5 7 108 227 239 183 - - - - - -
Ariz. 41 28 1,371 1,471 138 137 U - U - - 5
Utah 4 3 147 432 53 68 - - - - - -
Nev. 7 15 88 306 32 47 - - - - - 2
PACIFIC 88 174 3,753 5,058 1,185 1,226 - 5 - 3 8 18
Wash. 7 3 742 368 76 52 - - - 1 1 2
Oreg. 34 29 257 251 74 74 - - - - - -
Calif. 39 132 2,708 4,311 1,021 1,081 - 4 - 2 6 12
Alaska 1 3 15 25 9 11 - 1 - - 1 -
Hawaii 7 7 31 103 5 8 U - U - - 4
Guam - - - - - 3 U - U - - -
P.R. 2 - 48 219 316 519 - - - - - -
V.I. U U U U U U U U U U U U
Amer. Samoa U U U U U U U U U U U U
C.N.M.I. - 6 3 1 45 34 U - U - - 1
-----------------------------------------------------------------------------------------------------------------------------------------------------
N: Not notifiable U: Unavailable -: no reported cases
* Of 174 cases among children aged <5 years, serotype was reported for 98 and of those, 38 were type b.
** For imported measles, cases include only those resulting from importation from other countries.
=======================================================================================================================================================
TABLE III. (page 2) Provisional cases of selected notifiable diseases preventable by vaccination, United
States, weeks ending September 5, 1998, and August 30, 1997 (35th Week)
Meningococcal
Disease Mumps Pertussis Rubella
----------------- -------------------------- --------------------------- ---------------------------
Cum. Cum. Cum. Cum. Cum. Cum. Cum. Cum.
Reporting Area 1998 1997 1998 1998 1997 1998 1998 1997 1998 1998 1997
------------------------------------------------------------------------------------------------------------------------------------------
UNITED STATES 1,911 2,359 6 337 418 84 3,429 3,577 - 307 130
NEW ENGLAND 76 146 - 2 8 5 548 662 - 36 1
Maine 5 16 - - - - 5 7 - - -
N.H. 4 12 - - - 4 51 85 - - -
Vt. 1 3 - - - 1 59 187 - - -
Mass. 38 73 - 1 2 - 395 356 - 6 1
R.I. 3 14 - - 5 - 7 12 - 1 -
Conn. 25 28 - 1 1 - 31 15 - 29 -
MID. ATLANTIC 177 247 - 19 46 5 361 272 - 124 31
Upstate N.Y. 46 68 - 4 10 5 201 107 - 110 4
N.Y. City 19 42 - 4 3 - 9 58 - 9 27
N.J. 47 46 - 2 7 - 5 11 - 4 -
Pa. 65 91 - 9 26 - 146 96 - 1 -
E.N. CENTRAL 293 345 2 59 52 14 361 377 - - 5
Ohio 110 126 2 23 18 14 183 105 - - -
Ind. 51 38 U 5 7 U 70 38 U - -
Ill. 71 100 - 10 8 - 45 50 - - 1
Mich. 36 52 - 21 16 - 46 46 - - -
Wis. 25 29 - - 3 - 17 138 - - 4
W.N. CENTRAL 158 169 1 25 13 2 281 225 - 27 -
Minn. 28 29 - 12 5 - 168 142 - - -
Iowa 29 39 1 9 6 - 53 12 - - -
Mo. 57 72 - 3 - - 22 44 - 2 -
N. Dak. 3 1 U 1 - U 2 1 U - -
S. Dak. 6 4 - - - - 8 3 - - -
Nebr. 8 8 - - 1 1 10 5 - - -
Kans. 27 16 - - 1 1 18 18 - 25 -
S. ATLANTIC 332 401 2 41 48 24 223 308 - 13 59
Del. 1 5 - - - - 3 1 - - -
Md. 24 37 - - 1 3 37 96 - 1 -
D.C. - 7 - - - - 1 3 - - -
Va. 27 40 1 6 9 10 19 34 - - 1
W. Va. 12 14 - - - - 1 6 - - -
N.C. 47 77 1 10 8 - 74 85 - 9 51
S.C. 46 42 - 5 10 - 22 19 - - 6
Ga. 72 77 - 1 6 8 18 8 - - -
Fla. 103 102 - 19 14 3 48 56 - 3 1
E.S. CENTRAL 164 176 - 13 22 4 81 95 - 2 1
Ky. 20 38 - - 3 - 25 40 - - -
Tenn. 52 61 - 1 3 4 31 27 - 1 -
Ala. 70 55 - 7 6 - 22 19 - 1 1
Miss. 22 22 - 5 10 - 3 9 - - -
W.S. CENTRAL 223 219 1 49 44 14 245 161 - 86 4
Ark. 26 26 - 7 1 8 53 15 - - -
La. 46 46 1 9 11 2 5 13 - - -
Okla. 31 25 - - - - 18 24 - - -
Tex. 120 122 - 33 32 4 169 109 - 86 4
MOUNTAIN 111 140 - 29 51 8 649 867 - 5 6
Mont. 4 7 - - - 2 7 15 - - -
Idaho 9 8 - 4 2 - 196 481 - - 2
Wyo. 6 2 - 1 1 - 8 6 - - -
Colo. 23 36 - 8 3 2 141 239 - - -
N. Mex. 18 24 N N N - 76 69 - 1 -
Ariz. 35 37 U 5 31 U 142 30 U 1 4
Utah 11 11 - 4 7 4 53 13 - 2 -
Nev. 5 15 - 7 7 - 26 14 - 1 -
PACIFIC 377 516 - 100 134 8 680 610 - 14 23
Wash. 52 66 - 7 14 2 223 251 - 9 5
Oreg. 63 98 N N N 6 65 27 - - -
Calif. 256 345 - 74 94 - 375 300 - 3 10
Alaska 2 2 - 2 6 - 11 16 - - -
Hawaii 4 5 U 17 20 U 6 16 U 2 8
Guam - 1 U - 1 U - - U - -
P.R. 6 8 - 1 5 - 3 - - - -
V.I. U U U U U U U U U U U
Amer. Samoa U U U U U U U U U U U
C.N.M.I. - - U 2 4 U 1 - U - -
------------------------------------------------------------------------------------------------------------------------------------------
N: Not notifiable U: Unavailable -: no reported cases
=======================================================================================================================================================
Return to top. Table_IV Note: To print large tables and graphs users may have to change their printer settings to landscape and use a small font size.
TABLE IV. Deaths in 122 U.S. cities,* week ending
September 5, 1998 (35th Week)
===================================================================================================================================
All Causes, By Age (Years)
------------------------------------------------------------------------ P&I**
Reporting Area All Ages >=65 45-64 25-44 1-24 <1 Total
---------------------------------------------------------------------------------------------------------------
NEW ENGLAND 402 305 61 27 4 5 30
Boston, Mass. 123 88 22 8 2 3 7
Bridgeport, Conn. 26 21 - 4 - 1 1
Cambridge, Mass. 19 16 2 1 - - 2
Fall River, Mass. 16 11 2 2 1 - -
Hartford, Conn. U U U U U U U
Lowell, Mass. 14 10 2 2 - - 2
Lynn, Mass. 16 12 2 1 - 1 2
New Bedford, Mass. 27 25 2 - - - 3
New Haven, Conn. 27 21 4 1 1 - 2
Providence, R.I. U U U U U U U
Somerville, Mass. 6 4 2 - - - -
Springfield, Mass. 41 33 7 1 - - 6
Waterbury, Conn. 34 22 7 5 - - 3
Worcester, Mass. 53 42 9 2 - - 2
MID. ATLANTIC 1,960 1,338 400 147 38 37 102
Albany, N.Y. 40 35 1 1 1 2 -
Allentown, Pa. 12 9 1 1 1 - -
Buffalo, N.Y. 85 51 17 13 2 2 3
Camden, N.J. 22 13 6 3 - - 2
Elizabeth, N.J. 12 7 3 2 - - -
Erie, Pa. 46 32 11 2 - 1 2
Jersey City, N.J. 17 10 5 2 - - -
New York City, N.Y. 1,114 748 244 83 17 22 55
Newark, N.J. U U U U U U U
Paterson, N.J. 10 4 3 3 - - -
Philadelphia, Pa. 200 123 48 11 11 7 14
Pittsburgh, Pa.*** 72 50 13 7 1 1 3
Reading, Pa. 30 26 2 2 - - 1
Rochester, N.Y. 125 104 15 3 3 - 12
Schenectady, N.Y. 23 14 6 2 - 1 2
Scranton, Pa. 24 23 - - 1 - 1
Syracuse, N.Y. 74 58 11 4 - 1 7
Trenton, N.J. 40 23 9 8 - - -
Utica, N.Y. 14 8 5 - 1 - -
Yonkers, N.Y. U U U U U U U
E.N. CENTRAL 1,479 1,009 302 92 34 42 85
Akron, Ohio 39 26 4 1 1 7 -
Canton, Ohio 42 33 6 - 2 1 6
Chicago, Ill. U U U U U U U
Cincinnati, Ohio 34 22 9 2 - 1 4
Cleveland, Ohio 135 87 29 10 6 3 2
Columbus, Ohio 176 112 42 10 4 8 21
Dayton, Ohio 120 88 18 11 2 1 6
Detroit, Mich. 179 101 50 19 6 3 1
Evansville, Ind. 36 28 7 1 - - 2
Fort Wayne, Ind. 58 47 7 3 1 - 2
Gary, Ind. 4 - - 2 2 - -
Grand Rapids, Mich. 64 49 9 4 1 1 6
Indianapolis, Ind. 194 132 38 10 6 8 6
Lansing, Mich. 42 32 6 2 2 - 4
Milwaukee, Wis. 108 78 23 4 - 3 11
Peoria, Ill. 32 23 4 - - 5 3
Rockford, Ill. 41 27 14 - - - 2
South Bend, Ind. 38 25 9 3 - 1 -
Toledo, Ohio 80 58 14 7 1 - 7
Youngstown, Ohio 57 41 13 3 - - 2
W.N. CENTRAL 767 557 134 41 16 18 38
Des Moines, Iowa 67 53 10 3 1 - 2
Duluth, Minn. 18 13 3 2 - - -
Kansas City, Kans. 30 18 7 5 - - -
Kansas City, Mo. 91 67 16 5 2 - 11
Lincoln, Nebr. 27 20 5 - 1 1 5
Minneapolis, Minn. 171 138 25 5 1 2 10
Omaha, Nebr. 97 73 14 2 - 8 4
St. Louis, Mo. 99 59 26 6 4 4 -
St. Paul, Minn. 81 56 15 6 2 2 3
Wichita, Kans. 86 60 13 7 5 1 3
S. ATLANTIC 1,111 727 215 104 40 25 56
Atlanta, Ga. 185 110 44 22 6 3 3
Baltimore, Md. 100 61 21 11 7 - 8
Charlotte, N.C. 76 48 21 4 1 2 7
Jacksonville, Fla. 150 105 22 14 4 5 10
Miami, Fla. 92 61 14 12 3 2 1
Norfolk, Va. 34 24 3 4 1 2 1
Richmond, Va. 60 28 19 7 5 1 1
Savannah, Ga. 46 33 6 3 2 2 3
St. Petersburg, Fla. 52 38 6 5 2 1 5
Tampa, Fla. 187 137 34 11 3 2 12
Washington, D.C. 122 76 24 11 6 5 5
Wilmington, Del. 7 6 1 - - - -
E.S. CENTRAL 778 521 169 53 15 17 45
Birmingham, Ala. 160 116 28 7 - 6 10
Chattanooga, Tenn. 81 55 16 8 - 2 5
Knoxville, Tenn. 82 60 18 2 2 - 5
Lexington, Ky. 68 38 21 4 2 3 4
Memphis, Tenn. 179 123 38 15 2 1 17
Mobile, Ala. 50 32 11 5 1 1 -
Montgomery, Ala. 52 36 10 3 2 1 -
Nashville, Tenn. 106 61 27 9 6 3 4
W.S. CENTRAL 1,395 926 280 116 39 34 73
Austin, Tex. 75 48 15 7 4 1 5
Baton Rouge, La. 28 16 9 1 1 1 -
Corpus Christi, Tex. 50 35 10 3 1 1 3
Dallas, Tex. 197 125 42 19 6 5 5
El Paso, Tex. 72 53 10 3 4 2 4
Ft. Worth, Tex. 119 81 15 11 3 9 7
Houston, Tex. 395 252 84 43 12 4 26
Little Rock, Ark. 78 48 18 8 1 3 4
New Orleans, La. 113 69 37 6 - 1 -
San Antonio, Tex. 171 127 24 7 7 6 14
Shreveport, La. U U U U U U U
Tulsa, Okla. 97 72 16 8 - 1 5
MOUNTAIN 923 609 185 92 19 18 54
Albuquerque, N.M. 109 72 16 16 4 1 6
Boise, Idaho 37 29 3 4 1 - 4
Colo. Springs, Colo. 48 30 13 3 1 1 -
Denver, Colo. 97 57 21 13 3 3 3
Las Vegas, Nev. 198 124 50 18 4 2 7
Ogden, Utah 25 16 5 3 1 - 1
Phoenix, Ariz. 168 109 30 20 3 6 13
Pueblo, Colo. 23 21 1 1 - - 2
Salt Lake City, Utah 104 75 22 3 1 3 8
Tucson, Ariz. 114 76 24 11 1 2 10
PACIFIC 1,942 1,339 352 157 58 36 150
Berkeley, Calif. 16 12 2 1 - 1 2
Fresno, Calif. 196 144 36 13 2 1 11
Glendale, Calif. 23 16 4 2 1 - 3
Honolulu, Hawaii 86 63 12 7 3 1 1
Long Beach, Calif. 65 49 6 7 1 2 9
Los Angeles, Calif. 412 274 74 47 10 7 23
Pasadena, Calif. 33 26 5 2 - - 4
Portland, Oreg. 209 136 43 18 7 5 18
Sacramento, Calif. 187 135 34 10 5 3 33
San Diego, Calif. 143 97 26 10 7 3 10
San Francisco, Calif. 119 81 24 7 5 2 10
San Jose, Calif. 163 115 27 12 7 2 9
Santa Cruz, Calif. 25 15 4 4 1 1 2
Seattle, Wash. 121 77 26 9 3 6 6
Spokane, Wash. 50 40 7 1 2 - 6
Tacoma, Wash. 94 59 22 7 4 2 3
TOTAL 10,757**** 7,331 2,098 829 263 232 633
---------------------------------------------------------------------------------------------------------------
U: Unavailable -: no reported cases
* Mortality data in this table are voluntarily reported from 122 cities in the United States, most of which have populations
of 100,000 or more. A death is reported by the place of its occurrence and by the week that the death certificate was
filed. Fetal deaths are not included.
** Pneumonia and influenza.
*** Because of changes in reporting methods in this Pennsylvania city, these numbers are partial counts for the current
week. Complete counts will be available in 4 to 6 weeks.
**** Total includes unknown ages.
===================================================================================================================================
Return to top. Disclaimer All MMWR HTML versions of articles are electronic conversions from ASCII text into HTML. This conversion may have resulted in character translation or format errors in the HTML version. Users should not rely on this HTML document, but are referred to the electronic PDF version and/or the original MMWR paper copy for the official text, figures, and tables. An original paper copy of this issue can be obtained from the Superintendent of Documents, U.S. Government Printing Office (GPO), Washington, DC 20402-9371; telephone: (202) 512-1800. Contact GPO for current prices. **Questions or messages regarding errors in formatting should be addressed to mmwrq@cdc.gov.Page converted: 10/05/98 |
|||||||||
This page last reviewed 5/2/01
|