 |
|
|
|
|
|
|
| ||||||||||
|
|
|
|
|
|
|
||||
| ||||||||||
|
|
|
|
|
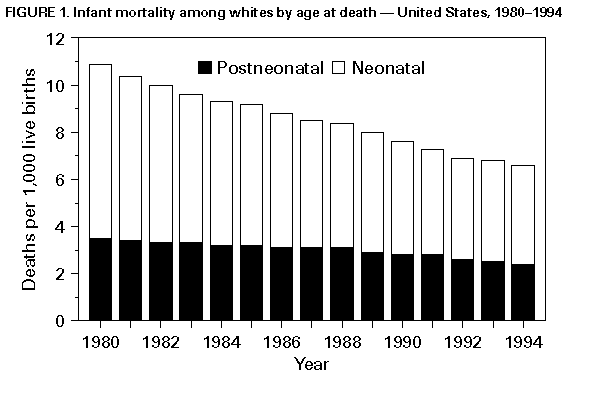
Persons using assistive technology might not be able to fully access information in this file. For assistance, please send e-mail to: mmwrq@cdc.gov. Type 508 Accommodation and the title of the report in the subject line of e-mail. Postneonatal Mortality Surveillance -- United States, 1980-1994Cheryl L. Scott, M.D., M.P.H. Solomon Iyasu, M.B.B.S., M.P.H. Diane Rowley, M.D., M.P.H. Hani K. Atrash, M.D., M.P.H. Division of Reproductive Health National Center for Chronic Disease Prevention and Health Promotion Abstract Problem/Condition: This report contains public health surveillance data that describe trends in postneonatal mortality (PNM) and that update information published in 1991. Reporting Period Covered: 1980-1994. Description of System: National death certificate data characterizing PNM were reported by hospital physicians, coroners, and medical examiners. Data for 1980-1994 were compiled by the National Center for Health Statistics (NCHS) and obtained from NCHS public-use mortality tapes. Results: The PNM rate per 1,000 live births declined 29.8% from 4.1 in 1980 to 2.9 in 1994 (31.7% decline among white infants and 25.8% among black). Most of the decline resulted from reduced mortality from infections and sudden infant death syndrome (SIDS). The PNM rate for blacks remained steady at 2.1/1,000 live births during 1985-1988 and gradually increased to 2.4 by 1994. Autopsy rates for cases of SIDS increased from 82% to approximately 95% and did not differ among black infants and white infants. The decline of PNM rates for birth defects was greater for white infants than for black infants. The racial gap in PNM rates widened regionally during the study period, except in the South and the Northeast where ratios remained stable. In 1994, the largest gap persisted in the north-central region followed by the West and Northeast. Interpretation: In 1994 as in 1980, PNM remained an important contributor to infant mortality, but nearly half of these deaths are caused by potentially preventable causes such as SIDS, infections, and injuries. The use of interventions for SIDS, birth defects, infections, and injuries can help reduce PNM and narrow the associated racial gap. Actions Taken: This surveillance information, which will be distributed to administrators of state maternal and child health programs and to community-based organizations nationwide, will be useful in planning infant mortality reduction programs and to target PNM prevention efforts. INTRODUCTION Postneonatal mortality (PNM) -- deaths among infants aged 28-364 days -- contributes substantially to infant mortality -- deaths among infants aged 0-364 days. PNM declined dramatically during 1945-1950 and 1965-1970, and more slowly at other times (1). Medical advances in the treatment and prevention of infectious diseases after World War II and improvements in socioenvironmental conditions during the 1960s facilitated these periods of decline in PNM (2,3,4). PNM declined more slowly in the 1970s, and among 20 industrialized countries, the U.S. ranking in infant mortality worsened from eighth place in 1970 to sixteenth in 1980 (2,3,5,6). This report updates trends in PNM by cause of death, race, and geographic region. The purpose is to examine recent trends for which PNM prevention and reduction strategies can be planned and to assist in assessing progress toward achieving the national health objective (7) of no more than 2.5 postneonatal deaths per 1,000 live births among white infants and no more than 4.0 among black infants. METHODS Using data from public-use mortality tapes compiled by NCHS for 1980-1994, PNM rates were calculated by age at death, race, underlying cause of death, completed autopsy status, and region of residence. The data were also used to evaluate trends in neonatal mortality (NM) -- deaths among infants aged 0-27 days -- to assess the relative importance of PNM and NM to overall infant mortality. Cause-of-death statistics are based on the underlying cause of death reported on the death certificate by the attending physician, medical examiner, or coroner, as specified by the World Health Organization. All causes of PNM were examined, defined by codes 0010-9899 of the International Classification of Diseases, Ninth Revision, (ICD-9) (8) for SIDS, congenital anomalies (birth defects), infections, injuries, perinatal conditions, ill-defined conditions, and other underlying causes of death. Causes of death were grouped by using a modification of the ICD cause-of-death groupings of the 1980 National Infant Mortality Surveillance (9) (See Appendix A). Denominator data for live births by race, region of residence, and geographic residence status for each year during 1980-1994 were obtained from published NCHS birth certificate data. PNM rates were calculated by dividing the number of PNM deaths by the number of births for a given year. The average percent change in the rate per year was derived from the slopes of fitted regression lines on the logarithms of rates to examine the extent of any slowdowns. Data were analyzed by using the computer software package Statistical Analysis System 6.12 (SAS Institute, Inc., Cary, North Carolina). Because race reflects different distributions of several risk factors for infant health and is useful for identifying groups at greatest risk for infant death (10), this analysis examines race-specific mortality rates. For PNM rates, numerators were tabulated by race of infant and denominators (live-born infants) by race of mother. However, these analyses were limited to blacks and whites because information on maternal race was incomplete for other groups (11,12). Relative risk ratios were determined by dividing PNM rates for black infants by PNM rates for white infants. RESULTS During 1980-1994, a total of 205,541 postneonatal deaths occurred; 138,006 (67.1%) of these were among whites and 60,289 (29.3%) among blacks (Table_1). The overall PNM rate per 1,000 live births declined by 29.8% from 4.1 in 1980 to 2.9 in 1994 (31.7% decline among white infants and 25.8% among black infants). During the study period, PNM among white infants declined more rapidly (2.4% per year) than among black infants (1.5% per year). During 1980-1990, the PNM rate declined 17.1%, and during 1990-1994, it declined an additional 14.7%. The PNM ratio between blacks and whites remained steady at 2.1/1,000 live births during 1985-1988 and gradually increased to 2.4 by 1994. Recently available final data for 1995 indicate a further 6.9% decline in PNM compared with the 1994 rate (8.3% among white infants and 5.4% among black infants). Neonatal Mortality The NM rate declined more than the PNM rate during 1980-1994. For whites, NM declined 43.2% from 7.4/1,000 live births to 4.2, and PNM declined 31.4% from 3.5/1,000 live births to 2.4 (Figure_1). This decline resulted in a 13% increase (from 32.0% in 1980 to 36.1% in 1994) in the percentage of infant deaths occurring during the postneonatal period among whites. For blacks, NM declined 30.1% (from 14.6/1,000 live births to 10.2), and PNM declined 25.8% (from 7.6/1,000 live births to 5.6) (Figure_2). Little change occurred in the relative proportion of NM and PNM among black infants. Cause-Specific PNM SIDS was the leading cause of postneonatal deaths among whites and blacks during 1980-1994 and accounted for 33% of PNM in 1994 (Table_2). Among white infants, the second leading cause of death was birth defects, followed by infections and injuries. The largest average annual percent reduction among leading causes of deaths for white infants was observed for infections (3.5%) and perinatal conditions (3.3%). However, postneonatal deaths among whites caused by ill-defined conditions, which contributed less than 5% to these deaths, increased at an annual rate of 2.8% from 9.1/100,000 live births in 1980 to 12.6/100,000 live births in 1994. Among blacks, the second-leading cause of PNM in 1980 was infections, followed by birth defects, and the greatest annual average reduction in PNM among blacks was observed for infections (2.2%). The PNM rates for ill-defined and perinatal conditions increased among blacks during 1980-1994. All cause-specific PNM rates were higher for black infants than white infants during the study period. Except for SIDS, birth defects, and other causes of death, PNM cause-specific ratios between black infants and white infants increased during the study period. The greatest increases in rate ratios were observed for deaths caused by perinatal conditions (2.6 times greater for blacks than for whites in 1980 and 4.3 times greater in 1994) and injuries (2.2 times greater for blacks than for whites in 1980 and 2.6 times greater in 1994). For SIDS, the relative risk for black infants was 2.3 times greater than for white infants in 1980; it declined to 1.8 by 1985 and gradually increased to 2.3 by 1994. Regional PNM During 1980-1994, PNM rates declined in all geographic regions of the United States (Table_3). Among white infants, PNM rates in 1980 were highest in the West, followed by the South, north-central region, and Northeast. By 1994, the regional differences had virtually disappeared. The greatest percent reduction in PNM among whites during the study period occurred in the West. In 1980, PNM rates among black infants were highest in the north-central region, followed by the West. Rates were similar in the South and Northeast. The highest regional rate of postneonatal deaths among black infants in 1994 was in the north- central region, followed by the West and Northeast. During the study period, the greatest percent reduction in PNM among black infants occurred in the South. In 1980, the largest gap in PNM rates between black infants and white infants was in the north-central region, followed by the Northeast. In 1994, the largest gap persisted in the north-central region, followed by the West and Northeast. Except for the South and the Northeast, where ratios remained stable, the racial gap widened regionally during the study period. Sudden Infant Death Syndrome PNM attributable to SIDS declined similarly among white infants and black infants (32.0% versus 32.2%) but differed in the timing of decline. Among whites, SIDS mortality declined 28% during 1990-1994, but little decline occurred before 1990. Among blacks, SIDS mortality declined 18% during 1990-1994, but before 1990, primarily 1980-1985, it had declined 17%. During the study period, PNM attributable to SIDS declined in all regions among both white infants and black infants (Table_4). In 1980, the highest SIDS rate among white infants was observed in the West, followed by the north-central region and the South. In 1994, the highest SIDS rate among white infants was observed in the West followed by the Northeast and north-central region. The greatest reduction in PNM attributable to SIDS among whites during the study period was in the West, followed by the Northeast and north-central regions. Among black infants, the highest SIDS rate in 1980 and 1994 was in the north-central region, followed by the West and Northeast. The greatest reduction in PNM attributable to SIDS among black infants was observed in the Northeast, followed by the West and South. During 1980-1988, the relative risk for black infants for PNM attributable to SIDS declined from 2.2 to 2.1 times greater than for white infants. During 1989-1994, the relative risk increased gradually to 2.4 times greater than for whites. The relative risk for blacks in 1980 was greatest in the Northeast (3.2 times greater than for whites), followed by the north-central region (2.9), South (2.2), and West (2.0). In 1994, the regional relative risk for black infants remained fairly stable, except in the West where it increased from 2.0 to 2.5. Autopsy rates for SIDS cases increased nationally among both black infants and white infants. Among white infants, the autopsy rate of SIDS cases increased to approximately 95% during the study period; in 1980, the rates were higher than 81%, except in the South (70%). In 1994, regional autopsy rates of SIDS cases among white infants were higher than 96%, except in the South (91%). Among black infants, regional rates in 1980 were higher than 93%, except in the South (64%). By 1994, the rate in the South was 95%, and in all other regions, the rate had increased to approximately 98%. Birth Defects PNM related to birth defects declined among white infants and black infants during the study period (Table_5). Approximately half of these deaths was attributable to cardiovascular defects. Cardiovascular, central nervous system (CNS), and chromosomal defects accounted for approximately three fourths of these deaths. The decline in PNM related to birth defects was greater for white infants (30%) than black infants (20%). Of the leading causes of birth defects, the rate of decline was most rapid for CNS defects, which was greater for white infants than for black infants. Although gastrointestinal defects accounted for less than 6% of all defects, the rate declined more rapidly than for all other defects among both white infants (8.8% per year) and among black infants (7.7% per year). For all years, the relative risk for PNM from birth defects was higher for black infants than white infants, and it increased from 1.2 times greater in 1980 to 1.4 in 1994. The cause-specific relative risk for black infants increased for CNS defects (from 1.3 times greater to 1.6), cardiovascular defects (from 1.2 times greater to 1.3), and chromosomal defects (from 1.2 times greater to 1.3). Infections PNM caused by infections declined substantially during the study period (Table_6). PNM caused by respiratory infections accounted for nearly half of these deaths. Among both white infants and black infants, the leading cause of PNM attributable to infections during 1980-1981 was respiratory infections, followed by CNS infections and septicemia. During 1993-1994, septicemia was the second-leading infection-related cause of PNM among white infants and gastrointestinal infections, the third leading cause; for black infants, CNS infections were the second leading cause of infection-related PNM and gastrointestinal infections, the third-leading cause. The rate of decline in infection-related PNM was greatest for CNS infections (10.7% per year for whites and 8.6% per year for blacks). The proportion of PNM caused by respiratory infections remained stable for white infants and decreased by 2.2% for black infants. The black-to-white-rate ratio for PNM caused by infections increased from 2.8 to 3.0 times greater for black infants than for whites; the rate ratio for respiratory infections narrowed (from 3.1 to 2.6 times greater for black infants than for whites), whereas that for CNS infections nearly tripled (from 2.4 to 7.0 times greater for black infants than for whites). Injuries The leading category of injury-related PNM during 1980-1994 was unintentional injuries. Suffocation, the leading cause, accounted for nearly one third of injury-related PNM (Table_7). The rate of PNM attributable to intentional injury (homicide) increased by 36% among whites and 51% among blacks. In fact, the greatest annual average percent increase in PNM caused by injuries during 1980-1994, was in the rate of homicides (3.2% for whites and 3.8% for blacks). Because of this steady rise in mortality from homicide, the relative proportions of unintentional injuries decreased from 1980-1981 to 1993-1994 (Table_7). During 1993-1994, homicide displaced motor vehicle crashes as the second leading cause of injury-related PNM among whites and accounted for nearly one fourth of these deaths. In 1993-1994, homicide was the leading cause of injury-related PNM among black infants and accounted for nearly one third of these deaths. Suffocation and motor vehicle crashes among blacks were the second and third most important causes of injury. PNM rates caused by injuries declined per year during 1980-1994, at a greater rate for white infants (1.6%) than black infants (0.4%). The proportion of postneonatal deaths attributable to injuries also declined for both whites and blacks. Of the leading causes of postneonatal injury-related deaths, the greatest rate of decline during the study period occurred in motor vehicle crashes among both whites and blacks. Except for motor vehicle crashes during 1980-1981, black infants were at excess risk for all causes of injury-related PNM during the study period, and that excess risk increased by 14% during 1980-1994. During this period, the rate ratio for blacks to whites approximately doubled for motor vehicle crashes (from 0.86 to 1.9 times greater for blacks than for whites in 1994), decreased for deaths attributable to fire (from 3.1 to 2.9), and decreased for falls (from 2.1 to 1.8). DISCUSSION The decline in PNM during the 1980s was similar to that of the previous decade but not as great as the decline that occurred during the 1960s. During 1960-1970, the annual rate declined by 32.9% (13). Rates then declined more slowly during 1970-1980, declining by only 16.3% (2,6). During 1980-1990, the rate declined by 17.1%, and during 1990-1994, it declined by 14.7%. Almost 42% of the decline during the study period (1980-1994) occurred from 1990 to 1994. The rate of decline in PNM was greater and more rapid for white infants than black infants. However, among white infants, PNM declined slower than NM, and the proportion of postneonatal deaths among whites was greater than among blacks. NM and PNM declined similarly among blacks during 1980-1994, and their relative proportions remained constant. Compared with white infants, the rate of decline caused by birth defects, infections, injuries, and perinatal conditions was slower for black infants. Improvements in PNM during 1915-1970 have been attributed to improved sanitation, introduction of antibiotics, improved nutrition, and reduced infectious disease-related mortality (1,3). Risk markers for PNM include environmental factors (e.g., socioeconomic conditions, demographic factors, and availability and use of health care {1,2,6,14-17}). An association between poverty and infant mortality has also been described (18-22). However, to explore these factors in detail, a surveillance system that includes information on socioeconomic indicators and other potential risk factors is needed (1,6,15). The mortality data used in this report are limited by the absence of data on factors known to affect infant survival (e.g., socioeconomic status, maternal education, parity, and early use of prenatal care). Moreover, the magnitude of the association between PNM and socioeconomic indicators may vary over time (17), perhaps because of the importance of economic deprivation (22,23). Among industrialized countries in Europe, higher infant mortality rates are associated with large income disparities between the rich and the poor (23,24). PNM attributable to SIDS decreased by 32% among black infants and white infants during 1980-1994, and most of this decline occurred after 1990. However, the twofold difference in SIDS mortality between blacks and whites increased further. Autopsy rates increased for both groups during this period and remained only slightly higher for black infants in 1994 (98.0% versus 95.5%). Thus, racial differences and trends in autopsy rates account for neither the higher SIDS mortality among black infants nor the important mortality decline during the 1990s for both races. No evidence suggests that more efficient use has occurred of information from autopsies of black infants (i.e., apparently, the information from the autopsies does not account for the reduction in the rate) or that low birth weight or demographic risk factors have decreased among blacks. The decline in SIDS mortality among black infants may be attributable in part to decreased prevalence of smoking among black women during pregnancy during 1989-1994 (25). A reduction in the population of infants sleeping prone has lowered SIDS rates internationally (26). Side and supine positioning of infants has increased across socioeconomic groups and may account for the more rapid decline of SIDS during the 1990s (27). Birth defects remain the leading cause of infant mortality in the United States. During 1980-1994, PNM caused by birth defects decreased, and the magnitude of the decline for white infants was one-and-a-half times that of black infants (30% versus 20%). Improved infant survival, the increased use of folic acid, and increased prenatal diagnosis may have reduced the proportion of postneonatal deaths caused by birth defects. Infant mortality because of cardiovascular birth defects is higher in nonmetropolitan than metropolitan areas (28); thus, increased access to care may reduce the number of these deaths. Population-based surveillance for birth defects will continue to provide survival, etiologic, and health services data (29). During 1980-1994, PNM caused by infections declined among white infants and black infants by approximately 30%. However, nearly 16% of postneonatal deaths among black infants was attributable to infections in 1994, and infectious diseases remained the second leading cause of PNM among black infants during the period. Because advances in infectious disease control resulted in dramatic reductions in infant mortality during the first half of this century (2,3,4) and infections persist as a leading cause of PNM in the 1990s, the prevention of infectious diseases warrants renewed attention. PNM attributable to most causes of injury declined among white infants and black infants during the 1980s; but PNM associated with motor vehicle crashes persisted during 1980-1994 despite high rates of recommended automobile passenger-restraint use in several metropolitan areas (30). Moreover, PNM caused by motor vehicle crashes decreased for white infants but increased for black infants during the period. Possible explanations of this paradox include a population shift from urban to less accessible suburban settings that has resulted in an increased number of crashes (31); increased child occupant fatalities during rush hours, which reflect changes in the transport of young children to and from day care settings (32); and an increase in the number of vehicle miles traveled for persons of low socioeconomic status (32,33). Although the rate of PNM caused by fire for black infants remained at approximately 2.5 times that of white infants in 1994, the relative risk of fire-related PNM decreased by nearly two thirds during the study period. Postneonatal homicide increased steadily as a cause of postneonatal death during 1980-1994 among white infants and black infants. In 1992, the rate of homicide among black infants was approximately 2.5 times that of white infants. A previous study suggests that when the rate is adjusted for socioeconomic status, this racial gap narrows (34). Poverty, as a positive predictor of metropolitan homicide, has been previously described (34,35,36). Strategies to improve adverse living conditions may also reduce these postneonatal deaths. In conclusion, PNM remains an important contributor to infant mortality, but nearly half of these deaths are caused by potentially preventable causes such as SIDS, infections, and injuries. In 1993, the year 2000 national health objective for PNM was achieved for white infants; however, these data suggest that the objective for black infants is unlikely to be met. Prevention strategies to further reduce PNM should include increasing access to comprehensive prenatal and pediatric care and scheduled immunizations; promoting smoke-free environments; promoting the supine sleeping position for infants; encouraging breast feeding; and advocating the use of recommended automobile passenger restraints and residential fire alarms. Further evaluation of the influence of socioeconomic status, environmental exposures, and health-care access and use are needed for planning effective prevention strategies. References
APPENDIX A TABLE A-1. Broad groupings of International Classification of Diseases (9th revision) Codes for underlying cause of death used in this surveillance summary (8). Perinatal conditions 760.0-779.9 Congenital anomalies 740.0-759.9 Infections 001.0-139.9 320.0-326.9 360.0-360.1 372.0 373.1-373.2 373.5-373.6 380.1-380.2 382.0-383.9 420.0-422.9 460.0-466.1 475.0 478.2 478.7 480.0-487.9 490.0 510.0-510.9 513.0-513.9 056.6-567.9 572.0-572.1 573.1-573.2 577.0 590.0-590.9 595.0 680.0-686.9 711.0-711.9 728.0 730.0-730.9 790.7-790.8 Injury E800.0-E969.9 E980.0-E989.9 Ill-defined 780.0-797.9 798.1-799.9 Sudden infant death syndrome 798.0-798.0 Other Remainder TABLE A-2. Detailed groupings of International Classification of Diseases (9th revision) Codes for Selected underlying causes of death used in this surveillance summary (8). Injuries (E800.0-E969.9, E980.0-E989.9) Unintentional Motor vehicle 810.0-825.9 Poisoning 850.0-869.9 Falls 880.0-888.9 Fire 890.0-899.9 Drowning 910.0-910.9 Suffocation, obstructive 911.0-912.9 Suffocation, mechanical 913.0-913.9 Other unintentional 800.0-807.9 826.0-849.9 870.0-879.9 900.0-909.9 914.0-949.9 Intentional Homicide 960.0-969.9 All Others 980.0-989.9 Birth defects (7400-7599) Central nervous system 740.0-742.9 Cardiovascular 745.0-747.9 Respiratory 748.0-748.9 Gastrointerstinal 749.0-751.9 Genitourinary 752.0-753.9 Musculoskeletal 754.0-756.9 Chromosomal 758.0-758.9 Other anomalies Remainder of 740.0-759.9 Infections Central nervous system 320.0-326.9 013.0-013.9 036.0-036.1 045.0-049.9 053.0-053.1 054.3 055.0 056.0-056.0 062.0-064.9 072.1-072.2 130.0 Respiratory 460.0-466.1 478.2 478.7 480.0-487.9 490.0-490.9 510.0-510.9 513.0-513.9 010.0-012.9 031.0 033.0-033.9 034.0 039.1 055.1 130.4 Gastrointestinal 566.0-567.9 572.0-572.1 573.1-573.2 577.0 001.0-009.9 014.0 039.2 070.0-070.9 127.0-127.9 Septicemia 038.0-038.9 Other 360.0-360.1 372.0 373.1-373.2 380.1-380.2 382.0-383.9 420.0-422.9 590.0-590.9 595.0 614.4 680.0-686.9 711.0-711.9 728.0 730.0-730.9 790.7-790.8 +-------------------------------------------------------------------
-------+
|
|
| Erratum: Vol. 47, No. SS-2
|
| **************************
|
| SOURCE:47(26);555 DATE:Jul 10 1998
|
|
|
| In the CDC Surveillance Summaries, "Postneonatal Mortality
|
| Surveillance -- United States, 1980-1994," on page 15,
information was |
| incorrectly presented in the results section of the abstract.
The third |
| sentence of that section should read, "The PNM ratio between
blacks and |
| whites remained steady at approximately 2.1 during 1982-1988 and
|
| gradually increased to 2.4 by 1994." This corrected sentence
also |
| replaces the fifth sentence under the Results heading on pages
16-17. |
|
|
+-------------------------------------------------------------------
-------+
TABLE 1. Number and rate of postneonatal mortality by race -- United States, 1980-1994
==================================================================================================================================================================================
Year          1980      1981       1982      1983       1984      1985      1986       1987      1988       1989      1990       1991      1992       1993      1994      Total
--------------------------------------------------------------------------------------------------------------------------------------------------------------------------------
                                                                                 Number of deaths

Whites       10,194     9,885      9,700     9,698      9,550     9,631     9,308      9,362     9,579      9,366     9,132      8,959     8,249      7,989     7,404    138,006
Blacks        4,300     3,857      3,898     3,965      3,879     3,723     3,907      3,941     4,145      4,506     4,385      4,317     4,052      3,842     3,572     60,289
All          14,908    14,183     14,066    14,120     13,889    13,851    13,679     13,781    14,220     14,487    14,042     13,788    12,779     12,289    11,459    205,541

                                                                           Rate per 1,000 live births

Whites         3.5       3.4        3.3       3.3        3.2       3.2       3.1        3.1       3.1        2.9       2.8        2.8       2.6        2.5       2.4       3.0
Blacks         7.6       6.8        6.9       7.0        6.8       6.4       6.6        6.4       6.5        6.7       6.4        6.3       6.0        5.8       5.6       6.5
All            4.1       3.9        3.8       3.9        3.8       3.7       3.6        3.6       3.6        3.6       3.4        3.4       3.1        3.1       2.9       3.6

                                                                                       Ratio

Ratio,
  Blacks:
  Whites       2.2       2.0        2.1       2.1        2.1       2.0       2.1        2.1       2.1        2.3       2.3        2.3       2.3        2.3       2.4       2.2
--------------------------------------------------------------------------------------------------------------------------------------------------------------------------------
==================================================================================================================================================================================
Return to top. Table_2 Note: To print large tables and graphs users may have to change their printer settings to landscape and use a small font size.
TABLE 2. Postneonatal mortality rate by race and cause of death -- United States, 1980 and 1994
====================================================================================================================================================
                                                             White                                                        Black
                          ----------------------------------------------------------    ----------------------------------------------------------
                                    1980                     1994                                 1980                     1994
                          ----------------------   ----------------------               ---------------------    ---------------------
                            Rate per                 Rate per               Percent       Rate per                 Rate per               Percent
                            100,000                  100,000                 change       100,000                  100,000                 change
Cause of death            live births    Percent   live births    Percent   per year    live births   Percent    live births   Percent    per year
--------------------------------------------------------------------------------------------------------------------------------------------------
Sudden infant death
  syndrome                      117.4       33.8          79.8       37.0       -2.0          266.9      35.3          180.9      32.2        -1.8
Congenital
  anomalies                      67.1       19.3          46.2       19.5       -2.6           82.6      10.9           61.3      10.9        -1.2
Infections                       41.9       12.1          27.3       11.5       -3.5          124.8      16.5           87.8      15.6        -2.2
Injuries                         30.7        8.8          22.2        9.4       -1.6           69.0       9.1           58.7      10.5        -0.3
Perinatal conditions             19.4        5.6          12.5        5.3       -3.3           50.3       6.7           53.9       9.6        +0.5
Ill-defined conditions            9.1        2.6          12.6        5.3       +2.8           28.3       3.7           41.2       7.3        +3.2
Others                           61.6       17.7          36.7       15.5       -3.7          135.0      17.8           74.5      13.8        -3.8

Total                           347.0      100.0         237.0      100.0       -2.4          757.0     100.0          561.0     100.0        -1.5
--------------------------------------------------------------------------------------------------------------------------------------------------
====================================================================================================================================================
Return to top. Figure_2 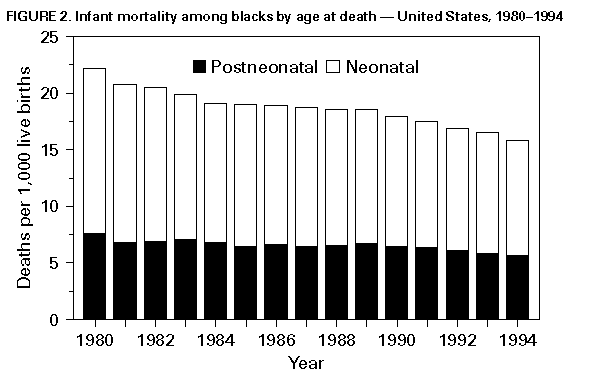 Return to top. Table_3 Note: To print large tables and graphs users may have to change their printer settings to landscape and use a small font size.
TABLE 3. Postneonatal mortality rate by region and race -- United States, 1980 and 1994
=============================================================================================================
                               White                             Black
                   ----------------------------       ----------------------------
                   Rate per 1,000                     Rate per 1,000
                     live births      Percent          live births       Percent       Black-to-white ratio
                   ---------------     change         --------------      change       --------------------
Region             1980       1994    1980-1994       1980      1994     1980-1994      1980          1994
-----------------------------------------------------------------------------------------------------------
Northeast           2.9        2.4      -17.2          7.2       5.6       -22.2         2.5           2.3
North-central       3.4        2.4      -29.4          8.7       6.7       -23.0         2.6           2.8
South               3.6        2.5      -30.6          7.2       5.1       -29.2         2.0           2.0
West                3.8        2.5      -34.2          7.6       6.2       -18.4         2.0           2.5
-----------------------------------------------------------------------------------------------------------
=============================================================================================================
Return to top. Table_4 Note: To print large tables and graphs users may have to change their printer settings to landscape and use a small font size.
TABLE 4. Postneonatal mortality rates for sudden infant death syndrome as underlying cause of death, by region and race
-- United States, 1980 and 1994
===================================================================================================================================================
                                               White                                                            Black
                   -------------------------------------------------------------    -------------------------------------------------------------
                             1980                      1994                                   1980                      1994
                   ----------------------    ----------------------     Percent     ----------------------    ----------------------     Percent
                    Rate per                  Rate per                 change in     Rate per                   Rate per                change in
                     100,000      Autopsy      100,000      Autopsy      rate         100,000      Autopsy      100,000      Autopsy       rate
Region             live births    percent    live births    percent    1980-1994    live births    percent    live births    percent    1980-1994
-------------------------------------------------------------------------------------------------------------------------------------------------
Northeast               86.4        86.4          57.4        97.3        -33.6         280.5        95.9         163.3        99.0        -41.8
North-central          117.6        81.8          86.1        96.7        -26.8         345.6        93.9         242.8        98.1        -29.7
South                  103.3        70.2          82.4        91.4        -20.2         223.0        64.3         155.1        95.9        -30.5
West                   162.2        93.6          91.3        96.6        -43.7         330.3        99.4         229.4        99.2        -30.5

Total                  117.4        83.0          79.8        95.5        -32.0         266.9        88.4         180.9        98.0        -32.2
-------------------------------------------------------------------------------------------------------------------------------------------------
===================================================================================================================================================
Return to top. Table_5 Note: To print large tables and graphs users may have to change their printer settings to landscape and use a small font size.
TABLE 5. Postneonatal mortality rate for birth defects as underlying cause of death, by type of defect and race -- United
States, 1980-1981 and 1993-1994
======================================================================================================================================================
                                                  White                                                            Black
                      --------------------------------------------------------------   -------------------------------------------------------------
                             1980-1981                1993-1994                             1980-1981               1993-1994
                      ---------------------    ---------------------                   --------------------    ---------------------
                       Rate per                 Rate per                   Percent      Rate per                Rate per                   Percent
Type of birth           100,000                  100,000                  change per     100,000                 100,000                  change per
defect                live births   Percent    live births   Percent         year      live births  Percent    live births   Percent         year
----------------------------------------------------------------------------------------------------------------------------------------------------
Cardiovascular             36.7       57.7          25.1       54.6          -2.7           41.9      51.9          34.7       53.6          -1.2
Central nervous
  system                    9.9       15.0           5.2       11.2          -5.1           12.9      16.0           7.6       11.7          -3.4
Musculoskeletal             2.2        3.3           1.9        4.1          -0.9            2.5       3.1           2.9        4.4          +0.1
Respiratory                 1.6        2.4           1.9        4.1          +1.6            3.0       3.7           2.4        3.7          -0.9
Gastrointestinal            3.9        5.9           1.2        2.7          -8.8            5.3       6.6           1.7        2.6          -7.7
Chromosomal                 7.0       10.6           6.6       14.4          -0.5            8.6      10.7          10.3       16.0          +1.6
Other                       4.6        6.9           3.8        8.2          -1.3            6.4       8.0           4.3        6.7          -1.6

Total                      66.0      100.0          46.0      100.0          -2.6           81.0     100.0          65.0      100.0          -1.2
----------------------------------------------------------------------------------------------------------------------------------------------------
======================================================================================================================================================
Return to top. Table_6 Note: To print large tables and graphs users may have to change their printer settings to landscape and use a small font size.
TABLE 6. Postneonatal mortality rate for infections as underlying cause of death, by type of infection and race -- United
States, 1980-1981 and 1993-1994
=====================================================================================================================================================
                                                  White                                                            Black
                     -------------------------------------------------------------    -------------------------------------------------------------
                            1980-1981                1993-1994                              1980-1981                1993-1994
                     ----------------------   ----------------------                  ---------------------    ---------------------
                       Rate per                 Rate per                  Percent       Rate per                 Rate per                  Percent
                       100,000                  100,000                 change per      100,000                  100,000                 change per
Type of infection    live births    Percent   live births    Percent       year       live births   Percent    live births   Percent        year
---------------------------------------------------------------------------------------------------------------------------------------------------
Respiratory              18.4         44.0        11.6         43.8        -3.3           56.7        48.9         30.4        38.1         -4.3
Central nervous
  system                  8.8         21.1         2.1          7.8       -10.7           21.1        18.2         14.8        18.6         -8.6
Septicemia                5.5         13.2         4.5         17.1        -2.6           16.9        14.6         12.3        15.4         -2.2
Gastrointestinal          2.8          6.7         2.4          9.2        -2.1           10.5         9.1         12.7        15.8         -0.4
Other                     6.3         15.0         5.8         22.0        -0.2           10.7         9.2         20.2        25.3         +6.9

Total                    42.0        100.0        27.0        100.0        -3.5          116.0       100.0         80.0       100.0         -2.4
---------------------------------------------------------------------------------------------------------------------------------------------------
=====================================================================================================================================================
Return to top. Table_7 Note: To print large tables and graphs users may have to change their printer settings to landscape and use a small font size.
TABLE 7. Postneonatal mortality rate for injury as cause of death, by type of injury and race, United States, 1980-1981 and
1993-1994
============================================================================================================================================================
                                                 White                                                                Black
                    -----------------------------------------------------------------    -----------------------------------------------------------------
                            1980-1981                  1993-1994                                1980-1981                  1993-1994
                    ------------------------   ------------------------                  -----------------------    -----------------------
                     Rate per                   Rate per                    Percent       Rate per                   Rate per                    Percent
                      100,000                    100,000                   change per      100,000                    100,000                   change per
Type of injury      live births    Percent *   live births    Percent *       year       live births   Percent *    live births   Percent *        year
----------------------------------------------------------------------------------------------------------------------------------------------------------
Unintentional
  Suffocation             8.6         30.3           7.5         33.2          -1.8           19.9        31.8           16.3        28.1           -0.4
  Motor vehicle
    crash                 6.1         21.5           3.8         16.8          -3.3            5.3         8.5            7.2        12.4           +2.7
  Fire                    2.9         10.2           2.0          8.8          -2.5            9.2        14.7            5.8         9.9           -4.7
  Drowning                2.0          7.2           1.5          6.7          -2.2            3.0         4.8            2.9         4.9           +1.7
  Falls                   1.1          3.7           0.4          1.6          -7.6            2.3         3.7            0.7         1.2          -11.7
  Poisoning               0.4          1.3           0.3          1.1          -1.7            0.8         1.3            0.8         1.3           -2.0
  Other                   2.4          8.6           1.5          6.5          -3.0            6.0         9.6            3.9         6.3           -3.9
  Total                  23.5         82.8          17.0         75.2          -2.3           46.5        74.4           37.6        64.9           -1.1

Intentional
  Homicide                3.6         12.5           4.9         21.9           3.2           11.3        18.1           17.1        29.9           +3.8

All others                1.3          4.7           0.7          3.3          -3.5            4.7         7.5            3.2         5.6           -4.7

Total                    28.4        100.0          22.6        100.0          -1.6           62.5       100.0           57.9       100.0           -0.4
----------------------------------------------------------------------------------------------------------------------------------------------------------
* Percentages for each variable might not add up to total because of rounding.
============================================================================================================================================================
Return to top. Disclaimer All MMWR HTML versions of articles are electronic conversions from ASCII text into HTML. This conversion may have resulted in character translation or format errors in the HTML version. Users should not rely on this HTML document, but are referred to the electronic PDF version and/or the original MMWR paper copy for the official text, figures, and tables. An original paper copy of this issue can be obtained from the Superintendent of Documents, U.S. Government Printing Office (GPO), Washington, DC 20402-9371; telephone: (202) 512-1800. Contact GPO for current prices. **Questions or messages regarding errors in formatting should be addressed to mmwrq@cdc.gov.Page converted: 10/05/98 |
|||||||||
This page last reviewed 5/2/01
|