 |
|
|
|
|
|
|
| ||||||||||
|
|
|
|
|
|
|
||||
| ||||||||||
|
|
|
|
|
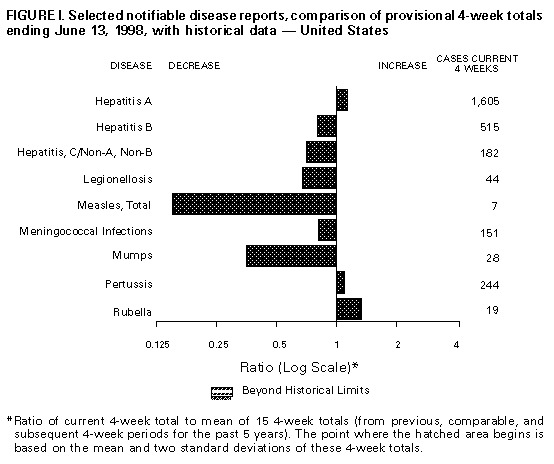
Persons using assistive technology might not be able to fully access information in this file. For assistance, please send e-mail to: mmwrq@cdc.gov. Type 508 Accommodation and the title of the report in the subject line of e-mail. Notifiable Diseases/Deaths in Selected Cities Weekly InformationFigure_I Selected notifiable disease reports, comparison of provisional 4-week totals ending June 13, 1998, with historical data -- United States Table_I Summary -- provisional cases of selected notifiable diseases, United States, cumulative, week ending June 13, 1998 (23rd Week) Table_II Provisional cases of selected notifiable diseases, United States, weeks ending June 13, 1998 and June 7, 1997 (23rd Week) Table_III Provisional cases of selected notifiable diseases preventable by vaccination, United States, weeks ending June 13, 1998 and June 7, 1997 (23rd Week) Table_IV Deaths in 122 U.S. cities, week ending
June 13, 1998 (23rd Week)
TABLE I. Summary -- provisional cases of specified notifiable diseases, United
States, cumulative, week ending June 13, 1998 (23rd Week)
==================================================================================
                                             Cum. 1998
------------------------------------------------------
Anthrax                                              -
Brucellosis                                         11
Cholera                                              3
Congenital rubella syndrome                          2
Cryptosporidiosis*                                 778
Diphtheria                                           1
Encephalitis:  California*                           2
               eastern equine*                       -
               St. Louis*                            -
               western equine*                       -
Hansen Disease                                      47
Hantavirus pulmonary syndrome*+                      4
Hemolytic uremic syndrome, post-diarrheal*          14
HIV infection, pediatric*&                         106
Plague                                               1
Poliomyelitis, paralytic@                            -
Psittacosis                                         20
Rabies, human                                        -
Rocky Mountain spotted fever (RMSF)                 52
Streptococcal disease, invasive Group A            999
Streptococcal toxic-shock syndrome*                 32
Syphilis, congenital**                             128
Tetanus                                             10
Toxic-shock syndrome                                59
Trichinosis                                          5
Typhoid fever                                      125
Yellow fever                                         -
------------------------------------------------------
-: no reported cases
 * Not notifiable in all states
 + Updated weekly from reports to the Division of Viral and Rickettsial
   Diseases, National Center for Infectious Diseases (NCID).
 & Updated monthly to the Division of HIV/AIDS Prevention -- Surveillance
   and Epidemiology, National Center for HIV, STD, and TB Prevention
   (NCHSTP), last update May 24, 1998.
 @ One suspected case(s) of polio with onset in 1998 have also been reported
   to date.
** Updated from reports to the Division of STD Prevention, NCHSTP.

==================================================================================
Return to top. Table_II Note: To print large tables and graphs users may have to change their printer settings to landscape and use a small font size.
TABLE II. (page 1) Provisional cases of selected notifiable diseases, United States, weeks ending
June 13, 1998, and June 7, 1997 (23rd Week)
Escherichia
coli O157:H7
------------------- Hepatitis
AIDS* Chlamydia NETSS** PHLIS*** Gonorrhea C\NA,NB
----------------- -------------------- -------- -------- ------------------- ----------------
Cum. Cum. Cum. Cum. Cum. Cum. Cum. Cum. Cum. Cum.
Reporting Area 1998 1997 1998 1997 1998 1998 1998 1997 1998 1997
------------------------------------------------------------------------------------------------------------------------------
UNITED STATES 20,034 25,974 227,200 212,415 533 278 133,823 122,134 1,721 1,531
NEW ENGLAND 640 897 8,359 7,661 75 52 2,208 2,575 19 29
Maine 13 25 405 427 4 - 22 25 - -
N.H. 21 14 401 341 11 11 41 56 - -
Vt. 10 18 168 178 1 - 13 24 - 1
Mass. 275 416 3,732 3,160 40 30 892 977 18 25
R.I. 58 70 1,109 917 3 1 166 213 1 3
Conn. 263 354 2,544 2,638 16 10 1,074 1,280 - -
MID. ATLANTIC 5,695 8,265 28,013 25,256 44 10 15,546 15,368 184 151
Upstate N.Y. 710 1,336 N N 36 - 2,667 2,661 138 117
N.Y. City 3,153 4,136 15,010 13,319 2 5 6,428 5,867 - -
N.J. 993 1,783 4,412 4,575 6 4 2,600 3,214 - -
Pa. 839 1,010 8,591 7,362 N 1 3,851 3,626 46 34
E.N. CENTRAL 1,518 1,809 38,765 32,368 93 49 25,982 19,204 217 292
Ohio 281 394 10,972 9,750 22 6 6,527 5,971 6 7
Ind. 293 328 3,288 3,846 25 20 2,083 2,613 3 9
Ill. 610 602 11,133 5,792 26 - 8,762 2,837 10 48
Mich. 252 394 9,739 8,235 20 7 7,185 5,816 198 212
Wis. 82 91 3,633 4,745 N 16 1,425 1,967 - 16
W.N. CENTRAL 351 520 13,194 13,907 69 32 6,496 6,148 109 32
Minn. 56 83 1,923 2,890 28 17 679 1,012 5 2
Iowa 20 66 1,878 2,061 13 - 570 552 12 15
Mo. 176 254 5,120 5,142 10 12 3,821 3,299 88 4
N. Dak. 4 4 290 375 1 1 29 24 - 2
S. Dak. 9 2 711 535 1 1 119 54 - -
Nebr. 36 48 989 871 7 - 343 322 2 2
Kans. 50 63 2,283 2,033 9 1 935 885 2 7
S. ATLANTIC 5,037 6,477 47,546 38,072 39 16 38,513 36,400 86 96
Del. 57 111 1,126 612 - 1 605 477 - -
Md. 571 742 3,661 3,206 11 4 4,108 5,163 5 3
D.C. 413 469 N N 1 - 1,539 1,840 - -
Va. 368 552 4,314 5,010 N 7 2,694 3,449 4 9
W. Va. 47 38 1,298 1,364 N 1 370 429 3 7
N.C. 335 363 10,078 7,410 9 3 8,430 7,191 12 27
S.C. 318 295 8,307 5,377 1 - 5,407 4,938 1 20
Ga. 608 856 10,669 4,031 4 - 8,984 5,305 8 -
Fla. 2,320 3,051 8,093 11,062 12 - 6,376 7,608 53 30
E.S. CENTRAL 788 807 16,236 14,329 39 11 15,431 14,334 67 151
Ky. 101 112 2,716 2,877 10 - 1,526 1,846 11 7
Tenn. 272 354 5,590 5,493 20 10 4,741 4,505 53 91
Ala. 233 196 4,270 3,389 9 - 5,476 4,799 3 5
Miss. 182 145 3,660 2,570 U 1 3,688 3,184 U 48
W.S. CENTRAL 2,473 2,590 34,384 21,535 29 5 19,562 14,615 474 178
Ark. 81 96 1,319 1,145 1 1 1,120 1,920 2 5
La. 415 493 5,471 3,468 - 1 4,531 3,279 9 95
Okla. 134 138 4,496 3,181 4 3 2,443 1,994 5 4
Tex. 1,843 1,863 23,098 13,741 24 - 11,468 7,422 458 74
MOUNTAIN 725 751 7,663 12,115 51 39 2,814 3,348 205 161
Mont. 13 18 556 450 3 - 23 18 4 7
Idaho 14 22 846 617 6 - 74 45 82 22
Wyo. 2 13 292 235 1 - 15 25 35 58
Colo. 127 194 - 2,018 14 10 1,020 791 13 19
N. Mex. 111 66 1,684 1,723 9 6 311 391 40 28
Ariz. 286 188 3,315 5,035 N 9 1,213 1,611 2 17
Utah 57 60 717 734 11 8 66 96 16 3
Nev. 115 190 253 1,303 7 6 92 371 13 7
PACIFIC 2,807 3,858 33,040 47,172 94 64 7,271 10,142 360 441
Wash. 203 287 4,723 4,062 22 22 796 867 10 12
Oreg. 88 144 2,455 2,101 26 21 329 320 2 2
Calif. 2,463 3,377 24,204 39,646 45 18 5,836 8,549 294 347
Alaska 12 22 835 614 1 - 145 183 1 -
Hawaii 41 28 823 749 N 3 165 223 53 80
Guam - 2 8 193 N - 2 27 - -
P.R. 834 760 U U - U 184 288 - 57
V.I. 17 35 N N N U U U U U
Amer. Samoa - - U U N U U U U U
C.N.M.I. - 1 N N N U 7 16 - 2
------------------------------------------------------------------------------------------------------------------------------
N: Not notifiable U: Unavailable -: no reported cases C.N.M.I.: Commonwealth of North Mariana Islands
* Updated monthly to the Division of HIV/AIDS Prevention, -- Surveillance and Epidemiology, National Center for HIV, STD,
and TB Prevention, last update May 24, 1998.
** National Electronic Telecommunications System for Surveillance.
*** Public Health Laboratory Information System.
=======================================================================================================================================================
TABLE II. (page 2) Provisional cases of selected notifiable diseases, United States, weeks ending
June 13, 1998, and June 7, 1997 (23rd Week)
Lyme Syphilis Rabies,
Legionellosis Disease Malaria (Primary & Secondary) Tuberculosis Animal
---------------- ---------------- ---------------- --------------------- ----------------- -------
Cum. Cum. Cum. Cum. Cum. Cum. Cum. Cum. Cum. Cum. Cum.
Reporting Area 1998 1997 1998 1997 1998 1997 1998 1997 1998 * 1997 1998
-------------------------------------------------------------------------------------------------------------------------------------------
UNITED STATES 440 362 1,933 1,501 455 596 2,925 3,823 3,295 8,596 3,046
NEW ENGLAND 22 25 558 343 18 23 33 72 138 177 600
Maine 1 1 1 3 2 1 1 - U 15 97
N.H. 2 4 12 7 3 2 1 - 2 6 33
Vt. 1 4 3 3 - 2 2 - - 3 30
Mass. 8 8 119 50 11 16 21 39 114 90 193
R.I. 4 4 31 37 2 2 - 1 22 13 35
Conn. 6 4 392 243 - - 8 32 U 50 212
MID. ATLANTIC 96 61 1,067 890 117 170 96 182 244 1,328 665
Upstate N.Y. 28 13 579 116 32 25 13 19 U 186 465
N.Y. City 15 3 3 73 54 100 22 34 U 692 U
N.J. 4 9 124 247 17 33 18 83 244 267 86
Pa. 49 36 361 454 14 12 43 46 U 183 114
E.N. CENTRAL 141 138 33 26 41 66 405 345 225 771 41
Ohio 62 62 31 11 2 6 72 107 5 139 32
Ind. 19 23 2 9 3 6 66 74 U 66 -
Ill. 14 5 - 2 15 29 155 35 220 406 2
Mich. 28 31 - 4 20 17 89 59 U 112 6
Wis. 18 17 U U 1 8 23 70 U 48 1
W.N. CENTRAL 30 26 21 14 28 16 68 76 104 199 316
Minn. 3 1 9 9 13 5 3 13 U 49 62
Iowa 3 7 9 - 2 6 - 3 U 20 68
Mo. 11 2 - 4 10 3 52 39 75 85 17
N. Dak. - 2 - - 1 - - - U 4 60
S. Dak. - 1 - - - - 1 - 9 4 54
Nebr. 10 10 1 1 - 1 4 1 5 4 2
Kans. 3 3 2 - 2 1 8 20 15 33 53
S. ATLANTIC 54 47 176 139 114 106 1,231 1,538 620 1,344 952
Del. 7 5 3 27 1 2 15 14 - 14 17
Md. 10 10 124 87 40 39 293 430 121 127 241
D.C. 3 3 4 6 7 7 36 57 49 43 -
Va. 5 9 13 2 18 26 76 128 118 140 295
W. Va. N N 4 - - - 2 3 24 24 40
N.C. 6 6 5 7 8 6 344 320 180 166 136
S.C. 5 2 1 1 3 7 139 178 128 110 68
Ga. - - 2 1 14 12 228 277 U 247 63
Fla. 17 12 20 8 23 7 98 131 U 473 92
E.S. CENTRAL 18 16 21 32 11 14 500 829 160 523 120
Ky. 11 4 5 4 1 3 53 70 U 73 18
Tenn. 4 6 8 10 7 4 254 345 U 187 70
Ala. 3 1 8 4 3 4 114 214 160 173 32
Miss. U 5 U 14 U 3 79 200 U 90 U
W.S. CENTRAL 13 5 6 10 12 7 368 514 53 1,097 100
Ark. - - 3 3 1 1 48 86 53 87 21
La. 1 1 - 1 4 4 117 176 - 85 -
Okla. 6 1 - 2 2 2 24 54 U 84 79
Tex. 6 3 3 4 5 - 179 198 U 841 -
MOUNTAIN 27 24 2 4 23 34 85 84 193 237 72
Mont. 1 1 - - - 2 - - 12 7 25
Idaho - 2 - - 3 - - - 4 5 -
Wyo. 1 1 - 1 - 1 1 - 2 2 39
Colo. 5 5 1 1 7 16 6 2 U 48 1
N. Mex. 2 1 - - 8 5 12 4 27 17 -
Ariz. 4 7 - 1 4 4 61 69 91 102 7
Utah 13 4 - - 1 2 3 3 28 10 -
Nev. 1 3 1 1 - 4 2 6 29 46 -
PACIFIC 39 20 49 43 91 160 139 183 1,558 2,920 180
Wash. 4 5 1 1 7 8 9 6 7 124 -
Oreg. - - 7 9 9 10 2 3 U 68 -
Calif. 35 14 41 33 74 136 128 172 1,467 2,600 163
Alaska - - - - - 3 - 1 19 40 17
Hawaii - 1 - - 1 3 - 1 65 88 -
Guam - - - - - - - 3 - 13 -
P.R. - - - - - 3 108 97 46 88 27
V.I. U U U U U U U U U U U
Amer. Samoa U U U U U U U U U U U
C.N.M.I. - - - - - - 1 6 8 - -
-------------------------------------------------------------------------------------------------------------------------------------------
N: Not notifiable U: Unavailable -: no reported cases
* Additional information about areas displaying 'U' for cumulative Tuberculosis cases can be found in Notices to Readers, MMWR Vol. 47, No. 2, p. 39.
=======================================================================================================================================================
Return to top. Table_III Note: To print large tables and graphs users may have to change their printer settings to landscape and use a small font size.
TABLE III. (page 1) Provisional cases of selected notifiable diseases preventable by vaccination, United
States, weeks ending June 13, 1998, and June 7, 1997 (23rd Week)
Hepatitis (Viral), by type Measles (Rubeola)
H. influenzae, --------------------------------------- ------------------------------------------------------------
invasive A B Indigenous Imported** Total
---------------- ----------------- ----------------- --------------- --------------- ---------------
Cum. Cum. Cum. Cum. Cum. Cum. Cum. Cum. Cum. Cum.
Reporting Area 1998* 1997 1998 1997 1998 1997 1998 1998 1998 1998 1998 1997
-----------------------------------------------------------------------------------------------------------------------------------------------------
UNITED STATES 501 532 9,412 12,383 3,318 4,089 1 17 - 11 28 65
NEW ENGLAND 26 31 123 290 48 75 - - - 1 1 9
Maine 2 3 12 37 - 4 - - - - - -
N.H. 1 4 7 17 7 5 - - - - - -
Vt. 2 2 10 6 1 2 - - - - - -
Mass. 19 19 34 147 15 35 - - - 1 1 8
R.I. 2 2 9 24 25 8 - - - - - -
Conn. - 1 51 59 - 21 - - - - - 1
MID. ATLANTIC 72 64 590 1,087 505 610 - 3 - 1 4 12
Upstate N.Y. 28 4 151 126 139 110 - 2 - - 2 4
N.Y. City 12 21 156 483 130 245 - - - - - 5
N.J. 28 25 113 157 90 116 - 1 - - 1 2
Pa. 4 14 170 321 146 139 - - - 1 1 1
E.N. CENTRAL 81 83 1,188 1,351 327 699 - 9 - 2 11 7
Ohio 33 41 151 189 31 41 - - - - - -
Ind. 24 8 73 137 26 48 - 2 - 1 3 -
Ill. 23 24 213 329 62 139 - - - - - 5
Mich. - 10 666 600 193 218 - 7 - 1 8 2
Wis. 1 - 85 96 15 253 - - - - - -
W.N. CENTRAL 31 23 802 866 150 243 - - - - - 11
Minn. 17 14 60 71 16 18 - - - - - 2
Iowa 1 3 353 125 23 17 - - - - - -
Mo. 8 3 315 478 85 183 - - - - - 1
N. Dak. - - 2 9 4 1 - - - - - -
S. Dak. - 2 8 12 1 - U - U - - 8
Nebr. - 1 15 35 7 8 - - - - - -
Kans. 5 - 49 136 14 16 U - U - - -
S. ATLANTIC 105 92 780 620 469 476 1 2 - 5 7 3
Del. - - 2 11 - 3 - - - 1 1 -
Md. 33 38 155 104 75 72 - - - 1 1 1
D.C. - - 28 14 6 21 - - - - - 1
Va. 12 6 121 79 48 56 - - - 2 2 -
W. Va. 4 3 1 6 3 8 - - - - - -
N.C. 12 15 41 95 82 108 - - - - - 1
S.C. 3 3 16 59 1 48 - - - - - -
Ga. 20 18 156 117 66 47 - - - 1 1 -
Fla. 21 9 260 135 188 113 1 2 - - 2 -
E.S. CENTRAL 31 35 170 310 181 300 - - - - - -
Ky. 4 4 10 37 22 18 - - - - - -
Tenn. 20 21 116 186 131 191 - - - - - -
Ala. 7 8 44 48 28 32 - - - - - -
Miss. U 2 U 39 U 59 U U U U U -
W.S. CENTRAL 27 25 1,716 2,502 524 481 - - - - - 4
Ark. - 1 37 117 30 32 - - - - - -
La. 12 6 37 99 45 53 - - - - - -
Okla. 13 16 259 759 32 15 - - - - - -
Tex. 2 2 1,383 1,527 417 381 - - - - - 4
MOUNTAIN 64 56 1,543 1,854 368 399 - - - - - 7
Mont. - - 50 50 3 5 - - - - - -
Idaho - 1 119 74 16 14 - - - - - -
Wyo. - 1 22 18 2 12 - - - - - -
Colo. 14 9 119 208 44 78 - - - - - -
N. Mex. 4 5 80 138 148 134 - - - - - -
Ariz. 36 16 986 862 102 87 - - - - - 5
Utah 4 3 99 328 30 46 U - U - - -
Nev. 6 21 68 176 23 23 - - - - - 2
PACIFIC 64 123 2,500 3,503 746 806 - 3 - 2 5 12
Wash. 3 2 538 238 61 31 - - - 1 1 -
Oreg. 28 21 186 177 53 52 - - - - - -
Calif. 27 96 1,742 3,001 621 707 - 3 - 1 4 9
Alaska 1 1 11 22 6 10 - - - - - -
Hawaii 5 3 23 65 5 6 U - U - - 3
Guam - - - - - 3 U - U - - -
P.R. 2 - 19 165 221 644 - - - - - -
V.I. U U U U U U U U U U U U
Amer. Samoa U U U U U U U U U U U U
C.N.M.I. - 5 - 1 7 24 U - U - - 1
-----------------------------------------------------------------------------------------------------------------------------------------------------
N: Not notifiable U: Unavailable -: no reported cases
* Of 118 cases among children aged <5 years, serotype was reported for 62 and of those, 28 were type b.
** For imported measles, cases include only those resulting from importation from other countries.
=======================================================================================================================================================
TABLE III. (page 2) Provisional cases of selected notifiable diseases preventable by vaccination, United
States, weeks ending June 13, 1998, and June 7, 1997 (23rd Week)
Meningococcal
Disease Mumps Pertussis Rubella
----------------- -------------------------- --------------------------- ---------------------------
Cum. Cum. Cum. Cum. Cum. Cum. Cum. Cum.
Reporting Area 1998 1997 1998 1998 1997 1998 1998 1997 1998 1998 1997
------------------------------------------------------------------------------------------------------------------------------------------
UNITED STATES 1,346 1,828 10 218 309 78 1,855 2,357 2 226 56
NEW ENGLAND 66 113 - - 7 8 307 514 - 32 -
Maine 4 11 - - - - 5 6 - - -
N.H. 4 11 - - - - 23 61 - - -
Vt. 1 2 - - - - 30 164 - - -
Mass. 31 61 - - 2 8 240 261 - 6 -
R.I. 3 7 - - 4 - 3 12 - - -
Conn. 23 21 - - 1 - 6 10 - 26 -
MID. ATLANTIC 136 182 3 14 34 10 246 185 2 108 13
Upstate N.Y. 34 43 - 3 5 3 117 63 2 103 2
N.Y. City 15 32 - 4 1 - 4 45 - 2 11
N.J. 36 35 - - 6 - 5 11 - 2 -
Pa. 51 72 3 7 22 7 120 66 - 1 -
E.N. CENTRAL 197 265 3 39 36 9 174 225 - - 3
Ohio 79 100 2 19 13 3 66 65 - - -
Ind. 25 31 - 3 4 1 48 27 - - -
Ill. 47 82 - 1 8 4 14 28 - - -
Mich. 25 27 1 16 10 1 29 30 - - -
Wis. 21 25 - - 1 - 17 75 - - 3
W.N. CENTRAL 106 128 - 19 8 1 141 133 - 3 -
Minn. 16 17 - 10 3 - 79 84 - - -
Iowa 15 25 - 5 4 1 35 7 - - -
Mo. 46 63 - 3 - - 12 21 - 2 -
N. Dak. - 1 - 1 - - - 2 - - -
S. Dak. 6 4 U - - U 4 1 U - -
Nebr. 4 5 - - 1 - 5 3 - - -
Kans. 19 13 U - - U 6 15 U 1 -
S. ATLANTIC 237 309 1 31 35 5 117 194 - 5 17
Del. 1 4 - - - - 1 - - - -
Md. 22 31 - - 1 3 25 73 - - -
D.C. - 5 - - - - 1 2 - - -
Va. 21 30 - 4 4 - 6 19 - - 1
W. Va. 7 12 - - - - 1 4 - - -
N.C. 31 55 - 7 7 - 42 46 - 3 10
S.C. 36 37 - 4 9 - 13 9 - - 6
Ga. 50 58 - 1 5 1 3 6 - - -
Fla. 69 77 1 15 9 1 25 35 - 2 -
E.S. CENTRAL 101 130 - - 18 3 48 42 - - -
Ky. 16 34 - - 2 - 18 11 - - -
Tenn. 39 41 - - 3 3 17 13 - - -
Ala. 46 38 - - 6 - 13 12 - - -
Miss. U 17 U U 7 U U 6 U U -
W.S. CENTRAL 149 186 1 31 35 8 122 70 - 60 3
Ark. 22 25 - - - - 15 4 - - -
La. 35 33 - 2 7 1 1 11 - - -
Okla. 26 22 - - - - 13 8 - - -
Tex. 66 106 1 29 28 7 93 47 - 60 3
MOUNTAIN 78 110 1 21 41 26 415 618 - 5 4
Mont. 2 8 - - - - 1 7 - - -
Idaho 3 7 - 3 2 13 178 408 - - 1
Wyo. 3 - - 1 1 - 7 4 - - -
Colo. 18 31 1 4 3 7 77 144 - - -
N. Mex. 13 19 N N N - 61 32 - 1 -
Ariz. 28 23 - 4 25 2 61 11 - 1 3
Utah 8 11 U 3 5 U 19 4 U 2 -
Nev. 3 11 - 6 5 4 11 8 - 1 -
PACIFIC 276 405 1 63 95 8 285 376 - 13 16
Wash. 35 50 - 5 12 1 131 163 - 9 3
Oreg. 51 84 N N N 1 17 23 - - -
Calif. 185 268 1 43 67 6 132 179 - 2 7
Alaska 1 1 - 2 5 - - 2 - - -
Hawaii 4 2 U 13 11 U 5 9 U 2 6
Guam - 1 U - 1 U - - U - -
P.R. 4 9 - 1 4 - 2 - - - -
V.I. U U U U U U U U U U U
Amer. Samoa U U U U U U U U U U U
C.N.M.I. - - U - 4 U - - U - -
------------------------------------------------------------------------------------------------------------------------------------------
N: Not notifiable U: Unavailable -: no reported cases
=======================================================================================================================================================
Return to top. Table_IV Note: To print large tables and graphs users may have to change their printer settings to landscape and use a small font size.
TABLE IV. Deaths in 122 U.S. cities,* week ending
June 13, 1998 (23rd Week)
===================================================================================================================================
All Causes, By Age (Years)
------------------------------------------------------------------------ P&I**
Reporting Area All Ages >=65 45-64 25-44 1-24 <1 Total
---------------------------------------------------------------------------------------------------------------
NEW ENGLAND 582 403 106 43 17 13 32
Boston, Mass. 122 70 31 9 8 4 6
Bridgeport, Conn. 44 33 9 2 - - 3
Cambridge, Mass. 19 17 1 1 - - 1
Fall River, Mass. 24 17 4 3 - - 2
Hartford, Conn. 74 49 8 10 2 5 2
Lowell, Mass. 26 20 3 3 - - 2
Lynn, Mass. 12 7 5 - - - 2
New Bedford, Mass. 14 12 - 2 - - 2
New Haven, Conn. 42 29 6 3 3 1 1
Providence, R.I. 65 47 14 2 2 - -
Somerville, Mass. 5 3 2 - - - -
Springfield, Mass. 46 34 7 2 1 2 3
Waterbury, Conn. 28 20 6 1 - 1 1
Worcester, Mass. 61 45 10 5 1 - 7
MID. ATLANTIC 2,215 1,505 430 164 58 58 93
Albany, N.Y. 51 36 11 1 1 2 2
Allentown, Pa. 29 24 3 - 2 - 2
Buffalo, N.Y. 99 75 16 6 1 1 9
Camden, N.J. 31 19 8 1 2 1 2
Elizabeth, N.J. 15 10 2 1 1 1 -
Erie, Pa. 30 23 2 2 1 2 1
Jersey City, N.J. U U U U U U U
New York City, N.Y. 1,185 800 235 94 27 29 42
Newark, N.J. 59 24 17 13 2 3 1
Paterson, N.J. 27 17 5 3 - 2 -
Philadelphia, Pa. 300 190 58 27 15 10 13
Pittsburgh, Pa.*** 45 28 12 1 1 3 2
Reading, Pa. 27 24 3 - - - 2
Rochester, N.Y. 122 83 25 10 2 2 8
Schenectady, N.Y. 23 19 3 - 1 - 1
Scranton, Pa. 28 25 3 - - - -
Syracuse, N.Y. 82 59 18 2 1 2 7
Trenton, N.J. 24 19 3 2 - - -
Utica, N.Y. 17 12 4 - 1 - -
Yonkers, N.Y. 21 18 2 1 - - 1
E.N. CENTRAL 2,041 1,363 408 160 61 48 111
Akron, Ohio 56 35 13 4 - 4 -
Canton, Ohio 30 26 2 2 - - 3
Chicago, Ill. 416 243 92 51 17 12 25
Cincinnati, Ohio 113 76 19 11 2 5 9
Cleveland, Ohio 131 86 31 4 4 6 1
Columbus, Ohio 207 145 40 15 4 3 24
Dayton, Ohio 129 93 29 5 1 1 12
Detroit, Mich. 184 96 47 31 6 4 5
Evansville, Ind. 36 27 7 1 1 - 1
Fort Wayne, Ind. 64 45 10 6 1 2 2
Gary, Ind. 14 8 4 2 - - -
Grand Rapids, Mich. 50 36 6 5 1 2 1
Indianapolis, Ind. 145 88 32 9 14 2 -
Lansing, Mich. 26 20 5 1 - - 2
Milwaukee, Wis. 117 90 22 2 2 1 10
Peoria, Ill. 38 28 7 1 1 1 3
Rockford, Ill. 61 44 11 4 2 - 4
South Bend, Ind. 56 45 8 1 - 2 1
Toledo, Ohio 104 79 20 1 4 - 6
Youngstown, Ohio 64 53 3 4 1 3 2
W.N. CENTRAL 883 608 152 57 21 27 40
Des Moines, Iowa 93 76 10 5 1 1 14
Duluth, Minn. 28 22 1 2 - 3 1
Kansas City, Kans. 51 27 19 2 1 2 2
Kansas City, Mo. 124 73 24 3 5 1 5
Lincoln, Nebr. 30 21 6 3 - - 2
Minneapolis, Minn. 186 137 30 10 4 5 11
Omaha, Nebr. 75 51 11 5 3 5 1
St. Louis, Mo. 116 79 19 10 2 6 -
St. Paul, Minn. 98 77 16 2 3 - 1
Wichita, Kans. 82 45 16 15 2 4 3
S. ATLANTIC 1,494 959 327 132 33 42 73
Atlanta, Ga. 424 267 109 34 6 8 4
Baltimore, Md. 173 94 47 21 7 4 12
Charlotte, N.C. 82 50 15 6 4 7 6
Jacksonville, Fla. 120 72 25 15 2 6 4
Miami, Fla. 103 55 29 12 3 3 -
Norfolk, Va. 49 32 11 1 1 4 5
Richmond, Va. 61 41 8 7 2 3 3
Savannah, Ga. 30 26 4 - - - 3
St. Petersburg, Fla. 73 55 11 4 2 1 8
Tampa, Fla. 165 127 24 12 - 2 19
Washington, D.C. 214 140 44 20 6 4 9
Wilmington, Del. U U U U U U U
E.S. CENTRAL 838 544 176 60 37 20 53
Birmingham, Ala. 190 115 42 16 10 6 15
Chattanooga, Tenn. 76 53 18 4 1 - 2
Knoxville, Tenn. 73 54 14 3 2 - 8
Lexington, Ky. 69 38 15 9 2 5 7
Memphis, Tenn. 160 99 39 13 7 2 12
Mobile, Ala. 51 35 10 4 1 1 -
Montgomery, Ala. 55 41 10 2 1 1 5
Nashville, Tenn. 164 109 28 9 13 5 4
W.S. CENTRAL 1,451 952 295 119 53 31 92
Austin, Tex. 76 49 13 8 4 2 3
Baton Rouge, La. 42 30 9 2 - 1 1
Corpus Christi, Tex. 60 41 10 7 2 - 4
Dallas, Tex. 176 105 39 16 10 6 5
El Paso, Tex. 114 77 26 6 1 3 2
Ft. Worth, Tex. 89 59 21 7 1 1 13
Houston, Tex. 350 231 68 29 14 8 26
Little Rock, Ark. 82 62 13 1 4 2 10
New Orleans, La. 119 67 26 17 6 3 -
San Antonio, Tex. 206 146 34 15 8 3 19
Shreveport, La. U U U U U U U
Tulsa, Okla. 137 85 36 11 3 2 9
MOUNTAIN 864 535 154 109 39 27 58
Albuquerque, N.M. 92 67 14 4 5 2 3
Boise, Idaho 34 26 4 4 - - 1
Colo. Springs, Colo. 43 28 6 5 2 2 3
Denver, Colo. 117 82 16 9 2 8 10
Las Vegas, Nev. 153 57 32 45 14 5 11
Ogden, Utah 28 25 2 1 - - -
Phoenix, Ariz. 175 106 35 21 8 5 13
Pueblo, Colo. 19 12 4 2 1 - 2
Salt Lake City, Utah 85 54 17 8 4 2 8
Tucson, Ariz. 118 78 24 10 3 3 7
PACIFIC 1,816 1,280 333 119 47 36 131
Berkeley, Calif. 19 16 1 - - 2 1
Fresno, Calif. 129 88 23 8 6 4 -
Glendale, Calif. 40 34 5 1 - - 5
Honolulu, Hawaii 62 44 16 2 - - 4
Long Beach, Calif. 73 46 22 4 - 1 11
Los Angeles, Calif. 653 450 135 33 20 15 46
Pasadena, Calif. U U U U U U U
Portland, Oreg. U U U U U U U
Sacramento, Calif. U U U U U U U
San Diego, Calif. 134 92 23 9 6 3 8
San Francisco, Calif. 117 79 21 15 - 2 13
San Jose, Calif. 216 164 31 13 3 5 14
Santa Cruz, Calif. 39 29 7 3 - - 4
Seattle, Wash. 148 99 25 20 3 1 7
Spokane, Wash. 76 57 8 5 4 2 5
Tacoma, Wash. 110 82 16 6 5 1 13
TOTAL 12,184**** 8,149 2,381 963 366 302 683
---------------------------------------------------------------------------------------------------------------
U: Unavailable -: no reported cases
* Mortality data in this table are voluntarily reported from 122 cities in the United States, most of which have populations
of 100,000 or more. A death is reported by the place of its occurrence and by the week that the death certificate was
filed. Fetal deaths are not included.
** Pneumonia and influenza.
*** Because of changes in reporting methods in this Pennsylvania city, these numbers are partial counts for the current
week. Complete counts will be available in 4 to 6 weeks.
**** Total includes unknown ages.
===================================================================================================================================
Return to top. Disclaimer All MMWR HTML versions of articles are electronic conversions from ASCII text into HTML. This conversion may have resulted in character translation or format errors in the HTML version. Users should not rely on this HTML document, but are referred to the electronic PDF version and/or the original MMWR paper copy for the official text, figures, and tables. An original paper copy of this issue can be obtained from the Superintendent of Documents, U.S. Government Printing Office (GPO), Washington, DC 20402-9371; telephone: (202) 512-1800. Contact GPO for current prices. **Questions or messages regarding errors in formatting should be addressed to mmwrq@cdc.gov.Page converted: 10/05/98 |
|||||||||
This page last reviewed 5/2/01
|