 |
|
|
|
|
|
|
| ||||||||||
|
|
|
|
|
|
|
||||
| ||||||||||
|
|
|
|
|
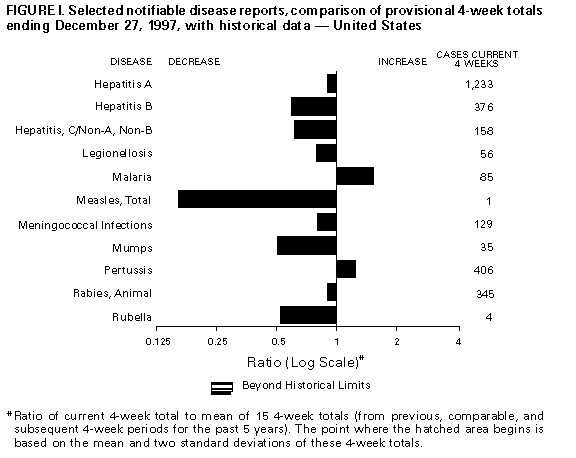
Persons using assistive technology might not be able to fully access information in this file. For assistance, please send e-mail to: mmwrq@cdc.gov. Type 508 Accommodation and the title of the report in the subject line of e-mail. Notifiable Diseases/Deaths in Selected Cities Weekly InformationFigure_I Selected notifiable disease reports, comparison of provisional 4-week totals ending December 27, 1997, with historical data -- United States Table_I Summary -- provisional cases of selected notifiable diseases, United States, cumulative, week ending December 27, 1997 (52nd Week) Table_II Provisional cases of selected notifiable diseases, United States, weeks ending December 27, 1997 and December 28, 1996 (52nd Week) Table_III Provisional cases of selected notifiable diseases preventable by vaccination, United States, weeks ending December 27, 1997 and December 28, 1996 (52nd Week) Table_IV Deaths in 122 U.S. cities, week ending
December 27, 1997 (52nd Week)
TABLE I. Summary -- provisional cases of specified notifiable diseases, United
States, cumulative, week ending December 27, 1997 (52nd Week)
==================================================================================
                                             Cum. 1997
------------------------------------------------------
Anthrax                                              0
Brucellosis                                         75
Cholera                                             10
Congenital rubella syndrome                          4
Cryptosporidiosis*                               1,950
Diphtheria                                           5
Encephalitis:  California*                         118
               eastern equine*                      10
               St. Louis*                           12
               western equine*                       -
Hansen Disease                                     109
Hantavirus pulmonary syndrome*+                     18
Hemolytic uremic syndrome, post-diarrheal*          60
HIV infection, pediatric*&                         214
Plague                                               4
Poliomyelitis, paralytic@                            1
Psittacosis                                         37
Rabies, human                                        2
Rocky Mountain spotted fever (RMSF)                396
Streptococcal disease, invasive Group A          1,404
Streptococcal toxic-shock syndrome*                 31
Syphilis, congenital**                             525
Tetanus                                             42
Toxic-shock syndrome                               133
Trichinosis                                          9
Typhoid fever                                      344
Yellow fever                                         -
------------------------------------------------------
-: no reported cases
 * Not notifiable in all states
 + Updated weekly from reports to the Division of Viral and Rickettsial
   Diseases, National Center for Infectious Diseases (NCID).
 & Updated monthly to the Division of HIV/AIDS Prevention, National Center
   for HIV, STD, and TB Prevention (NCHSTP), last update November 25, 1997.
 @ One suspected case of polio with onset in 1997 has also been reported
   to date.
** Updated quarterly from reports to the Division of STD Prevention,
   NCHSTP.

==================================================================================
Return to top. Table_II Note: To print large tables and graphs users may have to change their printer settings to landscape and use a small font size.
TABLE II. (page 1) Provisional cases of selected notifiable diseases, United States, weeks ending
December 27, 1997, and December 28, 1996 (52nd Week)
Escherichia
coli O157:H7
------------------- Hepatitis
AIDS* Chlamydia NETSS** PHLIS*** Gonorrhea C\NA,NB
----------------- -------------------- -------- -------- ------------------- ----------------
Cum. Cum. Cum. Cum. Cum. Cum. Cum. Cum. Cum. Cum.
Reporting Area 1997 1996 1997 1996 1997 1997 1997 1996 1997 1996
------------------------------------------------------------------------------------------------------------------------------
UNITED STATES 53,031 66,213 458,353 437,869 2,292 1,530 284,427 322,818 3,132 3,719
NEW ENGLAND 2,252 2,746 17,362 16,967 200 127 5,687 6,296 56 113
Maine 51 49 1,025 931 17 - 66 55 - -
N.H. 40 93 799 752 13 16 95 162 8 7
Vt. 32 19 421 398 8 3 51 47 2 26
Mass. 808 1,306 7,390 6,791 109 93 2,118 2,163 39 74
R.I. 142 171 1,822 1,832 10 - 392 486 7 6
Conn. 1,179 1,108 5,905 6,263 43 15 2,965 3,383 - -
MID. ATLANTIC 16,043 18,114 58,700 57,172 141 52 36,918 41,735 368 337
Upstate N.Y. 2,390 2,422 N N 97 - 6,147 7,606 287 272
N.Y. City 8,610 9,942 30,377 26,455 15 8 14,213 13,008 - 3
N.J. 3,044 3,584 9,524 12,261 29 25 7,176 8,721 - -
Pa. 1,999 2,166 18,799 18,456 N 19 9,382 12,400 81 62
E.N. CENTRAL 3,957 5,171 69,621 83,652 405 280 42,597 57,320 503 490
Ohio 798 1,153 20,254 20,653 108 52 12,710 14,946 20 35
Ind. 488 591 9,487 10,100 81 46 6,175 6,458 11 8
Ill. 1,715 2,192 10,838 22,459 70 31 5,272 15,776 83 93
Mich. 716 964 20,151 20,277 146 103 14,488 15,267 389 354
Wis. 240 271 8,891 10,163 N 48 3,952 4,873 - -
W.N. CENTRAL 1,055 1,600 32,731 31,705 518 402 14,834 15,822 163 111
Minn. 194 304 7,416 5,608 214 203 2,752 2,698 4 10
Iowa 100 92 4,647 4,165 119 74 1,245 1,144 35 53
Mo. 505 851 11,922 12,020 55 69 7,792 8,492 108 23
N. Dak. 12 12 749 1,022 15 12 52 42 3 -
S. Dak. 8 14 1,438 1,536 28 32 169 176 - -
Nebr. 90 93 2,560 2,878 61 - 1,087 1,213 3 9
Kans. 146 234 3,999 4,476 26 12 1,737 2,057 10 16
S. ATLANTIC 13,084 16,514 89,547 53,331 214 135 87,862 95,569 273 235
Del. 214 285 1,276 1,148 5 4 1,228 1,432 - 1
Md. 1,811 2,246 7,516 U 25 14 12,931 11,316 22 4
D.C. 955 1,257 N N 2 - 4,256 4,470 - -
Va. 1,113 1,146 11,340 11,754 N 41 8,668 9,292 24 17
W. Va. 121 121 2,882 2,301 N 1 928 850 17 9
N.C. 795 898 17,097 U 74 38 16,675 18,229 50 46
S.C. 754 842 12,359 U 13 8 11,235 10,984 38 34
Ga. 1,604 2,422 12,244 13,333 41 - 14,384 19,810 U -
Fla. 5,717 7,297 24,833 24,795 46 29 17,557 19,186 122 124
E.S. CENTRAL 1,908 2,280 31,504 32,507 95 39 31,709 35,982 334 590
Ky. 338 401 6,207 6,687 30 - 3,960 4,229 15 29
Tenn. 745 821 12,438 13,121 46 39 10,975 11,710 232 400
Ala. 512 608 8,587 8,352 15 - 11,917 13,334 13 8
Miss. 313 450 4,272 4,347 4 - 4,857 6,709 74 153
W.S. CENTRAL 5,663 6,793 59,878 59,215 71 26 39,190 40,942 489 515
Ark. 216 267 2,128 1,663 10 5 3,571 5,050 11 8
La. 997 1,464 10,030 7,330 7 12 9,777 7,976 241 292
Okla. 275 261 7,374 7,219 12 6 4,725 4,792 7 7
Tex. 4,175 4,801 40,346 43,003 42 3 21,117 23,124 230 208
MOUNTAIN 1,527 2,014 22,765 29,642 239 132 7,925 7,459 484 555
Mont. 41 34 1,084 1,232 24 - 47 35 23 20
Idaho 50 38 1,646 1,505 38 23 156 98 84 99
Wyo. 14 7 611 621 17 12 52 41 230 179
Colo. 352 519 1,896 7,282 83 57 2,138 1,367 40 64
N. Mex. 163 206 3,369 3,862 7 - 1,136 891 58 77
Ariz. 374 591 10,550 10,686 N 30 3,596 3,705 25 76
Utah 134 194 1,728 1,554 59 - 269 280 5 19
Nev. 399 425 1,881 2,900 11 10 531 1,042 19 21
PACIFIC 7,542 10,980 76,245 73,678 409 332 17,705 21,693 462 773
Wash. 617 762 9,408 9,236 130 131 1,917 2,020 31 66
Oreg. 286 461 5,009 5,347 84 95 735 871 4 8
Calif. 6,510 9,522 58,580 55,926 183 94 14,204 17,842 266 479
Alaska 40 36 1,549 1,345 12 3 371 459 - 3
Hawaii 89 199 1,699 1,824 N 9 478 501 161 217
Guam 2 4 193 355 N - 27 63 - 6
P.R. 1,975 2,238 U U 41 U 526 648 150 180
V.I. 95 18 N N N U - - - -
Amer. Samoa - - - - N U - - - -
C.N.M.I. 1 - N N N U 17 11 2 -
------------------------------------------------------------------------------------------------------------------------------
N: Not notifiable U: Unavailable -: no reported cases C.N.M.I.: Commonwealth of North Mariana Islands
* Updated monthly to the Division of HIV/AIDS Prevention, National Center for HIV, STD, and TB Prevention, last update November 25, 1997.
** National Electronic Telecommunications System for Surveillance.
*** Public Health Laboratory Information System.
=======================================================================================================================================================
TABLE II. (page 2) Provisional cases of selected notifiable diseases, United States, weeks ending
December 27, 1997, and December 28, 1996 (52nd Week)
Lyme Syphilis Rabies,
Legionellosis Disease Malaria (Primary & Secondary) Tuberculosis Animal
---------------- ---------------- ---------------- --------------------- ----------------- -------
Cum. Cum. Cum. Cum. Cum. Cum. Cum. Cum. Cum. Cum. Cum.
Reporting Area 1997 1996 1997 1996 1997 1996 1997 1996 1997 1996 1997
-------------------------------------------------------------------------------------------------------------------------------------------
UNITED STATES 1,033 1,198 10,622 16,455 1,756 1,800 7,787 11,344 16,905 21,168 7,674
NEW ENGLAND 82 80 2,877 4,095 96 84 128 195 441 485 1,230
Maine 2 5 11 63 1 10 2 2 11 21 221
N.H. 7 4 38 47 10 4 - 1 15 21 43
Vt. 13 5 8 26 2 8 - - 6 4 113
Mass. 27 34 370 321 30 32 68 85 254 262 278
R.I. 15 32 409 534 11 12 2 4 36 39 41
Conn. 18 N 2,041 3,104 42 18 56 103 119 138 534
MID. ATLANTIC 214 263 6,236 10,305 433 467 352 509 3,106 3,969 1,652
Upstate N.Y. 72 80 2,477 4,900 70 96 39 76 438 535 1,205
N.Y. City 12 19 119 401 252 269 83 133 1,591 2,035 U
N.J. 20 15 1,637 2,190 78 68 122 177 686 816 189
Pa. 110 149 2,003 2,814 33 34 108 123 391 583 258
E.N. CENTRAL 312 360 96 498 148 170 668 1,573 1,579 2,110 177
Ohio 121 116 61 32 19 15 211 584 244 301 116
Ind. 54 51 29 32 16 15 166 207 150 202 13
Ill. 28 38 6 10 55 83 71 420 752 1,060 20
Mich. 92 109 - 28 43 41 128 183 311 433 28
Wis. 17 46 U 396 15 16 92 179 122 114 -
W.N. CENTRAL 70 71 233 365 68 51 181 340 576 547 490
Minn. 3 15 196 251 36 26 23 47 152 131 61
Iowa 12 11 10 19 10 3 8 23 73 70 157
Mo. 31 18 20 52 11 11 113 224 239 224 25
N. Dak. 2 - - 2 3 1 - - 12 8 84
S. Dak. 2 3 1 - 3 - 1 - 19 19 74
Nebr. 15 18 2 5 1 3 7 10 22 22 2
Kans. 5 6 4 36 4 7 29 36 59 73 87
S. ATLANTIC 131 197 768 823 361 340 3,155 3,780 3,180 4,014 3,022
Del. 13 12 105 173 5 4 20 35 18 43 54
Md. 28 39 490 447 86 87 891 733 308 319 596
D.C. 5 9 10 3 20 9 112 123 103 139 5
Va. 27 54 62 57 68 60 232 393 305 349 667
W. Va. N N 10 12 1 6 3 9 54 57 88
N.C. 14 12 34 66 20 30 721 1,052 430 554 852
S.C. 8 8 3 9 18 13 360 384 260 350 175
Ga. 2 3 7 1 52 38 521 683 595 790 311
Fla. 33 60 47 55 91 93 295 368 1,107 1,413 274
E.S. CENTRAL 53 59 83 83 35 42 1,610 2,412 1,190 1,436 270
Ky. 12 11 14 26 8 12 136 154 184 259 28
Tenn. 33 26 44 24 11 14 747 850 358 504 149
Ala. 4 5 11 9 10 8 410 530 412 423 88
Miss. 4 17 14 24 6 8 317 878 236 250 5
W.S. CENTRAL 33 53 100 175 57 158 1,195 1,815 2,396 2,898 340
Ark. - 1 25 27 5 2 140 262 179 225 54
La. 7 4 6 9 16 12 366 486 270 350 5
Okla. 3 16 34 42 8 3 117 177 173 200 112
Tex. 23 32 35 97 28 141 572 890 1,774 2,123 169
MOUNTAIN 63 58 23 9 66 65 179 165 510 711 188
Mont. 1 1 - - 2 7 - - 17 19 50
Idaho 2 - 4 2 1 - 1 4 16 15 -
Wyo. 1 7 5 3 2 7 - 2 2 7 31
Colo. 18 12 6 - 30 26 14 26 75 104 28
N. Mex. 3 2 1 1 8 3 16 8 53 89 12
Ariz. 12 21 4 - 11 9 134 102 269 282 53
Utah 19 8 1 1 3 5 5 3 32 58 6
Nev. 7 7 2 2 9 8 9 20 46 137 8
PACIFIC 75 57 206 102 492 423 319 555 3,927 4,998 305
Wash. 10 8 10 18 49 41 16 9 264 285 -
Oreg. - - 21 19 24 24 9 9 154 190 14
Calif. 64 43 173 64 405 343 292 533 3,291 4,227 262
Alaska - 1 2 - 5 3 1 - 73 96 29
Hawaii 1 5 - 1 9 12 1 4 145 200 -
Guam - 1 - - - - 3 3 13 107 -
P.R. - - - - 6 2 238 209 212 222 66
V.I. - 1 - - - 1 - - - - -
Amer. Samoa - - - - - - - - - - -
C.N.M.I. - - - - - - 9 1 2 - -
-------------------------------------------------------------------------------------------------------------------------------------------
N: Not notifiable U: Unavailable -: no reported cases
=======================================================================================================================================================
Return to top. Table_III Note: To print large tables and graphs users may have to change their printer settings to landscape and use a small font size.
TABLE III. (page 1) Provisional cases of selected notifiable diseases preventable by vaccination, United
States, weeks ending December 27, 1997, and December 28, 1996 (52nd Week)
Hepatitis (Viral), by type Measles (Rubeola)
H. influenzae, --------------------------------------- ------------------------------------------------------------
invasive A B Indigenous Imported** Total
---------------- ----------------- ----------------- --------------- --------------- ---------------
Cum. Cum. Cum. Cum. Cum. Cum. Cum. Cum. Cum. Cum.
Reporting Area 1997* 1996 1997 1996 1997 1996 1997 1997 1997 1997 1997 1996
-----------------------------------------------------------------------------------------------------------------------------------------------------
UNITED STATES 1,041 1,170 27,595 31,032 8,656 10,637 - 78 - 55 133 508
NEW ENGLAND 63 55 625 456 147 255 - 11 - 8 19 17
Maine 5 1 62 28 6 8 - - - 1 1 -
N.H. 12 13 34 22 17 21 - 1 - - 1 -
Vt. 3 2 15 12 7 14 - - - - - 2
Mass. 38 36 241 229 56 111 - 10 - 6 16 12
R.I. 3 2 129 26 16 19 - - - - - 1
Conn. 2 1 144 139 45 82 - - - 1 1 2
MID. ATLANTIC 145 213 1,843 1,985 1,275 1,413 - 19 - 8 27 38
Upstate N.Y. 41 50 367 438 322 358 - 2 - 3 5 12
N.Y. City 35 57 694 609 428 491 - 9 - 2 11 11
N.J. 49 65 246 394 201 279 - 3 - - 3 3
Pa. 20 41 536 544 324 285 - 5 - 3 8 12
E.N. CENTRAL 160 191 2,843 2,619 912 1,103 - 6 - 3 9 21
Ohio 86 95 328 785 93 120 - - - - - 6
Ind. 19 21 322 367 93 143 - - - - - -
Ill. 38 50 702 763 227 335 - 6 - 1 7 3
Mich. 15 12 1,336 506 454 416 - - - 2 2 3
Wis. 2 13 155 198 45 89 - - - - - 9
W.N. CENTRAL 65 63 2,182 2,656 469 572 - 13 - 5 18 24
Minn. 44 48 196 176 44 94 - 3 - 5 8 19
Iowa 7 4 484 334 47 74 - 1 - - 1 1
Mo. 10 8 1,100 1,414 323 326 - 1 - - 1 3
N. Dak. - - 11 140 5 2 U - U - - -
S. Dak. 2 1 24 43 1 5 - 8 - - 8 -
Nebr. 1 1 114 156 16 39 - - - - - -
Kans. 1 1 253 393 33 32 - - - - - 1
S. ATLANTIC 172 273 2,135 1,960 1,284 1,573 - 2 - 13 15 12
Del. - 2 31 21 6 9 - - - - - 1
Md. 58 76 210 256 186 169 - - - 2 2 2
D.C. - 5 36 39 30 32 - - - 1 1 -
Va. 13 11 229 218 127 163 - - - 1 1 3
W. Va. 4 11 12 19 16 36 - - - - - -
N.C. 21 26 209 204 265 337 - - - 2 2 2
S.C. 4 5 108 57 97 101 - - - 1 1 -
Ga. 42 52 656 414 148 61 U - U 1 1 3
Fla. 30 85 644 732 409 665 - 2 - 5 7 1
E.S. CENTRAL 48 45 631 1,273 688 914 - - - - - 2
Ky. 6 6 75 53 40 76 - - - - - -
Tenn. 27 25 400 778 446 516 - - - - - 2
Ala. 15 13 87 217 79 78 - - - - - -
Miss. - 1 69 225 123 244 - - - - - -
W.S. CENTRAL 51 44 5,501 6,807 1,185 1,616 - 3 - 5 8 27
Ark. 1 - 216 500 62 93 - - - - - -
La. 13 6 238 261 170 209 - - - - - 1
Okla. 32 32 1,416 2,586 51 56 - - - 1 1 -
Tex. 5 6 3,631 3,460 902 1,258 - 3 - 4 7 26
MOUNTAIN 94 57 4,333 4,573 887 1,164 - 6 - 2 8 157
Mont. - 1 71 130 12 21 - - - - - -
Idaho 1 1 144 247 54 88 - - - - - 1
Wyo. 4 - 41 41 40 45 U - U - - 1
Colo. 19 16 406 512 153 132 - - - - - 7
N. Mex. 10 11 354 355 258 417 - - - - - 17
Ariz. 33 20 2,353 1,767 201 237 - 5 - - 5 8
Utah 3 8 547 1,073 92 129 - - - 1 1 118
Nev. 24 - 417 448 77 95 - 1 - 1 2 5
PACIFIC 243 229 7,502 8,703 1,809 2,027 - 18 - 11 29 210
Wash. 6 10 673 1,001 80 158 - 1 - 1 2 38
Oreg. 35 33 378 875 108 129 - - - - - 14
Calif. 188 178 6,283 6,653 1,589 1,710 - 15 - 8 23 46
Alaska 7 6 34 54 21 16 - - - - - 63
Hawaii 7 2 134 120 11 14 - 2 - 2 4 49
Guam - - - 7 3 1 U - U - - -
P.R. - 2 257 292 1,376 1,195 - - - - - 3
V.I. - - - 41 - 44 U - U - - -
Amer. Samoa - - - - - - U - U - - -
C.N.M.I. 6 10 1 1 34 5 U 1 U - 1 -
-----------------------------------------------------------------------------------------------------------------------------------------------------
N: Not notifiable U: Unavailable -: no reported cases
* Of 241 cases among children aged <5 years, serotype was reported for 126 and of those, 48 were type b.
** For imported measles, cases include only those resulting from importation from other countries.
=======================================================================================================================================================
TABLE III. (page 2) Provisional cases of selected notifiable diseases preventable by vaccination, United
States, weeks ending December 27, 1997, and December 28, 1996 (52nd Week)
Meningococcal
Disease Mumps Pertussis Rubella
----------------- -------------------------- --------------------------- ---------------------------
Cum. Cum. Cum. Cum. Cum. Cum. Cum. Cum.
Reporting Area 1997 1996 1997 1997 1996 1997 1997 1996 1997 1997 1996
------------------------------------------------------------------------------------------------------------------------------------------
UNITED STATES 3,078 3,437 5 606 751 55 5,461 7,796 3 160 238
NEW ENGLAND 198 171 - 12 5 6 974 1,866 1 2 27
Maine 18 15 - - - - 11 55 - - -
N.H. 18 13 - 1 1 3 133 197 - - -
Vt. 4 4 - - 1 2 256 280 - - 2
Mass. 98 71 - 4 1 1 522 1,245 - 1 21
R.I. 20 18 - 6 1 - 17 40 - - -
Conn. 40 50 - 1 1 - 35 49 1 1 4
MID. ATLANTIC 318 381 - 57 96 1 384 952 - 31 13
Upstate N.Y. 73 102 - 12 28 1 152 533 - 4 5
N.Y. City 45 56 - 3 20 - 62 61 - 27 5
N.J. 72 79 - 7 4 - 11 31 - - 2
Pa. 128 144 - 35 44 - 159 327 - - 1
E.N. CENTRAL 456 475 - 80 135 14 517 837 - 5 3
Ohio 163 159 - 35 52 5 164 289 - - -
Ind. 58 64 - 14 8 9 85 128 - - -
Ill. 148 142 - 13 24 - 124 192 - 2 1
Mich. 53 51 - 15 48 - 61 59 - - 2
Wis. 34 59 - 3 3 - 83 169 - 3 -
W.N. CENTRAL 229 264 - 18 24 16 579 573 1 2 -
Minn. 34 39 - 6 7 15 369 433 - - -
Iowa 48 56 - 10 3 - 108 32 - - -
Mo. 104 98 - - 10 1 68 74 1 2 -
N. Dak. 2 5 U - 2 U 2 1 U - -
S. Dak. 5 10 - - - - 5 4 - - -
Nebr. 14 29 - 2 - - 14 15 - - -
Kans. 22 27 - - 2 - 13 14 - - -
S. ATLANTIC 555 659 2 85 131 6 436 793 1 83 101
Del. 5 3 - - - - 1 26 - - -
Md. 42 58 - 10 37 4 124 278 - - -
D.C. 9 5 - - - - 3 4 - 1 1
Va. 58 67 - 19 19 - 56 108 - 1 2
W. Va. 18 18 - - - - 6 7 - - -
N.C. 97 79 - 12 27 - 118 186 - 59 86
S.C. 59 65 - 11 7 - 30 49 - 19 1
Ga. 105 147 U 10 9 U 13 35 U - -
Fla. 162 217 2 23 32 2 85 100 1 3 11
E.S. CENTRAL 236 246 - 27 23 - 141 202 - - 2
Ky. 48 31 - 3 - - 61 142 - - -
Tenn. 85 65 - 6 1 - 39 24 - - -
Ala. 84 95 - 9 6 - 33 26 - - 2
Miss. 19 55 - 9 16 - 8 10 - - N
W.S. CENTRAL 278 365 - 75 67 - 295 201 - 4 9
Ark. 32 35 - 1 1 - 60 14 - - -
La. 47 66 - 16 21 - 20 15 - - 1
Okla. 44 46 - - 1 - 48 21 - - -
Tex. 155 218 - 58 44 - 167 151 - 4 8
MOUNTAIN 185 183 1 57 25 7 1,288 660 - 6 9
Mont. 9 9 - - - - 19 37 - - -
Idaho 13 25 1 5 - 2 621 115 - 1 2
Wyo. 4 4 U 1 1 U 7 8 U - -
Colo. 49 44 - 3 5 1 342 336 - - 3
N. Mex. 29 27 N N N 3 193 64 - - -
Ariz. 46 37 - 33 1 - 41 33 - 5 3
Utah 16 18 - 8 3 - 26 26 - - -
Nev. 19 19 - 7 15 1 39 41 - - 1
PACIFIC 623 693 2 195 245 5 847 1,712 - 27 74
Wash. 92 116 - 21 26 5 406 830 - 5 15
Oreg. 126 123 N N N - 10 64 - - 1
Calif. 395 437 2 147 185 - 403 780 - 14 55
Alaska 3 9 - 4 3 - 14 3 - - -
Hawaii 7 8 - 23 31 - 14 35 - 8 3
Guam 1 5 U 1 10 U - - U - -
P.R. 10 13 - 7 2 - 2 3 - - -
V.I. - - U - 2 U - - U - -
Amer. Samoa - - U - - U - - U - -
C.N.M.I. - - U 4 - U - - U - -
------------------------------------------------------------------------------------------------------------------------------------------
N: Not notifiable U: Unavailable -: no reported cases
=======================================================================================================================================================
Return to top. Table_IV Note: To print large tables and graphs users may have to change their printer settings to landscape and use a small font size.
TABLE IV. Deaths in 122 U.S. cities,* week ending
December 27, 1997 (52nd Week)
===================================================================================================================================
All Causes, By Age (Years)
------------------------------------------------------------------------ P&I**
Reporting Area All Ages >=65 45-64 25-44 1-24 <1 Total
---------------------------------------------------------------------------------------------------------------
NEW ENGLAND 532 407 76 23 15 11 47
Boston, Mass. 177 129 31 8 7 2 21
Bridgeport, Conn. 32 22 4 5 1 - 2
Cambridge, Mass. 12 12 - - - - 1
Fall River, Mass. 29 23 5 - 1 - -
Hartford, Conn. 46 34 10 - 1 1 3
Lowell, Mass. 21 18 3 - - - 1
Lynn, Mass. 8 5 2 - 1 - 3
New Bedford, Mass. 17 14 3 - - - -
New Haven, Conn. 54 41 4 3 2 4 4
Providence, R.I. U U U U U U U
Somerville, Mass. 3 3 - - - - -
Springfield, Mass. 44 37 6 - - 1 1
Waterbury, Conn. 24 18 - 4 1 1 2
Worcester, Mass. 65 51 8 3 1 2 9
MID. ATLANTIC 2,284 1,587 396 202 69 30 136
Albany, N.Y. 45 35 5 1 3 1 4
Allentown, Pa. 27 20 7 - - - 1
Buffalo, N.Y. 74 58 12 3 - 1 7
Camden, N.J. 28 22 4 1 1 - 1
Elizabeth, N.J. 19 16 2 1 - - -
Erie, Pa. 47 39 4 2 2 - 2
Jersey City, N.J. 38 25 7 4 2 - 1
New York City, N.Y. 1,323 926 236 114 30 17 64
Newark, N.J. 59 27 17 8 3 4 3
Paterson, N.J. 13 10 1 2 - - -
Philadelphia, Pa. 200 91 47 40 21 1 10
Pittsburgh, Pa.*** 35 23 5 3 1 3 5
Reading, Pa. 43 33 5 3 1 1 2
Rochester, N.Y. 113 84 22 5 2 - 11
Schenectady, N.Y. 18 16 1 1 - - 2
Scranton, Pa. 25 22 3 - - - 3
Syracuse, N.Y. 130 103 15 8 2 2 13
Trenton, N.J. 29 21 2 5 1 - 5
Utica, N.Y. 18 16 1 1 - - 2
Yonkers, N.Y. U U U U U U U
E.N. CENTRAL 1,583 1,084 308 108 45 38 101
Akron, Ohio 38 29 4 2 2 1 -
Canton, Ohio 31 25 4 1 - 1 4
Chicago, Ill. 420 263 93 36 18 10 32
Cincinnati, Ohio 88 64 14 6 3 1 9
Cleveland, Ohio 111 71 27 8 - 5 5
Columbus, Ohio 182 127 35 13 5 2 20
Dayton, Ohio 94 71 19 3 1 - 5
Detroit, Mich. 135 85 33 9 5 3 8
Evansville, Ind. U U U U U U U
Fort Wayne, Ind. U U U U U U U
Gary, Ind. 4 1 1 2 - - -
Grand Rapids, Mich. 59 51 4 2 2 - 4
Indianapolis, Ind. 132 97 21 7 4 3 -
Lansing, Mich. 17 8 9 - - - 2
Milwaukee, Wis. 80 56 9 7 2 6 3
Peoria, Ill. 39 25 10 2 1 1 3
Rockford, Ill. 45 36 8 1 - - 2
South Bend, Ind. 46 32 7 3 1 3 2
Toledo, Ohio 62 43 10 6 1 2 2
Youngstown, Ohio U U U U U U U
W.N. CENTRAL 568 402 85 37 12 14 36
Des Moines, Iowa U U U U U U U
Duluth, Minn. 27 19 6 2 - - 2
Kansas City, Kans. 8 6 - 2 - - -
Kansas City, Mo. 110 56 18 10 6 2 5
Lincoln, Nebr. 31 25 6 - - - 5
Minneapolis, Minn. 94 73 9 7 3 2 13
Omaha, Nebr. 85 63 18 3 - 1 3
St. Louis, Mo. 89 65 14 4 - 6 -
St. Paul, Minn. 79 61 10 7 - 1 4
Wichita, Kans. 45 34 4 2 3 2 4
S. ATLANTIC 817 554 161 61 21 19 52
Atlanta, Ga. U U U U U U U
Baltimore, Md. 159 100 32 13 3 11 11
Charlotte, N.C. 77 55 14 2 3 3 5
Jacksonville, Fla. 104 73 20 9 1 1 4
Miami, Fla. U U U U U U U
Norfolk, Va. U U U U U U U
Richmond, Va. 52 33 12 4 3 - 1
Savannah, Ga. 28 22 4 2 - - 3
St. Petersburg, Fla. 74 57 14 1 1 1 8
Tampa, Fla. 157 113 29 9 6 - 18
Washington, D.C. 149 92 36 14 4 3 2
Wilmington, Del. 17 9 - 7 - - -
E.S. CENTRAL 568 372 127 37 19 13 32
Birmingham, Ala. U U U U U U U
Chattanooga, Tenn. 69 47 13 7 1 1 5
Knoxville, Tenn. 91 66 21 3 - 1 2
Lexington, Ky. 37 20 8 5 1 3 3
Memphis, Tenn. 178 115 40 11 9 3 10
Mobile, Ala. 80 52 21 1 4 2 -
Montgomery, Ala. 49 35 8 1 4 1 8
Nashville, Tenn. 64 37 16 9 - 2 4
W.S. CENTRAL 1,075 688 230 98 30 25 69
Austin, Tex. 51 33 12 5 1 - 9
Baton Rouge, La. 50 29 11 4 3 3 3
Corpus Christi, Tex. 37 30 3 1 1 2 4
Dallas, Tex. 148 95 25 21 3 4 2
El Paso, Tex. 68 51 12 4 1 - 4
Ft. Worth, Tex. 56 40 14 1 1 - -
Houston, Tex. 230 134 66 21 4 5 23
Little Rock, Ark. 42 32 8 2 - - 3
New Orleans, La. 198 113 41 22 10 9 -
San Antonio, Tex. 126 84 26 10 4 1 15
Shreveport, La. U U U U U U U
Tulsa, Okla. 69 47 12 7 2 1 6
MOUNTAIN 953 651 170 78 27 27 80
Albuquerque, N.M. 82 66 8 6 - 2 6
Boise, Idaho 38 28 5 4 1 - 4
Colo. Springs, Colo. 58 39 8 6 3 2 5
Denver, Colo. 141 87 26 13 8 7 11
Las Vegas, Nev. 180 108 54 13 3 2 9
Ogden, Utah 33 26 4 3 - - 2
Phoenix, Ariz. 159 108 27 13 5 6 15
Pueblo, Colo. 18 14 1 2 - 1 -
Salt Lake City, Utah 116 81 17 10 4 4 20
Tucson, Ariz. 128 94 20 8 3 3 8
PACIFIC 1,207 876 180 93 30 28 113
Berkeley, Calif. 19 15 2 2 - - -
Fresno, Calif. 104 74 18 3 5 4 9
Glendale, Calif. U U U U U U U
Honolulu, Hawaii 75 57 11 4 - 3 2
Long Beach, Calif. 69 52 13 4 - - 13
Los Angeles, Calif. U U U U U U U
Pasadena, Calif. 26 23 2 - 1 - 4
Portland, Oreg. U U U U U U U
Sacramento, Calif. 202 147 32 15 6 2 21
San Diego, Calif. 107 77 14 11 2 3 9
San Francisco, Calif. 139 98 27 13 1 - 18
San Jose, Calif. 197 150 23 17 2 5 22
Santa Cruz, Calif. 41 30 5 3 2 1 4
Seattle, Wash. 112 64 23 14 8 3 1
Spokane, Wash. 29 23 2 2 - 2 2
Tacoma, Wash. 87 66 8 5 3 5 8
TOTAL 9,587**** 6,621 1,733 737 268 205 666
---------------------------------------------------------------------------------------------------------------
U: Unavailable -: no reported cases
* Mortality data in this table are voluntarily reported from 122 cities in the United States, most of which have populations
of 100,000 or more. A death is reported by the place of its occurrence and by the week that the death certificate was
filed. Fetal deaths are not included.
** Pneumonia and influenza.
*** Because of changes in reporting methods in these 3 Pennsylvania cities, these numbers are partial counts for the current
week. Complete counts will be available in 4 to 6 weeks.
**** Total includes unknown ages.
===================================================================================================================================
Return to top. Disclaimer All MMWR HTML versions of articles are electronic conversions from ASCII text into HTML. This conversion may have resulted in character translation or format errors in the HTML version. Users should not rely on this HTML document, but are referred to the electronic PDF version and/or the original MMWR paper copy for the official text, figures, and tables. An original paper copy of this issue can be obtained from the Superintendent of Documents, U.S. Government Printing Office (GPO), Washington, DC 20402-9371; telephone: (202) 512-1800. Contact GPO for current prices. **Questions or messages regarding errors in formatting should be addressed to mmwrq@cdc.gov.Page converted: 09/19/98 |
|||||||||
This page last reviewed 5/2/01
|