 |
|
|
|
|
|
|
| ||||||||||
|
|
|
|
|
|
|
||||
| ||||||||||
|
|
|
|
|
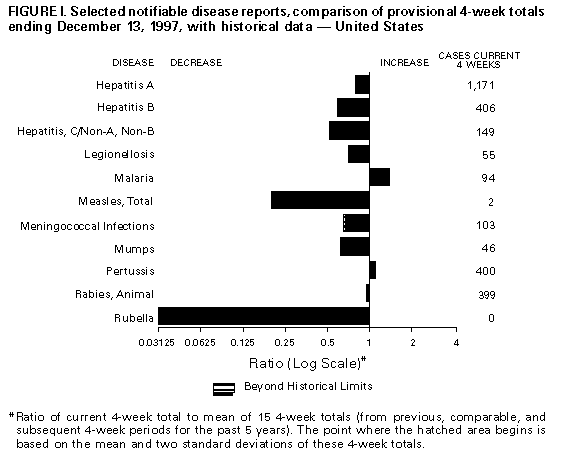
Persons using assistive technology might not be able to fully access information in this file. For assistance, please send e-mail to: mmwrq@cdc.gov. Type 508 Accommodation and the title of the report in the subject line of e-mail. Notifiable Diseases/Deaths in Selected Cities Weekly InformationFigure_I Selected notifiable disease reports, comparison of provisional 4-week totals ending December 13, 1997, with historical data -- United States Table_I Summary -- provisional cases of selected notifiable diseases, United States, cumulative, week ending December 13, 1997 (50th Week) Table_II Provisional cases of selected notifiable diseases, United States, weeks ending December 13, 1997 and December 14, 1996 (50th Week) Table_III Provisional cases of selected notifiable diseases preventable by vaccination, United States, weeks ending December 13, 1997 and December 14, 1996 (50th Week) Table_IV Deaths in 122 U.S. cities, week ending
December 13, 1997 (50th Week)
TABLE I. Summary -- provisional cases of specified notifiable diseases, United
States, cumulative, week ending December 13, 1997 (50th Week)
==================================================================================
                                             Cum. 1997
------------------------------------------------------
Anthrax                                              -
Brucellosis                                         73
Cholera                                             10
Congenital rubella syndrome                          4
Cryptosporidiosis*                               1,875
Diphtheria                                           5
Encephalitis:  California*                         118
               eastern equine*                      10
               St. Louis*                           12
               western equine*                       -
Hansen Disease                                     104
Hantavirus pulmonary syndrome*+                     17
Hemolytic uremic syndrome, post-diarrheal*          60
HIV infection, pediatric*&                         214
Plague                                               4
Poliomyelitis, paralytic@                            1
Psittacosis                                         37
Rabies, human                                        2
Rocky Mountain spotted fever (RMSF)                393
Streptococcal disease, invasive Group A          1,326
Streptococcal toxic-shock syndrome*                 30
Syphilis, congenital**                             525
Tetanus                                             41
Toxic-shock syndrome                               125
Trichinosis                                          9
Typhoid fever                                      338
Yellow fever                                         -
------------------------------------------------------
-: no reported cases
 * Not notifiable in all states
 + Updated weekly from reports to the Division of Viral and Rickettsial
   Diseases, National Center for Infectious Diseases (NCID).
 & Updated monthly to the Division of HIV/AIDS Prevention, National Center
   for HIV, STD, and TB Prevention (NCHSTP), last update November 25, 1997.
 @ One suspected case of polio with onset in 1997 has also been reported
   to date.
** Updated quarterly from reports to the Division of STD Prevention,
   NCHSTP.

==================================================================================
Return to top. Table_II Note: To print large tables and graphs users may have to change their printer settings to landscape and use a small font size.
TABLE II. (page 1) Provisional cases of selected notifiable diseases, United States, weeks ending
December 13, 1997, and December 14, 1996 (50th Week)
Escherichia
coli O157:H7
------------------- Hepatitis
AIDS* Chlamydia NETSS** PHLIS*** Gonorrhea C\NA,NB
----------------- -------------------- -------- -------- ------------------- ----------------
Cum. Cum. Cum. Cum. Cum. Cum. Cum. Cum. Cum. Cum.
Reporting Area 1997 1996 1997 1996 1997 1997 1997 1996 1997 1996
------------------------------------------------------------------------------------------------------------------------------
UNITED STATES 53,031 63,230 441,118 412,224 2,233 1,503 274,518 305,811 3,002 3,355
NEW ENGLAND 2,252 2,666 16,816 16,466 194 121 5,548 6,089 54 98
Maine 51 42 997 888 17 - 65 54 - -
N.H. 40 85 764 722 13 14 94 156 8 7
Vt. 32 19 406 377 8 3 46 45 2 26
Mass. 808 1,305 7,103 6,631 104 89 2,054 2,090 37 59
R.I. 142 166 1,744 1,759 10 - 380 474 7 6
Conn. 1,179 1,049 5,802 6,089 42 15 2,909 3,270 - -
MID. ATLANTIC 16,043 17,523 58,316 55,692 138 51 36,348 40,547 346 289
Upstate N.Y. 2,390 2,408 N N 96 - 5,948 7,119 265 232
N.Y. City 8,610 9,499 30,377 26,127 13 8 14,213 12,790 - 3
N.J. 3,044 3,453 9,140 11,941 29 24 6,805 8,531 - -
Pa. 1,999 2,163 18,799 17,624 N 19 9,382 12,107 81 54
E.N. CENTRAL 3,957 4,886 66,524 80,875 399 269 40,926 55,759 493 463
Ohio 798 1,118 19,072 19,950 106 52 11,965 14,525 20 33
Ind. 488 544 8,759 9,578 80 40 5,722 6,255 11 8
Ill. 1,715 2,086 10,405 22,061 68 31 5,077 15,587 81 90
Mich. 716 875 19,616 19,360 145 102 14,284 14,646 381 332
Wis. 240 263 8,672 9,926 N 44 3,878 4,746 - -
W.N. CENTRAL 1,055 1,491 30,951 30,259 513 400 13,921 14,831 151 97
Minn. 194 270 7,090 5,096 212 201 2,622 2,205 4 4
Iowa 100 92 4,341 4,054 118 74 1,129 1,104 33 48
Mo. 505 793 11,471 11,749 54 69 7,394 8,269 98 22
N. Dak. 12 12 623 942 15 12 44 36 3 -
S. Dak. 8 12 1,388 1,412 28 32 162 167 - -
Nebr. 90 93 2,201 2,670 60 - 899 1,047 3 8
Kans. 146 219 3,837 4,336 26 12 1,671 2,003 10 15
S. ATLANTIC 13,084 15,945 85,936 47,966 209 134 85,104 88,995 259 195
Del. 214 264 1,276 1,148 5 4 1,195 1,401 - 1
Md. 1,811 2,232 7,215 U 25 13 12,536 10,740 20 4
D.C. 955 1,195 N N 2 - 4,178 4,305 - -
Va. 1,113 1,097 10,969 11,286 N 41 8,362 8,878 24 16
W. Va. 121 112 2,791 2,217 N 1 908 805 16 9
N.C. 795 834 16,750 U 71 38 16,419 17,717 49 46
S.C. 754 842 11,983 U 12 8 10,969 10,936 37 33
Ga. 1,604 2,305 12,075 11,595 41 - 14,010 17,468 U -
Fla. 5,717 7,064 22,877 21,720 45 29 16,527 16,745 113 86
E.S. CENTRAL 1,908 2,130 30,676 31,411 94 39 30,853 34,865 322 565
Ky. 338 363 6,042 6,466 30 - 3,854 4,083 13 29
Tenn. 745 781 12,079 12,730 46 39 10,617 11,393 226 389
Ala. 512 570 8,283 8,031 14 - 11,525 12,913 11 8
Miss. 313 416 4,272 4,184 4 - 4,857 6,476 72 139
W.S. CENTRAL 5,663 6,353 55,763 55,167 69 17 36,810 36,914 466 383
Ark. 216 267 2,117 1,643 9 5 3,519 3,763 11 8
La. 997 1,421 9,738 7,089 7 3 9,562 7,713 219 227
Okla. 275 245 7,110 7,080 11 6 4,575 4,675 7 1
Tex. 4,175 4,420 36,798 39,355 42 3 19,154 20,763 229 147
MOUNTAIN 1,527 1,830 22,394 25,323 237 138 7,847 7,226 468 536
Mont. 41 34 1,044 1,193 24 - 47 34 21 18
Idaho 50 37 1,592 1,480 36 23 153 94 81 97
Wyo. 14 7 605 596 17 12 51 40 226 173
Colo. 352 462 1,896 3,680 83 57 2,103 1,335 38 63
N. Mex. 163 154 3,159 3,776 7 6 1,102 868 56 72
Ariz. 374 535 10,550 10,339 N 30 3,596 3,581 25 73
Utah 134 176 1,667 1,491 59 - 264 272 5 19
Nev. 399 425 1,881 2,768 11 10 531 1,002 16 21
PACIFIC 7,542 10,405 73,742 69,065 380 330 17,161 20,585 443 729
Wash. 617 638 8,993 9,004 118 131 1,846 1,964 27 50
Oreg. 286 438 4,827 5,144 80 93 707 830 3 8
Calif. 6,510 9,128 56,802 51,927 170 94 13,777 16,904 260 462
Alaska 40 30 1,457 1,260 12 3 361 431 - 3
Hawaii 89 171 1,663 1,730 N 9 470 456 153 206
Guam 2 4 193 353 N - 27 61 - 6
P.R. 1,975 2,166 U U 41 U 524 619 144 148
V.I. 95 18 N N N U - - - -
Amer. Samoa - - - - N U - - - -
C.N.M.I. 1 - N N N U 17 11 2 -
------------------------------------------------------------------------------------------------------------------------------
N: Not notifiable U: Unavailable -: no reported cases C.N.M.I.: Commonwealth of North Mariana Islands
* Updated monthly to the Division of HIV/AIDS Prevention, National Center for HIV, STD, and TB Prevention, last update November 25, 1997.
** National Electronic Telecommunications System for Surveillance.
*** Public Health Laboratory Information System.
=======================================================================================================================================================
TABLE II. (page 2) Provisional cases of selected notifiable diseases, United States, weeks ending
December 13, 1997, and December 14, 1996 (50th Week)
Lyme Syphilis Rabies,
Legionellosis Disease Malaria (Primary & Secondary) Tuberculosis Animal
---------------- ---------------- ---------------- --------------------- ----------------- -------
Cum. Cum. Cum. Cum. Cum. Cum. Cum. Cum. Cum. Cum. Cum.
Reporting Area 1997 1996 1997 1996 1997 1996 1997 1996 1997 1996 1997
-------------------------------------------------------------------------------------------------------------------------------------------
UNITED STATES 983 1,063 10,225 14,730 1,705 1,575 7,519 10,970 16,407 18,654 7,500
NEW ENGLAND 79 77 2,829 3,990 96 75 124 183 427 408 1,196
Maine 2 5 8 54 1 10 2 1 11 20 218
N.H. 7 4 38 46 10 3 - 1 15 15 43
Vt. 13 5 8 24 2 8 - - 5 1 113
Mass. 27 32 358 265 30 26 64 80 250 210 271
R.I. 13 31 400 518 11 10 2 4 33 30 38
Conn. 17 N 2,017 3,083 42 18 56 97 113 132 513
MID. ATLANTIC 213 233 6,019 9,129 430 444 348 495 2,997 3,464 1,595
Upstate N.Y. 71 75 2,389 4,247 70 83 38 71 424 423 1,154
N.Y. City 12 19 117 398 249 262 83 133 1,541 1,772 U
N.J. 20 14 1,510 2,004 78 67 119 172 641 725 183
Pa. 110 125 2,003 2,480 33 32 108 119 391 544 258
E.N. CENTRAL 292 346 93 409 132 165 640 1,546 1,543 1,899 176
Ohio 121 111 58 30 19 13 202 578 243 292 115
Ind. 53 50 29 30 16 15 148 202 148 182 13
Ill. 14 35 6 10 39 81 70 418 735 960 20
Mich. 89 105 - 20 43 40 128 176 299 368 28
Wis. 15 45 U 319 15 16 92 172 118 97 -
W.N. CENTRAL 69 63 148 213 66 43 174 332 541 477 475
Minn. 3 10 112 106 36 19 22 41 141 114 59
Iowa 12 11 9 18 10 3 8 23 66 67 154
Mo. 30 18 20 49 11 10 107 222 227 185 25
N. Dak. 2 - - 1 3 1 - - 12 8 79
S. Dak. 2 3 1 - 1 - 1 - 19 17 74
Nebr. 15 16 2 5 1 3 7 10 17 21 2
Kans. 5 5 4 34 4 7 29 36 59 65 82
S. ATLANTIC 126 161 750 687 346 296 3,066 3,663 3,167 3,397 2,983
Del. 12 12 105 173 5 4 20 35 18 38 54
Md. 27 36 474 341 85 85 864 690 305 279 579
D.C. 4 7 9 3 20 8 106 122 97 127 5
Va. 27 37 62 52 66 57 225 377 305 293 656
W. Va. N N 10 12 1 6 3 9 51 53 87
N.C. 14 12 34 65 20 30 696 1,029 429 507 852
S.C. 8 7 2 9 18 12 348 384 260 339 175
Ga. 1 3 7 1 50 27 516 663 595 604 311
Fla. 32 47 47 31 81 67 288 354 1,107 1,157 264
E.S. CENTRAL 49 54 75 79 34 41 1,554 2,350 1,170 1,297 267
Ky. 8 10 10 26 8 11 129 151 175 227 27
Tenn. 33 22 40 21 10 14 710 822 357 436 148
Ala. 4 5 11 8 10 8 398 516 402 405 87
Miss. 4 17 14 24 6 8 317 861 236 229 5
W.S. CENTRAL 36 24 94 118 57 70 1,123 1,715 2,337 2,361 323
Ark. - 1 25 22 5 2 128 234 171 197 54
La. 6 2 5 8 16 8 351 476 265 241 5
Okla. 7 11 29 24 8 - 116 170 168 166 109
Tex. 23 10 35 64 28 60 528 835 1,733 1,757 155
MOUNTAIN 62 55 23 8 65 58 179 147 457 628 187
Mont. 1 1 - - 2 7 - - 17 19 49
Idaho 2 - 4 1 - - 1 4 15 10 -
Wyo. 1 7 5 3 2 7 - 2 2 6 31
Colo. 17 11 6 - 30 24 14 24 75 103 28
N. Mex. 3 2 1 1 8 2 16 7 53 84 12
Ariz. 12 21 4 - 11 7 134 88 218 231 53
Utah 19 6 1 1 3 5 5 3 31 51 6
Nev. 7 7 2 2 9 6 9 19 46 124 8
PACIFIC 57 50 194 97 479 383 311 539 3,768 4,723 298
Wash. 9 6 10 18 49 22 10 9 249 273 -
Oreg. - - 21 19 24 24 9 9 138 180 14
Calif. 47 38 161 59 393 323 290 517 3,166 4,005 260
Alaska - 1 2 - 5 3 1 - 71 69 24
Hawaii 1 5 - 1 8 11 1 4 144 196 -
Guam - 1 - - - - 3 3 13 93 -
P.R. - - - - 6 2 232 206 212 182 64
V.I. - 1 - - - 1 - - - - -
Amer. Samoa - - - - - - - - - - -
C.N.M.I. - - - - - - 9 1 2 - -
-------------------------------------------------------------------------------------------------------------------------------------------
N: Not notifiable U: Unavailable -: no reported cases
=======================================================================================================================================================
Return to top. Table_III Note: To print large tables and graphs users may have to change their printer settings to landscape and use a small font size.
TABLE III. (page 1) Provisional cases of selected notifiable diseases preventable by vaccination, United
States, weeks ending December 13, 1997, and December 14, 1996 (50th Week)
Hepatitis (Viral), by type Measles (Rubeola)
H. influenzae, --------------------------------------- ------------------------------------------------------------
invasive A B Indigenous Imported** Total
---------------- ----------------- ----------------- --------------- --------------- ---------------
Cum. Cum. Cum. Cum. Cum. Cum. Cum. Cum. Cum. Cum.
Reporting Area 1997* 1996 1997 1996 1997 1996 1997 1997 1997 1997 1997 1996
-----------------------------------------------------------------------------------------------------------------------------------------------------
UNITED STATES 996 989 26,585 27,875 8,357 9,470 1 73 - 55 128 494
NEW ENGLAND 60 39 606 413 146 217 - 11 - 8 19 16
Maine 5 - 59 24 6 2 - - - 1 1 -
N.H. 10 12 34 21 17 18 - 1 - - 1 -
Vt. 3 2 14 12 7 13 - - - - - 2
Mass. 37 23 239 199 55 90 - 10 - 6 16 12
R.I. 3 2 129 22 16 12 - - - - - -
Conn. 2 - 131 135 45 82 - - - 1 1 2
MID. ATLANTIC 139 203 1,792 1,865 1,245 1,337 1 19 - 8 27 37
Upstate N.Y. 37 47 341 419 296 323 - 2 - 3 5 11
N.Y. City 35 55 669 594 424 474 1 9 - 2 11 11
N.J. 47 61 246 349 201 268 - 3 - - 3 3
Pa. 20 40 536 503 324 272 - 5 - 3 8 12
E.N. CENTRAL 155 174 2,726 2,495 890 1,044 - 6 - 3 9 21
Ohio 83 88 305 734 88 117 - - - - - 6
Ind. 18 14 314 358 92 135 - - - - - -
Ill. 37 48 679 727 220 326 - 6 - 1 7 3
Mich. 15 11 1,283 488 445 379 - - - 2 2 3
Wis. 2 13 145 188 45 87 - - - - - 9
W.N. CENTRAL 61 46 2,077 2,487 444 531 - 12 - 5 17 23
Minn. 44 31 191 139 42 68 - 3 - 5 8 18
Iowa 7 4 466 315 45 74 - - - - - 1
Mo. 6 8 1,043 1,335 303 314 - 1 - - 1 3
N. Dak. - - 10 138 5 2 - - - - - -
S. Dak. 2 1 23 42 1 5 - 8 - - 8 -
Nebr. 1 1 96 144 15 38 - - - - - -
Kans. 1 1 248 374 33 30 - - - - - 1
S. ATLANTIC 168 187 2,058 1,337 1,225 1,278 - 2 - 13 15 11
Del. - 2 31 21 6 9 - - - - - 1
Md. 58 61 207 241 178 163 - - - 2 2 2
D.C. - 5 36 36 30 32 - - - 1 1 -
Va. 13 10 221 184 124 137 - - - 1 1 3
W. Va. 4 10 11 18 16 32 - - - - - -
N.C. 21 25 200 176 251 324 - - - 2 2 2
S.C. 4 5 108 56 96 97 - - - 1 1 -
Ga. 39 35 651 153 139 32 - - - 1 1 2
Fla. 29 34 593 452 385 452 - 2 - 5 7 1
E.S. CENTRAL 45 26 589 1,220 661 863 - - - - - 2
Ky. 6 6 69 53 37 75 - - - - - -
Tenn. 25 10 370 753 430 485 - - - - - 2
Ala. 14 9 82 204 74 74 - - - - - -
Miss. - 1 68 210 120 229 - - - - - -
W.S. CENTRAL 51 41 5,455 5,680 1,166 1,198 - 3 - 5 8 26
Ark. 1 - 211 459 59 79 U - U - - -
La. 13 5 228 213 164 151 - - - - - -
Okla. 32 31 1,396 2,380 50 24 - - - 1 1 -
Tex. 5 5 3,620 2,628 893 944 U 3 U 4 7 26
MOUNTAIN 91 53 4,143 4,309 863 1,112 - 6 - 2 8 157
Mont. - 1 71 113 12 17 - - - - - -
Idaho 1 1 138 238 53 86 - - - - - 1
Wyo. 4 - 40 39 40 44 - - - - - 1
Colo. 18 15 399 490 153 124 - - - - - 7
N. Mex. 10 10 347 345 247 407 - - - - - 17
Ariz. 32 18 2,207 1,635 194 224 - 5 - - 5 8
Utah 3 8 534 1,026 92 118 - - - 1 1 118
Nev. 23 - 407 423 72 92 - 1 - 1 2 5
PACIFIC 226 220 7,139 8,069 1,717 1,890 - 14 - 11 25 201
Wash. 5 4 616 725 74 110 - 1 - 1 2 38
Oreg. 34 33 364 854 106 128 - - - - - 14
Calif. 173 175 5,992 6,333 1,505 1,624 - 11 - 8 19 46
Alaska 7 6 33 49 21 16 - - - - - 63
Hawaii 7 2 134 108 11 12 - 2 - 2 4 40
Guam - - - 7 3 1 U - U - - -
P.R. - 2 255 243 1,347 990 - - - - - 3
V.I. - - - 36 - 41 U - U - - -
Amer. Samoa - - - - - - U - U - - -
C.N.M.I. 6 10 1 1 34 5 U 1 U - 1 -
-----------------------------------------------------------------------------------------------------------------------------------------------------
N: Not notifiable U: Unavailable -: no reported cases
* Of 227 cases among children aged <5 years, serotype was reported for 120 and of those, 49 were type b.
** For imported measles, cases include only those resulting from importation from other countries.
=======================================================================================================================================================
TABLE III. (page 2) Provisional cases of selected notifiable diseases preventable by vaccination, United
States, weeks ending December 13, 1997, and December 14, 1996 (50th Week)
Meningococcal
Disease Mumps Pertussis Rubella
----------------- -------------------------- --------------------------- ---------------------------
Cum. Cum. Cum. Cum. Cum. Cum. Cum. Cum.
Reporting Area 1997 1996 1997 1997 1996 1997 1997 1996 1997 1997 1996
------------------------------------------------------------------------------------------------------------------------------------------
UNITED STATES 2,972 3,136 7 581 679 97 5,060 6,737 - 158 229
NEW ENGLAND 188 146 - 12 1 10 888 1,669 - 1 27
Maine 18 13 - - - - 7 52 - - -
N.H. 16 10 - 1 - - 126 177 - - -
Vt. 4 4 - - - 2 238 238 - - 2
Mass. 93 61 - 4 1 6 471 1,135 - 1 21
R.I. 20 15 - 6 - 1 17 32 - - -
Conn. 37 43 - 1 - 1 29 35 - - 4
MID. ATLANTIC 311 339 - 55 87 9 365 714 - 31 13
Upstate N.Y. 69 86 - 11 25 - 135 447 - 4 5
N.Y. City 45 51 - 3 18 3 62 56 - 27 5
N.J. 69 74 - 6 4 - 9 31 - - 2
Pa. 128 128 - 35 40 6 159 180 - - 1
E.N. CENTRAL 435 437 5 80 125 11 484 749 - 5 3
Ohio 158 148 1 35 43 1 159 272 - - -
Ind. 53 58 - 14 8 - 69 93 - - -
Ill. 140 132 - 13 23 5 113 165 - 2 1
Mich. 50 45 4 15 48 5 60 54 - - 2
Wis. 34 54 - 3 3 - 83 165 - 3 -
W.N. CENTRAL 218 237 - 18 22 4 508 431 - - -
Minn. 34 31 - 6 6 1 307 333 - - -
Iowa 47 53 - 10 3 1 103 21 - - -
Mo. 95 89 - - 10 2 64 50 - - -
N. Dak. 2 5 - - 2 - 2 1 - - -
S. Dak. 5 10 - - - - 5 4 - - -
Nebr. 14 23 - 2 - - 14 9 - - -
Kans. 21 26 - - 1 - 13 13 - - -
S. ATLANTIC 539 596 2 85 109 9 431 683 - 83 98
Del. 5 2 - - - - 1 26 - - -
Md. 42 56 1 10 36 1 119 266 - - -
D.C. 9 5 - - - - 3 3 - 1 1
Va. 58 61 1 19 16 4 56 99 - 1 2
W. Va. 18 17 - - - - 6 6 - - -
N.C. 88 75 - 12 21 - 118 129 - 59 84
S.C. 58 64 - 11 7 1 30 48 - 19 1
Ga. 105 132 - 10 3 - 13 20 - - -
Fla. 156 184 - 23 26 3 85 86 - 3 10
E.S. CENTRAL 224 229 - 27 22 - 137 197 - - 2
Ky. 46 29 - 3 - - 58 142 - - -
Tenn. 82 60 - 6 1 - 38 21 - - -
Ala. 77 88 - 9 6 - 33 25 - - 2
Miss. 19 52 - 9 15 - 8 9 - - N
W.S. CENTRAL 276 318 - 62 57 - 248 155 - 4 8
Ark. 32 34 U 1 1 U 60 8 U - -
La. 47 59 - 16 18 - 20 11 - - 1
Okla. 42 41 - - 1 - 48 19 - - -
Tex. 155 184 U 45 37 U 120 117 U 4 7
MOUNTAIN 175 180 - 55 24 34 1,170 596 - 7 7
Mont. 9 9 - - - - 19 36 - - -
Idaho 11 24 - 3 - 11 597 108 - 2 2
Wyo. 4 4 - 1 1 - 7 8 - - -
Colo. 46 43 - 3 4 5 311 286 - - 3
N. Mex. 28 27 N N N 11 143 62 - - -
Ariz. 44 37 - 33 1 - 36 32 - 5 1
Utah 15 17 - 8 3 - 24 23 - - -
Nev. 18 19 - 7 15 7 33 41 - - 1
PACIFIC 606 654 - 187 232 20 829 1,543 - 27 71
Wash. 86 97 - 19 21 20 398 717 - 5 15
Oreg. 124 118 N N N - 10 63 - - 1
Calif. 387 424 - 141 178 - 393 726 - 14 52
Alaska 2 9 - 4 3 - 14 3 - - -
Hawaii 7 6 - 23 30 - 14 34 - 8 3
Guam 1 4 U 1 10 U - - U - -
P.R. 10 12 - 7 2 - 2 3 - - -
V.I. - - U - 2 U - - U - -
Amer. Samoa - - U - - U - - U - -
C.N.M.I. - - U 4 - U - - U - -
------------------------------------------------------------------------------------------------------------------------------------------
N: Not notifiable U: Unavailable -: no reported cases
=======================================================================================================================================================
Return to top. Table_IV Note: To print large tables and graphs users may have to change their printer settings to landscape and use a small font size.
TABLE IV. Deaths in 122 U.S. cities,* week ending
December 13, 1997 (50th Week)
===================================================================================================================================
All Causes, By Age (Years)
------------------------------------------------------------------------ P&I**
Reporting Area All Ages >=65 45-64 25-44 1-24 <1 Total
---------------------------------------------------------------------------------------------------------------
NEW ENGLAND 595 425 106 38 11 15 41
Boston, Mass. 151 93 32 14 4 8 17
Bridgeport, Conn. 49 34 11 3 - 1 2
Cambridge, Mass. 12 9 2 1 - - 2
Fall River, Mass. 27 25 2 - - - -
Hartford, Conn. 64 39 14 7 3 1 2
Lowell, Mass. 21 17 2 1 - 1 -
Lynn, Mass. 18 15 3 - - - -
New Bedford, Mass. 21 17 3 1 - - 1
New Haven, Conn. 34 25 5 3 1 - 1
Providence, R.I. 58 43 10 3 1 1 3
Somerville, Mass. 3 3 - - - - -
Springfield, Mass. 50 38 7 4 1 - 2
Waterbury, Conn. 32 24 8 - - - 2
Worcester, Mass. 55 43 7 1 1 3 9
MID. ATLANTIC 2,460 1,698 491 191 42 38 129
Albany, N.Y. 47 35 5 5 1 1 -
Allentown, Pa. 21 16 5 - - - -
Buffalo, N.Y. 66 51 10 3 1 1 4
Camden, N.J. 26 15 5 4 1 1 4
Elizabeth, N.J. 22 15 4 2 1 - 1
Erie, Pa. 44 30 11 2 1 - -
Jersey City, N.J. 57 30 21 4 - 2 4
New York City, N.Y. 1,266 870 252 110 18 16 61
Newark, N.J. 55 31 13 7 2 2 3
Paterson, N.J. 41 34 2 1 2 2 2
Philadelphia, Pa. 400 258 81 34 15 12 24
Pittsburgh, Pa.*** 46 33 11 2 - - 1
Reading, Pa. 31 25 3 3 - - 4
Rochester, N.Y. 123 93 23 7 - - 7
Schenectady, N.Y. 24 20 3 - - 1 1
Scranton, Pa. 20 17 2 1 - - 2
Syracuse, N.Y. 126 94 28 4 - - 10
Trenton, N.J. 29 19 8 2 - - 1
Utica, N.Y. 16 12 4 - - - -
Yonkers, N.Y. U U U U U U U
E.N. CENTRAL 2,208 1,487 404 153 77 84 139
Akron, Ohio 46 28 12 4 - 1 1
Canton, Ohio 43 34 6 3 - - 3
Chicago, Ill. 512 274 108 44 28 56 35
Cincinnati, Ohio 132 94 23 6 5 4 14
Cleveland, Ohio 158 114 32 10 1 1 6
Columbus, Ohio 190 124 42 14 4 6 12
Dayton, Ohio 102 67 23 9 2 1 9
Detroit, Mich. 187 117 39 21 5 5 13
Evansville, Ind. 57 44 7 5 1 - 4
Fort Wayne, Ind. 81 59 13 4 5 - 5
Gary, Ind. 8 5 2 1 - - -
Grand Rapids, Mich. 68 55 9 - 2 2 8
Indianapolis, Ind. 200 144 23 13 15 5 -
Lansing, Mich. 41 29 11 - 1 - 3
Milwaukee, Wis. 130 97 25 4 4 - 13
Peoria, Ill. U U U U U U U
Rockford, Ill. 48 39 6 2 1 - 4
South Bend, Ind. 46 39 3 3 - 1 -
Toledo, Ohio 95 73 13 5 3 1 8
Youngstown, Ohio 64 51 7 5 - 1 1
W.N. CENTRAL 846 601 124 68 20 20 54
Des Moines, Iowa U U U U U U U
Duluth, Minn. 38 32 3 2 - 1 2
Kansas City, Kans. 51 35 11 3 2 - 2
Kansas City, Mo. 91 49 16 10 2 1 5
Lincoln, Nebr. 33 26 3 4 - - 3
Minneapolis, Minn. 209 155 32 14 3 5 15
Omaha, Nebr. 118 86 14 10 5 3 10
St. Louis, Mo. 122 83 23 7 6 3 10
St. Paul, Minn. 84 66 11 5 - 2 5
Wichita, Kans. 100 69 11 13 2 5 2
S. ATLANTIC 1,431 940 291 129 39 30 92
Atlanta, Ga. 193 127 45 14 4 3 10
Baltimore, Md. 317 195 73 37 6 6 33
Charlotte, N.C. 85 61 14 6 2 1 10
Jacksonville, Fla. 133 99 17 9 2 6 2
Miami, Fla. 107 61 24 15 5 2 1
Norfolk, Va. 51 32 13 3 2 1 4
Richmond, Va. 76 48 16 8 4 - 1
Savannah, Ga. 64 44 14 4 1 1 5
St. Petersburg, Fla. 74 56 10 5 3 - 9
Tampa, Fla. 207 148 34 15 2 7 13
Washington, D.C. 99 54 25 12 5 3 4
Wilmington, Del. 25 15 6 1 3 - -
E.S. CENTRAL 941 642 188 67 22 21 57
Birmingham, Ala. 213 158 41 9 2 2 19
Chattanooga, Tenn. 87 62 17 5 3 - 6
Knoxville, Tenn. 86 58 19 6 2 1 8
Lexington, Ky. 71 52 13 4 - 2 4
Memphis, Tenn. 162 107 25 18 7 5 12
Mobile, Ala. 128 89 25 9 2 3 -
Montgomery, Ala. 50 31 12 3 1 3 -
Nashville, Tenn. 144 85 36 13 5 5 8
W.S. CENTRAL 1,493 959 323 147 42 22 117
Austin, Tex. 79 59 9 8 3 - 5
Baton Rouge, La. 48 27 15 5 1 - 1
Corpus Christi, Tex. 69 50 10 6 2 1 7
Dallas, Tex. 224 139 44 30 8 3 11
El Paso, Tex. 96 62 25 7 1 1 9
Ft. Worth, Tex. U U U U U U U
Houston, Tex. 390 221 104 46 11 8 36
Little Rock, Ark. 76 48 16 7 4 1 1
New Orleans, La. 62 32 15 9 4 2 -
San Antonio, Tex. 235 173 42 12 4 4 21
Shreveport, La. 62 41 15 4 2 - 4
Tulsa, Okla. 152 107 28 13 2 2 22
MOUNTAIN 794 569 120 64 21 20 52
Albuquerque, N.M. 101 70 9 14 5 3 4
Boise, Idaho 37 29 5 2 1 - 6
Colo. Springs, Colo. 72 52 12 4 - 4 5
Denver, Colo. 102 72 17 8 2 3 6
Las Vegas, Nev. 184 126 40 12 3 3 9
Ogden, Utah 22 16 2 1 1 2 -
Phoenix, Ariz. U U U U U U U
Pueblo, Colo. 29 23 2 2 1 1 4
Salt Lake City, Utah 102 80 10 5 5 2 8
Tucson, Ariz. 145 101 23 16 3 2 10
PACIFIC 1,395 976 258 99 29 31 127
Berkeley, Calif. 21 18 2 - - 1 1
Fresno, Calif. 118 82 24 6 4 2 4
Glendale, Calif. U U U U U U U
Honolulu, Hawaii 71 58 8 4 - 1 8
Long Beach, Calif. 97 67 22 4 3 1 14
Los Angeles, Calif. U U U U U U U
Pasadena, Calif. 31 24 3 2 - 2 -
Portland, Oreg. U U U U U U U
Sacramento, Calif. 235 163 38 22 6 6 34
San Diego, Calif. 163 103 38 15 1 5 17
San Francisco, Calif. 151 90 33 19 3 5 14
San Jose, Calif. 197 141 41 8 4 3 19
Santa Cruz, Calif. 20 13 5 2 - - 2
Seattle, Wash. 131 92 24 8 3 4 4
Spokane, Wash. 59 47 10 1 1 - 3
Tacoma, Wash. 101 78 10 8 4 1 7
TOTAL 12,163**** 8,297 2,305 956 303 281 808
---------------------------------------------------------------------------------------------------------------
U: Unavailable -: no reported cases
* Mortality data in this table are voluntarily reported from 122 cities in the United States, most of which have populations
of 100,000 or more. A death is reported by the place of its occurrence and by the week that the death certificate was
filed. Fetal deaths are not included.
** Pneumonia and influenza.
*** Because of changes in reporting methods in these 3 Pennsylvania cities, these numbers are partial counts for the current
week. Complete counts will be available in 4 to 6 weeks.
**** Total includes unknown ages.
===================================================================================================================================
Return to top. Disclaimer All MMWR HTML versions of articles are electronic conversions from ASCII text into HTML. This conversion may have resulted in character translation or format errors in the HTML version. Users should not rely on this HTML document, but are referred to the electronic PDF version and/or the original MMWR paper copy for the official text, figures, and tables. An original paper copy of this issue can be obtained from the Superintendent of Documents, U.S. Government Printing Office (GPO), Washington, DC 20402-9371; telephone: (202) 512-1800. Contact GPO for current prices. **Questions or messages regarding errors in formatting should be addressed to mmwrq@cdc.gov.Page converted: 09/19/98 |
|||||||||
This page last reviewed 5/2/01
|