 |
|
|
|
|
|
|
| ||||||||||
|
|
|
|
|
|
|
||||
| ||||||||||
|
|
|
|
|
Persons using assistive technology might not be able to fully access information in this file. For assistance, please send e-mail to: mmwrq@cdc.gov. Type 508 Accommodation and the title of the report in the subject line of e-mail. Trends in the Prevalence and Incidence of Self-Reported Diabetes Mellitus -- United States, 1980-1994Diabetes mellitus is associated with severe microvascular complications (e.g., kidney disease and eye disease) and macrovascular complications (e.g., stroke and ischemic heart disease) (1,2). These complications can result in severe long-term complications (e.g., amputation, disability, and blindness) and account for a substantial economic burden (3). This report uses data from CDC's National Health Interview Survey (NHIS) to examine trends in the incidence and prevalence of self-reported diabetes in the United States during 1980-1994. The findings document increases in both the incidence and prevalence of diabetes during this period and suggest that most of the increase was attributable to factors other than the aging of the U.S. population. Estimates of the prevalence and incidence of self-reported diabetes in the United States were obtained from the NHIS of CDC's National Center for Health Statistics for 1980-1994 (the most recent year for which data were available). The NHIS is a multistage probability-designed household survey of approximately 120,000 U.S. civilian, noninstitutionalized adults (aged greater than or equal to 18 years) (4). Each year, a one-sixth subsample of NHIS respondents is asked whether during the preceding 12 months any family member has had diabetes. If a household member is reported to have had diabetes, the respondent is asked for the time since diagnosis. In this report, the prevalence of diagnosed diabetes is derived from the number of persons reported to have had diabetes, and the incidence of diabetes is derived from the number of persons reported to have had diabetes diagnosed within the previous 12 months. Race-specific comparisons were restricted to whites and blacks because numbers for other racial/ethnic groups were too small for meaningful analysis. NHIS data were weighted to reflect the U.S. civilian, noninstitutionalized population, and standard errors of the estimates were calculated by using SUDAAN. Weighted linear regression was used for analysis of temporal trends. Prevalence and incidence data were age-adjusted by the direct method using the 1980 resident population as the standard. In 1994, approximately 7.7 million persons in the U.S. civilian, noninstitutionalized population reported having diabetes; this total is an increase of 2.2 million since 1980 (Table_1). From 1980 to 1994, the crude prevalence of diagnosed diabetes increased 17%, from 25.4 to 29.8 per 1000 population (p less than 0.01), respectively. The age-adjusted prevalence of diagnosed diabetes increased 15%, from 25.5 to 29.3 per 1000 (p less than 0.01). During the 1990s, the number of new cases of diagnosed diabetes has averaged 727,000 per year (Table_1). During 1992-1994, both the crude and age-adjusted incidence of diagnosed diabetes increased significantly (p less than 0.01). In 1994, the crude incidence of diagnosed diabetes was 48% higher than that in 1980 (3.7 versus 2.5 per 1000) (p less than 0.01). The prevalence of diagnosed diabetes increased with increasing age (Figure_1). From 1980 to 1994, prevalence increased in each of the three age groups examined (less than or equal to 44 years, 45-64 years, and greater than or equal to 65 years) (Figure_1) (p less than 0.01 for each age group). The absolute change in prevalence increased with increasing age (p less than 0.01, weighted least squares regression, F test). The age-adjusted prevalence of diagnosed diabetes was higher among blacks than among whites during 1980-1994 (Figure_2). During this period, the age-adjusted prevalence of diagnosed diabetes increased 33% (from 40.1 to 53.5 per 1000) among blacks (p=0.05) and increased 11% (from 23.8 to 26.4 per 1000) among whites (p less than 0.01). Reported by: Epidemiology and Statistics Br, Div of Diabetes Translation, National Center for Chronic Disease Prevention and Health Promotion, CDC. Editorial NoteEditorial Note: Type 2 diabetes (which accounts for 90%-95% of all diagnosed diabetes) is associated with risk factors that are modifiable (e.g., obesity and physical inactivity) and nonmodifiable (e.g., genetic factors, older age, race/ethnicity, and positive family history) (2). Therefore, variations in patterns of some of these risk factors (e.g., increases in the prevalence of obesity {5,6}, aging of the total U.S. population, and increases in some U.S. racial/ethnic minority groups) probably will affect the prevalence and incidence of diagnosed diabetes. The increasing prevalence and incidence of diabetes documented in this report underscore the urgent need for effective intervention strategies to prevent diabetes and its complications. These data also highlight the need to intensify prevention efforts among blacks as a group in which diabetes and its complications have occurred at disproportionately higher levels. The frequency of diabetes among blacks is influenced by the same modifiable and nonmodifiable risk factors that are associated with diabetes in whites (7), and the higher prevalence of diabetes among blacks may reflect higher levels of these risk factors among blacks compared with whites. The findings in this report indicate that most of the increase in the prevalence of diabetes during 1980-1994 and the recent increase in incidence of diagnosed diabetes are not entirely attributable to the aging of the U.S. population. However, because these findings are based on cross-sectional surveillance data, this analysis cannot determine whether the recent increase in diabetes incidence reflects sampling variability, a true increase in disease incidence, improved ascertainment of cases, or a combination of these factors. In addition, this analysis cannot determine the relative influence of diabetes incidence and mortality on the increase in the prevalence of diagnosed diabetes. However, findings of a recent prospective cohort study indicate that survival among persons with diabetes did not increase at a greater rate than that among the total population, suggesting that the increased prevalence of diagnosed diabetes may reflect increased disease incidence (8). Because the NHIS estimates are based on self-reports of diabetes, these findings probably underestimate the true prevalence of diabetes. Although the validity of self-reported diabetes is high for those with diagnosed diabetes (9), millions of persons with diabetes do not know they have the disease (10). In addition, the sampling variability of the estimated prevalence of diabetes among blacks and the incidence in the total population was large; therefore, failure to achieve statistical significance in some trends may reflect small sample sizes instead of a lack of true trends. CDC and other organizations are collaborating on development and implementation of primary-prevention (prevention of diabetes), secondary-prevention (prevention of diabetes complications), and tertiary-prevention (prevention of disability) efforts directed at diabetes and its complications. CDC's efforts include 1) providing technical assistance and support to diabetes-control programs in all 50 states, the District of Columbia, and the U.S. territories; 2) conducting surveillance, health services research, and cost-effectiveness research to provide information for public health decision-making; 3) sponsoring Project DIRECT (Diabetes Intervention Reaching and Educating Communities Together), a community-based demonstration project in a predominantly black community aimed at secondary and tertiary prevention by reducing modifiable risk factors for diabetes; 4) participating in a clinical trial sponsored by the National Institutes of Health to test the effectiveness of interventions -- including dietary and physical activity lifestyle changes -- in the primary prevention of type 2 diabetes; and 5) participating in the National Diabetes Education Program, a coalition of organizations formed to increase awareness of the risk factors for diabetes and to reduce the burden of diabetes in the U.S. population through secondary and tertiary prevention. Monitoring trends in diabetes provides critical information for developing a public health response to diabetes. Therefore, CDC will continue efforts to improve diabetes surveillance data to assure effective and timely public health responses to this disease. References
Table_1 Note: To print large tables and graphs users may have to change their printer settings to landscape and use a small font size.
TABLE 1. Prevalence and incidence of self-reported diabetes mellitus, by year -- United States, National Health Interview
Survey, 1980-1994
===========================================================================================================================
                             Prevalence                                               Incidence
       -----------------------------------------------------    -----------------------------------------------------------
Year   No. existing cases *   Crude rate +  Age-adjusted rate + No. existing cases *  Crude rate &  Age-adjusted rate &
---------------------------------------------------------------------------------------------------------------------------
1980          5528              25.4             25.5                  541               2.5              2.5
1981          5645              25.1             25.3                  501               2.2              2.2
1982          5729              25.2             25.4                  713               3.1              3.2
1983          5613              24.5             24.7                  690               3.0              3.0
1984          6004              25.9             26.0                  645               2.8              2.8
1985          6134              26.2             26.2                  679               2.9              2.9
1986          6563              27.8             27.8                  644               2.7              2.7
1987          6609              27.7             27.6                  715               3.0              3.0
1988          6162              25.6             25.4                  678               2.8              2.8
1989          6467              26.6             26.3                  677               2.8              2.8
1990          6212              25.2             24.8                  521               2.1              2.1
1991          7206              29.0             28.5                  672               2.7              2.7
1992          7365              29.3             28.5                  613               2.4              2.4
1993          7783              30.6             29.7                  865               3.4              3.3
1994          7744              29.8             29.3                  965               3.7              3.7
---------------------------------------------------------------------------------------------------------------------------
* In thousands.
+ The number of persons who reported having diabetes per 1000 population.
& The number of persons who reported having had diabetes diagnosed within the previous 12 months per 1000 population.
===========================================================================================================================
Return to top. Figure_1 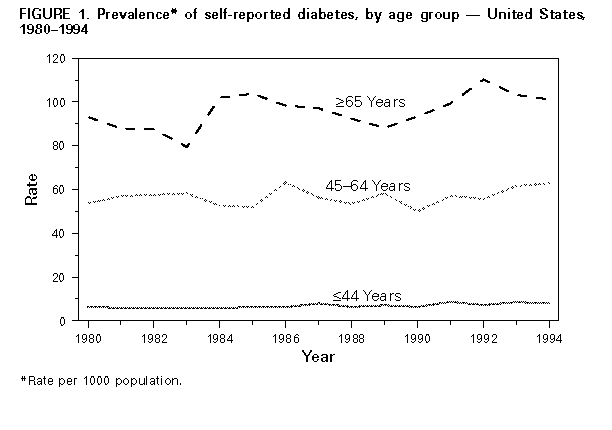 Return to top. Figure_2 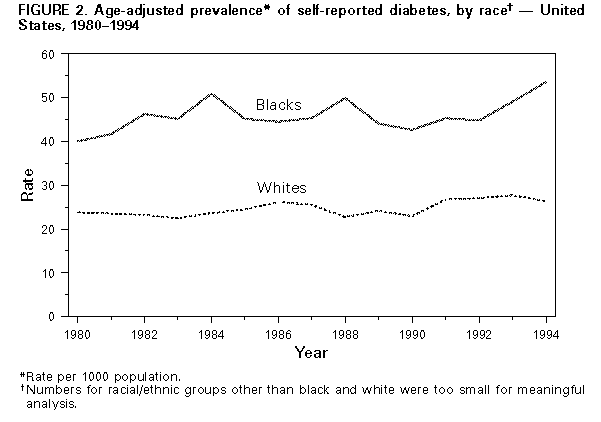 Return to top. Disclaimer All MMWR HTML versions of articles are electronic conversions from ASCII text into HTML. This conversion may have resulted in character translation or format errors in the HTML version. Users should not rely on this HTML document, but are referred to the electronic PDF version and/or the original MMWR paper copy for the official text, figures, and tables. An original paper copy of this issue can be obtained from the Superintendent of Documents, U.S. Government Printing Office (GPO), Washington, DC 20402-9371; telephone: (202) 512-1800. Contact GPO for current prices. **Questions or messages regarding errors in formatting should be addressed to mmwrq@cdc.gov.Page converted: 09/19/98 |
|||||||||
This page last reviewed 5/2/01
|