 |
|
|
|
|
|
|
| ||||||||||
|
|
|
|
|
|
|
||||
| ||||||||||
|
|
|
|
|
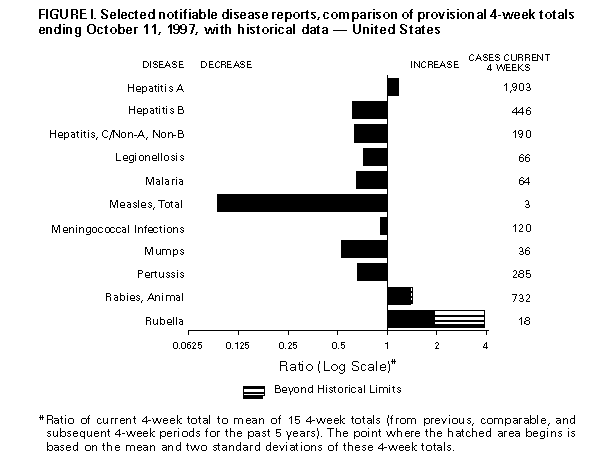
Persons using assistive technology might not be able to fully access information in this file. For assistance, please send e-mail to: mmwrq@cdc.gov. Type 508 Accommodation and the title of the report in the subject line of e-mail. Notifiable Diseases/Deaths in Selected Cities Weekly InformationFigure_I Selected notifiable disease reports, comparison of provisional 4-week totals ending October 11, 1997, with historical data -- United States Table_I Summary -- provisional cases of selected notifiable diseases, United States, cumulative, week ending October 11, 1997 (41st Week) Table_II Provisional cases of selected notifiable diseases, United States, weeks ending October 11, 1997 and October 12, 1996 (41st Week) Table_III Provisional cases of selected notifiable diseases preventable by vaccination, United States, weeks ending October 11, 1997 and October 12, 1996 (41st Week) Table_IV Deaths in 122 U.S. cities, week ending
October 11, 1997 (41st Week)
TABLE I. Summary -- provisional cases of specified notifiable diseases, United
States, cumulative, week ending October 11, 1997 (41st Week)
==================================================================================
                                             Cum. 1997
------------------------------------------------------
Anthrax                                              -
Brucellosis                                         60
Cholera                                              7
Congenital rubella syndrome                          4
Cryptosporidiosis*                               1,338
Diphtheria                                           6
Encephalitis:  California*                          79
               eastern equine*                       6
               St. Louis*                            8
               western equine*                       -
Hansen Disease                                      78
Hantavirus pulmonary syndrome*+                     15
Hemolytic uremic syndrome, post-diarrheal*          46
HIV infection, pediatric*&                         182
Plague                                               2
Poliomyelitis, paralytic                             -
Psittacosis                                         38
Rabies, human                                        2
Rocky Mountain spotted fever (RMSF)                327
Streptococcal disease, invasive Group A          1,125
Streptococcal toxic-shock syndrome*                 28
Syphilis, congenital@                              354
Tetanus                                             34
Toxic-shock syndrome                                99
Trichinosis                                          7
Typhoid fever                                      260
Yellow fever                                         -
------------------------------------------------------
-: no reported cases
 * Not notifiable in all states
 + Updated weekly from reports to the Division of Viral and Rickettsial
   Diseases, National Center for Infectious Diseases (NCID).
 & Updated monthly to the Division of HIV/AIDS Prevention, National Center
   for HIV, STD, and TB Prevention (NCHSTP), last update October 5, 1997.
 @ Updated quarterly from reports to the Division of STD Prevention,
   NCHSTP.

==================================================================================
Return to top. Table_II Note: To print large tables and graphs users may have to change their printer settings to landscape and use a small font size.
TABLE II. (page 1) Provisional cases of selected notifiable diseases, United States, weeks ending
October 11, 1997, and October 12, 1996 (41st Week)
Escherichia
coli O157:H7
------------------- Hepatitis
AIDS* Chlamydia NETSS** PHLIS*** Gonorrhea C\NA,NB
----------------- -------------------- -------- -------- ------------------- ----------------
Cum. Cum. Cum. Cum. Cum. Cum. Cum. Cum. Cum. Cum.
Reporting Area 1997 1996 1997 1996 1997 1997 1997 1996 1997 1996
------------------------------------------------------------------------------------------------------------------------------
UNITED STATES 44,447 51,390 348,650 337,172 1,845 1,168 219,267 248,053 2,464 2,767
NEW ENGLAND 1,903 2,055 13,731 13,530 157 90 4,517 5,055 51 84
Maine 46 32 797 732 16 - 54 50 - -
N.H. 29 66 614 585 9 12 75 129 8 7
Vt. 31 18 326 307 7 2 43 42 2 22
Mass. 646 995 5,733 5,459 82 67 1,703 1,733 34 49
R.I. 119 128 1,566 1,517 8 - 347 408 7 6
Conn. 1,032 816 4,695 4,930 35 9 2,295 2,693 - -
MID. ATLANTIC 13,720 14,208 47,645 47,714 111 40 29,050 32,389 272 239
Upstate N.Y. 2,137 1,853 N N 73 - 4,727 5,924 201 192
N.Y. City 7,308 7,847 24,825 23,652 10 6 11,151 11,333 - 3
N.J. 2,667 2,881 7,043 9,803 28 22 5,525 6,869 - -
Pa. 1,608 1,627 15,777 14,259 N 12 7,647 8,263 71 44
E.N. CENTRAL 3,255 4,026 52,312 67,486 346 214 32,430 46,369 426 387
Ohio 683 870 15,105 16,389 92 48 9,373 11,935 16 30
Ind. 447 463 7,106 7,509 58 33 4,712 5,002 10 8
Ill. 1,356 1,800 8,299 19,428 60 - 4,057 13,826 69 75
Mich. 564 682 14,800 15,780 136 95 11,198 11,716 331 274
Wis. 205 211 7,002 8,380 N 38 3,090 3,890 - -
W.N. CENTRAL 859 1,203 18,928 24,604 428 344 8,800 11,972 133 79
Minn. 157 225 U 4,017 195 185 U 1,881 3 2
Iowa 86 71 3,407 3,435 99 63 895 906 27 37
Mo. 392 619 9,249 9,665 41 54 5,781 6,582 89 21
N. Dak. 13 11 546 652 11 9 37 25 2 -
S. Dak. 8 10 1,080 1,155 26 23 118 147 - -
Nebr. 83 83 1,757 2,154 39 - 695 835 2 6
Kans. 120 184 2,889 3,526 17 10 1,274 1,596 10 13
S. ATLANTIC 10,879 13,028 71,287 39,300 167 118 69,916 73,125 229 155
Del. 184 230 1,276 1,148 4 4 956 1,147 - 1
Md. 1,695 1,950 5,583 U 19 9 10,340 8,791 14 2
D.C. 767 1,007 N N 2 - 3,436 3,497 - -
Va. 879 894 8,953 9,053 N 40 6,466 7,447 23 13
W. Va. 92 88 2,316 1,707 N 1 718 622 16 9
N.C. 680 678 14,482 U 60 30 14,293 14,440 41 41
S.C. 631 663 9,936 U 8 7 9,221 8,594 35 25
Ga. 1,267 1,870 9,803 9,315 35 - 11,389 14,685 U -
Fla. 4,684 5,648 18,938 18,077 38 27 13,097 13,902 100 64
E.S. CENTRAL 1,561 1,741 26,047 24,263 84 34 26,180 25,806 278 455
Ky. 290 307 5,048 5,308 27 - 3,268 3,310 12 27
Tenn. 638 640 10,033 10,568 41 34 8,689 9,417 196 326
Ala. 384 470 6,789 6,691 13 - 9,485 10,625 10 4
Miss. 249 324 4,177 1,696 3 - 4,738 2,454 60 98
W.S. CENTRAL 4,694 5,107 42,966 42,999 57 16 28,649 30,016 350 306
Ark. 180 205 2,068 1,426 9 5 3,379 3,216 3 8
La. 797 1,164 7,453 5,935 6 3 7,242 6,192 178 181
Okla. 240 191 5,864 5,999 8 5 3,844 3,859 7 1
Tex. 3,477 3,547 27,581 29,639 34 3 14,184 16,749 162 116
MOUNTAIN 1,277 1,527 19,587 20,411 210 117 6,878 6,031 356 463
Mont. 35 33 776 980 22 - 34 25 20 13
Idaho 41 31 1,216 1,213 28 13 105 86 50 94
Wyo. 13 5 455 490 16 12 43 37 167 143
Colo. 299 404 1,896 2,551 72 53 1,782 1,182 33 48
N. Mex. 141 139 2,437 3,082 7 5 961 677 44 69
Ariz. 323 461 9,627 8,493 N 24 3,211 2,951 24 58
Utah 104 142 1,325 1,234 54 - 214 242 4 19
Nev. 321 312 1,855 2,368 11 10 528 831 14 19
PACIFIC 6,299 8,494 56,147 56,865 285 195 12,847 17,290 369 599
Wash. 532 539 7,132 7,520 84 54 1,526 1,644 21 46
Oreg. 248 359 3,830 4,250 67 78 588 665 3 6
Calif. 5,434 7,426 42,772 42,715 123 56 10,067 14,277 217 371
Alaska 37 28 1,185 949 11 1 305 344 - 3
Hawaii 48 142 1,228 1,431 N 6 361 360 128 173
Guam 2 4 86 309 N - 9 51 - 6
P.R. 1,511 1,785 U U 32 U 470 519 119 130
V.I. 80 17 N N N U - - - -
Amer. Samoa - - - - N U - - - -
C.N.M.I. 1 - N N N U 17 11 2 -
------------------------------------------------------------------------------------------------------------------------------
N: Not notifiable U: Unavailable -: no reported cases C.N.M.I.: Commonwealth of North Mariana Islands
* Updated monthly to the Division of HIV/AIDS Prevention, National Center for HIV, STD, and TB Prevention, last update October 5, 1997.
** National Electronic Telecommunications System for Surveillance.
*** Public Health Laboratory Information System.
=======================================================================================================================================================
TABLE II. (page 2) Provisional cases of selected notifiable diseases, United States, weeks ending
October 11, 1997, and October 12, 1996 (41st Week)
Lyme Syphilis Rabies,
Legionellosis Disease Malaria (Primary & Secondary) Tuberculosis Animal
---------------- ---------------- ---------------- --------------------- ----------------- -------
Cum. Cum. Cum. Cum. Cum. Cum. Cum. Cum. Cum. Cum. Cum.
Reporting Area 1997 1996 1997 1996 1997 1996 1997 1996 1997 1996 1997
-------------------------------------------------------------------------------------------------------------------------------------------
UNITED STATES 705 753 7,963 12,293 1,325 1,301 6,224 9,259 13,329 15,043 6,208
NEW ENGLAND 62 42 2,419 3,524 70 49 111 140 341 334 938
Maine 2 2 8 44 1 7 - - 11 18 167
N.H. 7 3 33 42 8 2 - 1 13 11 31
Vt. 11 4 8 20 2 4 - - 5 1 101
Mass. 18 24 263 216 25 20 54 64 201 168 214
R.I. 7 9 343 423 5 6 2 2 30 27 26
Conn. 17 N 1,764 2,779 29 10 55 73 81 109 399
MID. ATLANTIC 142 191 4,442 7,397 338 395 298 423 2,419 2,788 1,329
Upstate N.Y. 42 58 1,802 3,412 54 73 31 62 331 322 984
N.Y. City 7 16 51 340 195 236 69 121 1,232 1,452 U
N.J. 20 13 1,200 1,720 70 60 110 138 504 597 138
Pa. 73 104 1,389 1,925 19 26 88 102 352 417 207
E.N. CENTRAL 211 229 76 373 110 153 541 1,365 1,295 1,598 156
Ohio 95 82 50 22 17 13 167 505 228 235 103
Ind. 39 42 22 25 15 14 127 172 105 141 11
Ill. 7 31 4 8 31 74 58 392 642 843 16
Mich. 59 37 - 6 36 37 111 142 230 296 26
Wis. 11 37 U 312 11 15 78 154 90 83 -
W.N. CENTRAL 48 40 99 152 46 38 129 273 421 382 388
Minn. 1 4 69 58 19 17 U 34 114 87 43
Iowa 11 8 6 18 10 2 7 18 45 50 129
Mo. 16 12 17 43 8 9 94 189 178 154 20
N. Dak. 2 - - - 3 1 - - 10 6 62
S. Dak. 2 2 1 - 1 - - - 10 17 62
Nebr. 12 11 2 3 1 2 5 10 14 15 2
Kans. 4 3 4 30 4 7 23 22 50 53 70
S. ATLANTIC 100 109 592 591 280 237 2,586 3,022 2,593 2,848 2,496
Del. 9 11 34 167 5 3 17 34 18 34 47
Md. 19 24 424 277 77 68 732 553 253 235 452
D.C. 4 7 7 3 14 7 90 107 75 110 5
Va. 19 16 50 43 62 39 185 338 220 234 538
W. Va. N N 7 11 - 5 3 9 45 50 76
N.C. 13 9 31 62 16 25 577 818 335 396 738
S.C. 7 5 2 5 16 11 310 305 242 288 155
Ga. - 3 1 1 28 23 425 550 495 510 260
Fla. 28 34 36 22 62 56 247 308 910 991 225
E.S. CENTRAL 37 43 65 67 29 30 1,382 1,997 974 1,073 239
Ky. 6 6 8 23 8 7 112 119 138 179 27
Tenn. 25 19 37 19 7 13 605 655 349 370 129
Ala. 2 4 8 7 10 3 361 449 331 337 78
Miss. 4 14 12 18 4 7 304 774 156 187 5
W.S. CENTRAL 14 18 63 95 20 41 779 1,443 1,794 1,733 255
Ark. - 1 17 21 5 - 124 196 153 157 27
La. 3 1 3 2 12 7 293 420 183 20 5
Okla. 3 6 13 20 3 - 101 148 136 132 88
Tex. 8 10 30 52 - 34 261 679 1,322 1,424 135
MOUNTAIN 50 36 18 8 61 51 195 124 411 489 164
Mont. 1 1 - - 2 7 - - 7 15 43
Idaho 2 - 3 1 - - 1 4 9 7 -
Wyo. 1 3 4 3 2 7 - 2 2 6 31
Colo. 16 7 5 - 27 20 12 24 68 70 19
N. Mex. 2 2 1 1 8 2 52 7 53 67 12
Ariz. 12 15 2 - 10 6 116 71 201 183 46
Utah 9 3 1 1 3 4 5 2 25 39 5
Nev. 7 5 2 2 9 5 9 14 46 102 8
PACIFIC 41 45 189 86 371 307 203 472 3,081 3,798 243
Wash. 6 6 8 14 19 21 9 8 221 214 -
Oreg. - - 17 18 18 20 9 8 125 134 14
Calif. 34 34 162 53 329 256 183 454 2,545 3,243 206
Alaska - 1 2 - 3 3 1 - 61 59 23
Hawaii 1 4 - 1 2 7 1 2 129 148 -
Guam - 1 - - - - 2 3 13 55 -
P.R. - - - - 5 2 204 178 164 130 58
V.I. - - - - - - - - - - -
Amer. Samoa - - - - - - - - - - -
C.N.M.I. - - - - - - 9 1 2 - -
-------------------------------------------------------------------------------------------------------------------------------------------
N: Not notifiable U: Unavailable -: no reported cases
=======================================================================================================================================================
Return to top. Table_III Note: To print large tables and graphs users may have to change their printer settings to landscape and use a small font size.
TABLE III. (page 1) Provisional cases of selected notifiable diseases preventable by vaccination, United
States, weeks ending October 11, 1997, and October 12, 1996 (41st Week)
Hepatitis (Viral), by type Measles (Rubeola)
H. influenzae, --------------------------------------- ------------------------------------------------------------
invasive A B Indigenous Imported** Total
---------------- ----------------- ----------------- --------------- --------------- ---------------
Cum. Cum. Cum. Cum. Cum. Cum. Cum. Cum. Cum. Cum.
Reporting Area 1997* 1996 1997 1996 1997 1996 1997 1997 1997 1997 1997 1996
-----------------------------------------------------------------------------------------------------------------------------------------------------
UNITED STATES 833 822 21,541 22,090 6,585 7,618 - 63 1 50 113 456
NEW ENGLAND 49 28 504 311 110 170 - 11 - 6 17 16
Maine 5 - 51 17 6 2 - - - 1 1 -
N.H. 7 11 23 12 12 14 - 1 - - 1 -
Vt. 3 1 11 8 5 11 - - - - - 2
Mass. 30 14 191 155 41 63 - 10 - 4 14 12
R.I. 2 2 123 15 14 9 - - - - - -
Conn. 2 - 105 104 32 71 U - U 1 1 2
MID. ATLANTIC 107 170 1,465 1,531 998 1,134 - 14 - 8 22 37
Upstate N.Y. 28 43 250 351 218 274 - 2 - 3 5 11
N.Y. City 27 44 537 471 350 400 - 5 - 2 7 11
N.J. 39 46 220 292 179 224 - 2 - - 2 3
Pa. 13 37 458 417 251 236 - 5 - 3 8 12
E.N. CENTRAL 133 144 2,126 2,008 698 872 - 7 - 3 10 20
Ohio 76 80 262 630 61 103 - - - - - 5
Ind. 14 10 236 256 78 111 - - - - - -
Ill. 29 40 492 603 175 283 - 6 - 1 7 3
Mich. 13 8 1,017 348 346 299 - - - 2 2 3
Wis. 1 6 119 171 38 76 - 1 - - 1 9
W.N. CENTRAL 41 37 1,756 1,933 356 404 - 12 - 5 17 22
Minn. 27 23 156 108 32 50 - 3 - 5 8 18
Iowa 6 4 383 289 36 56 - - - - - -
Mo. 4 7 880 980 246 235 - 1 - - 1 3
N. Dak. - - 10 100 4 2 - - - - - -
S. Dak. 2 1 19 41 1 5 - 8 - - 8 -
Nebr. 1 1 80 114 12 29 - - - - - -
Kans. 1 1 228 301 25 27 - - - - - 1
S. ATLANTIC 135 149 1,519 1,077 1,014 1,031 - 1 - 10 11 11
Del. - 2 26 15 5 8 - - - - - 1
Md. 48 53 186 187 149 132 - - - 2 2 2
D.C. - 5 17 35 27 29 - - - 1 1 -
Va. 12 8 182 136 102 113 - - - 1 1 3
W. Va. 3 7 10 13 14 21 - - - - - -
N.C. 20 22 162 136 202 266 - - - 2 2 2
S.C. 4 4 92 44 85 72 - - - 1 1 -
Ga. 26 32 391 148 108 30 - - - 1 1 2
Fla. 22 16 453 363 322 360 - 1 - 2 3 1
E.S. CENTRAL 42 23 474 1,053 524 685 - - - - - 2
Ky. 5 5 64 43 32 64 - - - - - -
Tenn. 25 9 295 678 346 381 - - - - - 2
Ala. 12 8 71 153 59 58 - - - - - -
Miss. - 1 44 179 87 182 - - - - - -
W.S. CENTRAL 42 34 4,317 4,352 751 944 - 3 1 5 8 26
Ark. 1 - 197 362 43 69 - - - - - -
La. 11 3 195 158 124 120 - - - - - -
Okla. 27 27 1,216 1,877 37 24 - - 1 1 1 -
Tex. 3 4 2,709 1,955 547 731 - 3 - 4 7 26
MOUNTAIN 81 43 3,579 3,536 738 918 - 6 - 2 8 156
Mont. - 1 66 97 8 13 - - - - - -
Idaho 1 1 113 178 33 77 - - - - - 1
Wyo. 4 - 32 29 29 35 - - - - - 1
Colo. 12 12 337 367 133 111 - - - - - 7
N. Mex. 8 9 310 315 219 328 - - - - - 16
Ariz. 30 13 1,876 1,380 173 205 - 5 - - 5 8
Utah 3 7 491 825 79 80 - - - 1 1 118
Nev. 23 - 354 345 64 69 - 1 - 1 2 5
PACIFIC 203 194 5,801 6,289 1,396 1,460 - 9 - 11 20 166
Wash. 5 3 486 448 56 76 - 1 - 1 2 38
Oreg. 29 25 310 734 87 88 - - - - - 13
Calif. 156 158 4,868 5,003 1,227 1,273 - 6 - 8 14 40
Alaska 6 6 26 39 18 11 - - - - - 63
Hawaii 7 2 111 65 8 12 - 2 - 2 4 12
Guam - - - 7 1 1 U - U - - -
P.R. - 2 231 179 1,142 742 - - - - - 2
V.I. - - - 30 - 30 U - U - - -
Amer. Samoa - - - - - - U - U - - -
C.N.M.I. 6 10 1 1 34 5 U 1 U - 1 -
-----------------------------------------------------------------------------------------------------------------------------------------------------
N: Not notifiable U: Unavailable -: no reported cases
* Of 189 cases among children aged <5 years, serotype was reported for 100 and of those, 39 were type b.
** For imported measles, cases include only those resulting from importation from other countries.
=======================================================================================================================================================
TABLE III. (page 2) Provisional cases of selected notifiable diseases preventable by vaccination, United
States, weeks ending October 11, 1997, and October 12, 1996 (41st Week)
Meningococcal
Disease Mumps Pertussis Rubella
----------------- -------------------------- --------------------------- ---------------------------
Cum. Cum. Cum. Cum. Cum. Cum. Cum. Cum.
Reporting Area 1997 1996 1997 1997 1996 1997 1997 1996 1997 1997 1996
------------------------------------------------------------------------------------------------------------------------------------------
UNITED STATES 2,563 2,500 8 449 563 41 3,945 4,630 2 155 218
NEW ENGLAND 164 108 - 8 1 12 713 1,018 - 1 26
Maine 17 10 - - - - 6 35 - - -
N.H. 14 5 - - - 5 103 96 - - -
Vt. 4 3 - - - 1 196 96 - - 2
Mass. 79 42 - 2 1 6 373 734 - 1 20
R.I. 17 13 - 5 - - 16 30 - - -
Conn. 33 35 U 1 - U 19 27 U - 4
MID. ATLANTIC 241 266 - 43 76 - 275 386 - 29 12
Upstate N.Y. 55 69 - 7 21 - 96 210 - 2 4
N.Y. City 40 38 - 3 18 - 56 36 - 27 5
N.J. 55 55 - 5 4 - 9 28 - - 2
Pa. 91 104 - 28 33 - 114 112 - - 1
E.N. CENTRAL 375 361 5 52 108 3 342 560 - 5 3
Ohio 141 128 4 24 39 2 128 191 - - -
Ind. 44 51 1 8 7 - 45 52 - - -
Ill. 119 101 - 9 20 - 61 140 - 2 1
Mich. 43 38 - 11 40 1 43 34 - - 2
Wis. 28 43 - - 2 - 65 143 - 3 -
W.N. CENTRAL 185 194 - 14 16 2 333 316 - - -
Minn. 29 25 - 5 5 - 210 243 - - -
Iowa 40 40 - 7 1 1 46 16 - - -
Mo. 83 74 - - 7 1 52 32 - - -
N. Dak. 2 3 - - 2 - 2 1 - - -
S. Dak. 5 10 - - - - 4 4 - - -
Nebr. 8 18 - 2 - - 6 7 - - -
Kans. 18 24 - - 1 - 13 13 - - -
S. ATLANTIC 460 394 2 61 91 3 378 480 2 83 91
Del. 5 2 - - - - 1 21 - - -
Md. 40 52 - 4 31 1 107 175 - 1 -
D.C. - 5 - - - - 3 1 - 1 1
Va. 44 48 - 10 12 - 42 73 - 1 2
W. Va. 15 13 - - - - 6 2 - - -
N.C. 80 65 - 9 19 1 105 76 2 59 77
S.C. 51 48 - 10 5 - 24 36 - 19 1
Ga. 91 114 - 8 3 - 11 19 - - -
Fla. 134 47 2 20 21 1 79 77 - 2 10
E.S. CENTRAL 203 187 1 22 20 2 100 183 - - 2
Ky. 42 25 - 3 - - 36 136 - - -
Tenn. 76 51 - 5 1 - 33 19 - - -
Ala. 67 65 1 8 4 2 23 19 - - 2
Miss. 18 46 - 6 15 - 8 9 - - N
W.S. CENTRAL 240 272 - 45 39 1 164 116 - 4 8
Ark. 30 30 - 1 1 - 25 5 - - -
La. 46 49 - 12 13 1 18 8 - - 1
Okla. 33 31 - - - - 27 8 - - -
Tex. 131 162 - 32 25 - 94 95 - 4 7
MOUNTAIN 154 150 - 54 22 13 970 407 - 6 6
Mont. 9 7 - - - - 16 29 - - -
Idaho 10 22 - 3 - - 546 100 - 1 2
Wyo. 2 3 - 1 - - 7 5 - - -
Colo. 42 31 - 3 4 6 253 146 - - 2
N. Mex. 23 22 N N N 7 83 51 - - -
Ariz. 41 34 - 32 1 - 33 28 - 5 1
Utah 12 15 - 8 3 - 16 18 - - -
Nev. 15 16 - 7 14 - 16 30 - - 1
PACIFIC 541 568 - 150 190 5 670 1,164 - 27 70
Wash. 67 80 - 14 20 5 306 501 - 5 15
Oreg. 104 101 N N N - 17 55 - - 1
Calif. 361 375 - 111 140 - 321 573 - 14 51
Alaska 2 8 - 4 2 - 14 3 - - -
Hawaii 7 4 - 21 28 - 12 32 - 8 3
Guam 1 4 U 1 8 U - - U - -
P.R. 10 11 - 7 1 - 1 2 - - -
V.I. - - U - 1 U - - U - -
Amer. Samoa - - U - - U - - U - -
C.N.M.I. - - U 4 - U - - U - -
------------------------------------------------------------------------------------------------------------------------------------------
N: Not notifiable U: Unavailable -: no reported cases
=======================================================================================================================================================
Return to top. Table_IV Note: To print large tables and graphs users may have to change their printer settings to landscape and use a small font size.
TABLE IV. Deaths in 122 U.S. cities,* week ending
October 11, 1997 (41st Week)
===================================================================================================================================
All Causes, By Age (Years)
------------------------------------------------------------------------ P&I**
Reporting Area All Ages >=65 45-64 25-44 1-24 <1 Total
---------------------------------------------------------------------------------------------------------------
NEW ENGLAND 487 374 60 34 14 5 49
Boston, Mass. 113 80 17 10 5 1 10
Bridgeport, Conn. 40 31 4 3 2 - 6
Cambridge, Mass. 19 18 1 - - - 3
Fall River, Mass. 26 20 4 1 - 1 1
Hartford, Conn. U U U U U U U
Lowell, Mass. 24 21 2 1 - - 3
Lynn, Mass. 17 12 4 1 - - -
New Bedford, Mass. 27 23 2 1 1 - 3
New Haven, Conn. 35 25 5 4 1 - 2
Providence, R.I. 37 28 4 1 3 1 4
Somerville, Mass. 8 5 2 1 - - -
Springfield, Mass. 56 42 7 4 1 2 2
Waterbury, Conn. 25 18 2 5 - - 2
Worcester, Mass. 60 51 6 2 1 - 13
MID. ATLANTIC 2,333 1,612 446 188 47 40 105
Albany, N.Y. 43 28 12 2 1 - 1
Allentown, Pa. 24 20 4 - - - -
Buffalo, N.Y. 69 52 9 4 2 2 2
Camden, N.J. 33 24 4 1 3 1 -
Elizabeth, N.J. 19 15 3 - 1 - -
Erie, Pa. 43 36 - 6 1 - -
Jersey City, N.J. 45 26 11 4 2 2 1
New York City, N.Y. 1,125 771 231 91 14 18 38
Newark, N.J. 60 20 15 18 5 2 3
Paterson, N.J. 15 8 3 4 - - -
Philadelphia, Pa. 400 270 79 34 14 3 26
Pittsburgh, Pa.*** 65 47 9 5 - 4 6
Reading, Pa. 44 33 8 3 - - 8
Rochester, N.Y. 132 96 22 7 1 6 14
Schenectady, N.Y. 15 14 1 - - - -
Scranton, Pa. 37 31 5 - 1 - -
Syracuse, N.Y. 98 73 20 3 1 1 3
Trenton, N.J. 16 13 1 1 - 1 -
Utica, N.Y. 20 15 5 - - - 1
Yonkers, N.Y. 30 20 4 5 1 - 2
E.N. CENTRAL 1,944 1,329 365 157 38 54 104
Akron, Ohio 41 36 3 2 - - 2
Canton, Ohio 47 38 8 - - 1 3
Chicago, Ill. 413 248 94 51 10 10 23
Cincinnati, Ohio 68 45 15 3 2 3 8
Cleveland, Ohio 130 87 23 14 3 3 3
Columbus, Ohio 181 136 30 7 1 7 13
Dayton, Ohio 144 103 26 9 2 4 11
Detroit, Mich. 197 110 47 27 6 6 6
Evansville, Ind. 47 38 6 2 1 - 3
Fort Wayne, Ind. 7 7 - - - - 1
Gary, Ind. 16 9 2 2 3 - -
Grand Rapids, Mich. 66 45 11 3 2 5 5
Indianapolis, Ind. 167 103 38 13 3 10 10
Lansing, Mich. 37 26 6 5 - - 1
Milwaukee, Wis. 109 80 17 8 1 3 6
Peoria, Ill. 40 28 8 4 - - 1
Rockford, Ill. 31 23 5 1 2 - 4
South Bend, Ind. 54 46 4 3 - 1 -
Toledo, Ohio 93 72 18 2 1 - 2
Youngstown, Ohio 56 49 4 1 1 1 2
W.N. CENTRAL 743 506 128 56 20 21 32
Des Moines, Iowa 48 33 5 4 2 4 3
Duluth, Minn. 22 18 2 - 1 1 6
Kansas City, Kans. 24 13 6 4 1 - -
Kansas City, Mo. 97 53 19 8 2 3 2
Lincoln, Nebr. 32 20 8 4 - - 1
Minneapolis, Minn. 150 110 28 6 5 1 10
Omaha, Nebr. 84 57 15 8 2 2 4
St. Louis, Mo. 111 79 14 9 2 7 -
St. Paul, Minn. 96 73 15 5 2 1 5
Wichita, Kans. 79 50 16 8 3 2 1
S. ATLANTIC 1,251 796 253 137 40 24 54
Atlanta, Ga. 147 80 42 20 5 - -
Baltimore, Md. 178 110 34 29 3 2 8
Charlotte, N.C. 91 53 26 6 3 3 4
Jacksonville, Fla. 115 82 15 14 - 4 1
Miami, Fla. 117 73 21 13 8 1 2
Norfolk, Va. 46 27 7 8 3 1 4
Richmond, Va. 78 59 8 8 3 - 6
Savannah, Ga. 43 26 14 1 2 - 5
St. Petersburg, Fla. 41 32 5 3 - 1 5
Tampa, Fla. 179 128 30 14 2 5 15
Washington, D.C. 200 110 51 21 11 7 4
Wilmington, Del. 16 16 - - - - -
E.S. CENTRAL 804 522 164 61 22 34 48
Birmingham, Ala. 164 107 31 11 6 8 11
Chattanooga, Tenn. 65 49 7 9 - - 7
Knoxville, Tenn. 62 44 10 2 4 2 1
Lexington, Ky. 64 44 16 2 - 2 10
Memphis, Tenn. 187 111 42 15 5 14 9
Mobile, Ala. 70 44 13 4 5 4 1
Montgomery, Ala. 46 32 10 4 - - 4
Nashville, Tenn. 146 91 35 14 2 4 5
W.S. CENTRAL 1,260 785 265 126 57 27 80
Austin, Tex. 58 35 11 10 2 - 2
Baton Rouge, La. 38 25 10 2 1 - 2
Corpus Christi, Tex. 36 26 8 2 - - 4
Dallas, Tex. 165 98 24 23 11 9 4
El Paso, Tex. 65 40 13 6 4 2 6
Ft. Worth, Tex. 116 77 26 8 2 3 6
Houston, Tex. 377 209 88 50 24 6 34
Little Rock, Ark. 62 30 18 8 4 2 1
New Orleans, La. U U U U U U U
San Antonio, Tex. 189 140 38 8 1 2 13
Shreveport, La. 64 46 13 3 2 - 1
Tulsa, Okla. 90 59 16 6 6 3 7
MOUNTAIN 891 635 152 51 26 27 56
Albuquerque, N.M. 103 70 19 8 5 1 2
Boise, Idaho 40 28 10 - 2 - -
Colo. Springs, Colo. 68 53 7 1 3 4 7
Denver, Colo. 105 69 21 7 3 5 10
Las Vegas, Nev. 144 98 33 8 4 1 9
Ogden, Utah 18 13 3 2 - - 1
Phoenix, Ariz. 162 115 25 12 5 5 9
Pueblo, Colo. 29 23 4 2 - - -
Salt Lake City, Utah 98 68 12 8 3 7 7
Tucson, Ariz. 124 98 18 3 1 4 11
PACIFIC 950 688 155 71 19 17 82
Berkeley, Calif. 25 20 2 2 - 1 1
Fresno, Calif. 53 43 4 4 - 2 6
Glendale, Calif. U U U U U U U
Honolulu, Hawaii 82 57 16 7 - 2 3
Long Beach, Calif. 64 46 12 4 1 1 12
Los Angeles, Calif. U U U U U U U
Pasadena, Calif. 19 17 1 1 - - 5
Portland, Oreg. U U U U U U U
Sacramento, Calif. U U U U U U U
San Diego, Calif. 190 137 31 16 3 3 21
San Francisco, Calif. 82 57 13 11 - 1 10
San Jose, Calif. 162 117 29 11 4 1 14
Santa Cruz, Calif. U U U U U U U
Seattle, Wash. 135 95 25 7 6 2 1
Spokane, Wash. 47 33 9 3 - 2 2
Tacoma, Wash. 91 66 13 5 5 2 7
TOTAL 10,663**** 7,247 1,988 881 283 249 610
---------------------------------------------------------------------------------------------------------------
U: Unavailable -: no reported cases
* Mortality data in this table are voluntarily reported from 122 cities in the United States, most of which have populations
of 100,000 or more. A death is reported by the place of its occurrence and by the week that the death certificate was
filed. Fetal deaths are not included.
** Pneumonia and influenza.
*** Because of changes in reporting methods in these 3 Pennsylvania cities, these numbers are partial counts for the current
week. Complete counts will be available in 4 to 6 weeks.
**** Total includes unknown ages.
===================================================================================================================================
Return to top. Disclaimer All MMWR HTML versions of articles are electronic conversions from ASCII text into HTML. This conversion may have resulted in character translation or format errors in the HTML version. Users should not rely on this HTML document, but are referred to the electronic PDF version and/or the original MMWR paper copy for the official text, figures, and tables. An original paper copy of this issue can be obtained from the Superintendent of Documents, U.S. Government Printing Office (GPO), Washington, DC 20402-9371; telephone: (202) 512-1800. Contact GPO for current prices. **Questions or messages regarding errors in formatting should be addressed to mmwrq@cdc.gov.Page converted: 09/19/98 |
|||||||||
This page last reviewed 5/2/01
|