 |
|
|
|
|
|
|
| ||||||||||
|
|
|
|
|
|
|
||||
| ||||||||||
|
|
|
|
|
Persons using assistive technology might not be able to fully access information in this file. For assistance, please send e-mail to: mmwrq@cdc.gov. Type 508 Accommodation and the title of the report in the subject line of e-mail. Update: Trends in AIDS Incidence -- United States, 1996Provisional surveillance data about acquired immunodeficiency syndrome (AIDS) for the first 6 months of 1996 indicated a decrease in deaths among persons with AIDS, attributed primarily to the effect of antiretroviral therapies on the survival of persons infected with human immunodeficiency virus (HIV) (1). This report describes a decline in AIDS incidence during 1996 compared with 1995 and the continued decline in AIDS deaths; the findings indicate that HIV therapies are having a widespread beneficial impact on the rate of HIV disease progression in the United States. * Cumulative AIDS cases among persons aged greater than or equal to 13 years reported to CDC through June 1997 from the 50 states, the District of Columbia, and the U.S. territories were analyzed by sex, age, race/ethnicity, and mode of risk/exposure ** (2). Estimates of AIDS incidence and deaths were adjusted for delays in reporting. For analyses by risk/exposure, estimates were adjusted for the anticipated reclassification of cases initially reported without an HIV risk/exposure (2). To adjust for the 1993 expansion of the AIDS reporting criteria ***, estimates of the incidence of AIDS-opportunistic illnesses (AIDS-OIs) were calculated from the sum of cases reported with an AIDS-OI and cases with estimated dates of diagnosis of an AIDS-OI that were reported based only on immunologic criteria (2). AIDS-OI incidence was estimated quarterly through December 1996 (the most recent period for which reliable estimates were available). Deaths among persons with AIDS were identified by review of medical records and death certificates and represent both deaths from HIV-related and other causes. AIDS prevalence was estimated as the cumulative incidence of AIDS based on the 1993 expanded AIDS case criteria minus cumulative deaths. Populations with less than 500 estimated cases were excluded because the estimates of annual percentage change from 1995 to 1996 in AIDS-OI incidence, deaths, and prevalence are not reliable. AIDS-OI Incidence During 1996, AIDS-OIs were diagnosed in an estimated 56,730 persons, a decline of 6% compared with 1995 (Figure_1). This represents the first calendar year during which AIDS-OI incidence overall did not increase in the United States. From 1995 to 1996, AIDS-OI incidence declined in all four geographic regions of the United States (West {12%}, Midwest {10%}, Northeast {8%}, and South {1%}) ****. AIDS-OI incidence decreased in all 5-year age groups; men; non-Hispanic whites and Hispanics; men who have sex with men (MSM); injecting-drug users (IDUs); and men who reported both of these exposures (MSM-IDUs) (Table_1). The largest proportionate declines occurred among non-Hispanic white MSM (Figure_2) and non-Hispanic white and black MSM-IDUs (Table_2). AIDS-OI incidence leveled among non-Hispanic blacks. The greatest proportionate increases in AIDS-OI incidence occurred among non-Hispanic black men (19%), Hispanic men (13%), and non-Hispanic black women (12%) who had heterosexual risk/exposures (Table_2). From 1995 to 1996, annual AIDS incidence changed abruptly compared with the magnitude and direction of the average annual changes in AIDS-OI incidence during 1992-1995. During these years, AIDS-OI incidence increased but was characterized by a slowing in the growth of the epidemic overall (average annual change from 1992 to 1995 was 2%) (1,2). The magnitude and/or the direction of the average annual change in AIDS-OI incidence from 1992 to 1995 was substantially different from the change from 1995 to 1996 among men (1% versus -8%) and women (10% versus 2%); whites (-2% versus -13%), non-Hispanic blacks (7% versus 0), and Hispanics (4% versus -5%); MSM (-1% versus -11%), men and women IDUs (3% versus -6% and 5% versus -4% , respectively), and MSM-IDUs (-3% versus -15%). Deaths Among Persons Reported with AIDS Deaths among persons reported with AIDS declined 23% in 1996 compared with 1995, with the largest declines occurring during the last three quarters of 1996 (Figure_1). From 1995 to 1996, deaths declined in all four geographic regions (West {33%}, Midwest {25%}, Northeast {22%}, and South {19%}); among men and women; among all racial/ethnic groups; and in all risk/exposure categories (Table_1). AIDS Prevalence Approximately 235,470 persons in whom AIDS has been diagnosed are still living, and from 1995 to 1996, the prevalence of AIDS increased 11% (Table_3). MSM accounted for the largest proportion (48%) of persons with AIDS, and the largest proportionate increases in prevalence occurred among men and women who acquired AIDS through heterosexual contact (28% and 23%, respectively), the only risk/exposure category that experienced increases in AIDS-OI incidence. Reported by: State and local health depts. Div of HIV/AIDS Prevention-Surveillance and Epidemiology, National Center for HIV, STD, and TB Prevention, CDC. Editorial NoteEditorial Note: The findings in this report document the first overall decline in the annual incidence of AIDS-OIs in the United States. Concurrently, annual deaths among persons aged greater than or equal to 13 years reported with AIDS also have decreased. Temporal trends in AIDS cases and deaths are the result of changes in the rate of new HIV infections, AIDS diagnoses resulting from progression of HIV disease to AIDS, and deaths of HIV- infected persons. The declines in AIDS-OI incidence and deaths reflect the impact of both HIV prevention efforts and the use of antiretroviral therapies and AIDS-OI prophylaxis. During 1996, AIDS-OI incidence declined for almost all populations and in all regions of the country, and deaths declined substantially (23%) compared with 1995. The actual decline in AIDS-OI incidence is probably greater than the estimates in this report because there are insufficient longitudinal clinical data to model the impact of the newly available antiretroviral therapies on AIDS-OI incidence. However, the 1996 AIDS surveillance data are consistent with reports that recent improvements in HIV care are preventing or delaying the onset of AIDS-OI and deaths among many populations of HIV-infected persons (3). Recent declines in AIDS incidence also have been reported in several western European countries and have been attributed to widespread use of combination antiretroviral therapies (4). Data from CDC's Adult/Adolescent Spectrum of Disease (ASD) (5) project indicate that an increasing proportion of HIV-infected persons are receiving combination antiretroviral therapy. Among HIV-infected persons observed in clinical care in ASD during 1995-1996, the prescribed use of combination antiretroviral therapy increased from 24% of 5027 persons in the second half of 1995 to 65% of 2973 persons in the second half of 1996 (CDC, unpublished data, 1997). Use of these therapies is expected to increase because revised HIV treatment guidelines recommend earlier initiation of combination antiretroviral therapy in HIV-infected persons without AIDS-defining conditions (6). Ensuring timely access to HIV-care services for HIV-infected persons remains important because in many persons HIV infection is not diagnosed until AIDS is diagnosed (7). To enable HIV-infected persons to benefit from treatment advances, HIV counseling and testing programs in screening and health-care settings must better facilitate early diagnosis of HIV infection and ensure that HIV-infected persons have access to care and treatment services. Despite the decreases in AIDS-OI incidence and deaths in 1996, AIDS-OI incidence remained high, and HIV infection remained a leading cause of death among persons aged 25-44 years (8). AIDS-OI incidence continued to increase among persons who were infected through heterosexual contact. Until effective vaccines are developed, continued emphasis on behavioral risk-reduction and other prevention strategies targeted to these populations is the most effective way to reduce HIV infections. The 1996 AIDS surveillance trends illustrate how surveillance data are now affected by both patterns of HIV incidence and HIV treatment advances. In comparison, surveillance based on a diagnosis of HIV infection is not affected by changes in the progression of HIV disease. CDC supports both HIV and AIDS surveillance in 30 states. Among these states, the number of prevalent HIV and AIDS cases combined is approximately 2.5 times greater than the number of prevalent AIDS cases alone (1,2). HIV/AIDS surveillance programs in these states provide a more timely measure of emerging patterns of HIV transmission, a more complete estimate of the number of persons with HIV infection and disease, and a better mechanism to evaluate access to HIV testing and medical and prevention services than AIDS surveillance alone (9). Although AIDS surveillance continues to be essential for understanding reasons for the lack of timely access to HIV testing and care and the failure of treatment regimens to delay HIV disease progression, HIV surveillance is becoming increasingly important as more infected persons receive effective antiretroviral therapy. In June 1997, the Council of State and Territorial Epidemiologists (CSTE) recommended that all states implement HIV case reporting by name from health-care providers and laboratories (10). The Association of State and Territorial Health Officers has provisionally endorsed the CSTE recommendation pending a vote of its full membership. CDC recently provided additional resources to state and local surveillance programs that plan to or are conducting HIV case surveillance in addition to AIDS surveillance. All states and territories should conduct HIV case surveillance as an extension of their AIDS Surveillance programs, and CDC is developing HIV surveillance policy and technical guidance to assist all states and territories to conduct HIV/AIDS case surveillance. CDC and CSTE recently convened a consultation ***** to discuss the objectives and methods of conducting HIV/AIDS case surveillance. CDC will continue to foster a collaborative approach among public health authorities, health-care providers, and the community to meet their information needs and to ensure the confidentiality of HIV/AIDS surveillance data. References
* Single copies of this report will be available until September 19, 1998, from the CDC National AIDS Clearinghouse, P.O. Box 6003, Rockville, MD 20849-6003; telephone (800) 458-5231 or (301) 217-0023. ** Categories included persons aged 20-64 years of white, black, or Hispanic race/ethnicity but excluded persons infected through receipt of contaminated blood/blood products and persons with other or no risks reported. *** Conditions in HIV-infected persons that were added to the AIDS case definition in 1993 included laboratory measures of severe immunosuppression (i.e., CD4+ T-lymphocyte count less than 200 cells/uL or percentage of total lymphocytes less than 14) and three clinical conditions: pulmonary tuberculosis, recurrent pneumonia, and invasive cervical cancer. **** Northeast=Connecticut, Maine, Massachusetts, New Hampshire, New Jersey, New York, Pennsylvania, Rhode Island, and Vermont; Midwest=Illinois, Indiana, Iowa, Kansas, Michigan, Minnesota, Missouri, Nebraska, North Dakota, Ohio, South Dakota, and Wisconsin; South=Alabama, Arkansas, Delaware, District of Columbia, Florida, Georgia, Kentucky, Louisiana, Maryland, Mississippi, North Carolina, Oklahoma, South Carolina, Tennessee, Texas, Virginia, and West Virginia; and West=Alaska, Arizona, California, Colorado, Hawaii, Idaho, Montana, Nevada, New Mexico, Oregon, Utah, Washington, and Wyoming. ***** The Consultation on the Future of HIV/AIDS Surveillance was held in Atlanta on May 21-22, 1997, sponsored by CSTE and CDC. Documents presented at the meeting and a meeting transcript can be obtained from the CDC National AIDS Clearinghouse after October 31, 1997. Figure_1 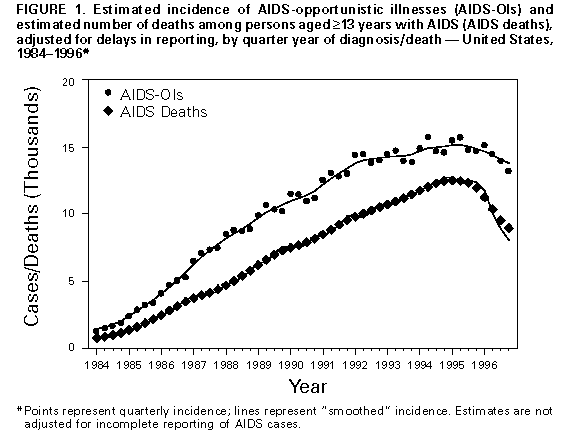 Return to top. Table_1 Note: To print large tables and graphs users may have to change their printer settings to landscape and use a small font size.
TABLE 1. Estimated incidence* of AIDS-opportunistic illnesses (AIDS-OIs) and estimated number of deaths among persons
aged >=13 years reported with AIDS, by sex, race/ethnicity+, exposure category, and percentage change in AIDS-OIs
and deaths from 1995 to 1996 -- United States
==========================================================================================================================
                                         AIDS-OIs                                       Deaths
                         ------------------------------------------   ----------------------------------------------------
                                                    % Change from                                 % Change from
Characteristic           1995  No.   1996  No.    from 1995 to 1996   1995  No.    1996  No.    from 1995 to 1996
--------------------------------------------------------------------------------------------------------------------------
Sex
  Men                       49,360      45,240                  - 8      42,000       31,440                  -25
  Women                     11,260      11,490                    2       8,140        7,340                  -10
Race/Ethnicity
  White,non-Hispanic        24,370      21,130                  -13      21,700       14,670                  -32
  Black,non-Hispanic        24,090      24,030                    0      18,840       16,460                  -13
  Hispanic                  11,410      10,800                  - 5       9,010        7,220                  -20
Exposure category
  MSM&                      28,640      25,530                  -11      24,880       17,310                  -30
  MSM-IDU@                   3,580       3,030                  -15       3,310        2,490                  -25
  Male-IDU                  12,880      12,140                  - 6      10,790        8,970                  -17
  Female-IDU                 4,950       4,750                  - 4       3,830        3,440                  -10
  Heterosexual contact
    Male                     3,420       3,790                   11       2,300        2,120                  - 8
    Female                   5,900       6,320                    7       3,980        3,640                  - 8
Total**                     60,620      56,730                  - 6      50,140       38,780                  -23
--------------------------------------------------------------------------------------------------------------------------
*  Estimates are presented rounded to the nearest 10 because they do not represent exact counts of persons with
   AIDS-OIs but are estimates that are approximately +/-13% of the trye value.
+  Numbers for races other than black and white were too small for meaningful analysis. Persons of hispanic origin
   may be of any race.
&  Men who have sex with men.
@  Injecting-drug user.
** Includes persons aged >=13 years with hemophilia/coagulation disorders, transfusion recipients, or with
   othger or no riskes reported.
==========================================================================================================================
Return to top. Figure_2 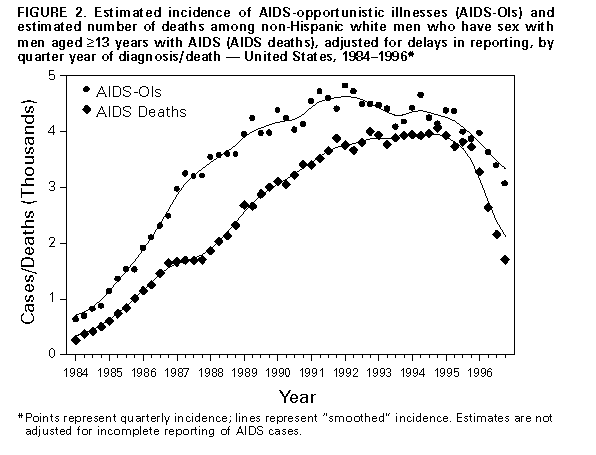 Return to top. Table_2 Note: To print large tables and graphs users may have to change their printer settings to landscape and use a small font size.
TABLE 2. Estimated incidence* of AIDS-opportunistic illnesses (AIDS-OIs) among persons aged >=13 years, by race/ethnicity+, sex, and exposure
category, and percentage change from 1995 to 1996 -- United States
==============================================================================================================================================
                                     White,non-Hispanic                        Black,non-Hispanic                         Hispanic
                          -------------------------------------        ------------------------------------     -----------------------------
                                                  % Change from                              % Change from                     % Change from
Exposure category          1995            1996    1995 to 1996        1995            1996   1995 to 1996       1995    1996   1995 to 1996
----------------------------------------------------------------------------------------------------------------------------------------------
Men
  MSM&                    16,600         14,060         -15            7,330          7,110      - 3            4,250   3,900        - 8
  IDU@                     2,470          2,280         - 8            6,840          6,540      - 4            3,470   3,240        - 7
  MSM-IDU                  1,690          1,410         -17            1,290          1,120      -13               **      **         **
  Heterosexual               640            620         - 2++          1,970          2,340       19              780     880         13
Women
  IDU                      1,090          1,030         - 5++          2,920          2,860      - 2              900     820        - 9
  Heterosexual             1,270          1,220         - 4            3,300          3,700       12            1,270   1,330          5
----------------------------------------------------------------------------------------------------------------------------------------------
*  Estimates are presented rounded to the nearest 10 because they do not represent exact counts of persons with AIDS-OIs but are estimates
   that are approximately +/1 3% of the true value.
+  Numbers for races other than black and white were too small for meaningful analysis. Persons of Hispanic origin may be of any race.
&  Men who have sex with men.
@  Injecting-drug user.
** Excluded because estimates were <500.
++ The annual percentage changes were calculated from modeled point estimates before rounding.
==============================================================================================================================================
Return to top. Table_3 Note: To print large tables and graphs users may have to change their printer settings to landscape and use a small font size.
TABLE 3. Estimated prevalence* of AIDS among persons aged >=13 years, by sex and exposure
 category, and percentage change from 1995 to 1996 -- United States
===========================================================================================
                           1995              1996
                     ---------------   --------------
Exposure category        No.     (%)       No.     (%)   % Change from 1995 to 1996
-------------------------------------------------------------------------------------------
Men
  MSM+               101,970   ( 48)   111,860   ( 48)               10
  IDU&                43,800   ( 21)    48,000   ( 20)               10
  MSM-IDU             14,170   (  7)    14,660   (  6)                3
  Heterosexual         9,620   (  5)    12,300   (  5)               28
  Total              173,560   ( 82)   191,040   ( 81)               10
Women
  IDU                 17,840   (  8)    19,700   (  8)               10
  Heterosexual        18,610   (  9)    22,860   ( 10)               23
  Total               38,080   ( 18)    44,440   ( 19)               17
Total@               211,650   (100)   235,470   (100)               11
-------------------------------------------------------------------------------------------
* Estimates are presented rounded to the nearest 10 because they do not represent
  exact counts of persons with AIDS-OIs but are estimates that are approximately +/-3%
  of the true value.
+ Men who have sex with men.
& Injecting-drug users.
@ Includes persons aged >=13 years with hemophilia/coagulation disorders, transfusion
  recipients, or with other or no risks reported. The sum of the estimates for men
  and women may not equal total annual estimates because of rounding.
===========================================================================================
Return to top. Disclaimer All MMWR HTML versions of articles are electronic conversions from ASCII text into HTML. This conversion may have resulted in character translation or format errors in the HTML version. Users should not rely on this HTML document, but are referred to the electronic PDF version and/or the original MMWR paper copy for the official text, figures, and tables. An original paper copy of this issue can be obtained from the Superintendent of Documents, U.S. Government Printing Office (GPO), Washington, DC 20402-9371; telephone: (202) 512-1800. Contact GPO for current prices. **Questions or messages regarding errors in formatting should be addressed to mmwrq@cdc.gov.Page converted: 09/19/98 |
|||||||||
This page last reviewed 5/2/01
|