 |
|
|
|
|
|
|
| ||||||||||
|
|
|
|
|
|
|
||||
| ||||||||||
|
|
|
|
|
Persons using assistive technology might not be able to fully access information in this file. For assistance, please send e-mail to: mmwrq@cdc.gov. Type 508 Accommodation and the title of the report in the subject line of e-mail. Hysterectomy Surveillance -- United States. 1980-1993Hysterectomy Surveillance -- United States, 1980-1993 Lisa A. Lepine, M.D., (1) Susan D. Hillis, Ph.D., M.S.N.,(1) Polly A. Marchbanks, Ph.D.,(1) Lisa M. Koonin, M.N., M.P.H.,(1) Brian Morrow, M.A.,2 Burney A. Kieke, M.S.,(1) Lynne S. Wilcox, M.D., M.P.H.(1) 1 Division of Reproductive Health National Center for Chronic Disease Prevention and Health Promotion Centers for Disease Control and Prevention 2 Klemm Analysis Group, Atlanta, Georgia Abstract Problem/Condition: In the United States, approximately 600,000 hysterectomies are performed each year, and the procedure is the second most frequently performed major surgical procedure among reproductive-aged women. Reporting Period Covered: 1980-1993. Description of System: This surveillance system uses data obtained from CDC's National Hospital Discharge Survey (NHDS) to describe the epidemiology of hysterectomy. The NHDS is an annual probability sample of discharges from non-Federal, short-stay hospitals in the United States. Results: In the United States during 1980-1993, an estimated 8.6 million women aged greater than or equal to 15 years had a hysterectomy. The overall rate of hysterectomy declined slightly from 1980 (7.1 hysterectomies per 1,000 women) to 1987 (6.6 per 1,000 women). The rede-sign of the NHDS in 1988 resulted in a decrease in estimated rates (i.e., the average annual rate for 1988-1993 was 5.5 per 1,000 women). Rates differed by age, with women aged 40-44 years most likely to have this procedure. Overall annual rates of hysterectomy did not differ significantly by race. The diagnosis most often associated with hysterectomy was uterine leiomyoma; during 1988-1993, this diagnosis accounted for 62% of hysterectomies among black women, 29% among white women, and 45% among women of other races. During 1988-1993, the percentage of hysterectomies performed by the vaginal route increased significantly; furthermore, an increasingly higher percentage of vaginal hysterectomies were accompanied by bilateral oophorectomy. From 1991 through 1993, laparoscopy was associated more frequently with vaginal hysterectomy than in previous years. Interpretation: The rate of hysterectomy decreased slightly during the first half of the 14-year surveillance period, then leveled off during the second half. The increase in simultaneous coding of laparoscopy and vaginal hysterectomy on hospital discharge forms probably reflected the growing use of laparoscopically assisted vaginal hysterectomy. Actions Taken: Continued surveillance for hysterectomy will enable changes in clinical practice (e.g., the use of LAVH) to be identified, and information derived from the surveillance system may assist in directing biomedical assessment priorities (e.g., to determine the reasons for race-specific differences in the prevalence of uterine leiomyoma). INTRODUCTION Approximately 600,000 hysterectomies are performed each year in the United States; the estimated overall annual cost of these procedures is greater than $5 billion (1). Hysterectomy is the second most frequently performed major surgical procedure among reproductive-aged women in the United States. On the basis of data for 1988-1993, more than one fourth of the female U.S. population will undergo this procedure by the time they are 60 years of age. Since 1970, CDC has conducted epidemiologic surveillance of hysterectomies performed on reproductive-aged women (2-7). This report provides an analysis of hysterectomy rates by age, race, surgical approach, and geographic region for 1980-1993 and, for 1988-1993, a detailed analysis of both the indications for the procedure and concomitant laparoscopy. METHODS Information regarding hysterectomy was collected by CDC's National Center for Health Statistics (NCHS) as part of the ongoing National Hospital Discharge Survey (NHDS), which is an annual probability sample of discharges from non-Federal, short-stay hospitals in the United States. In 1988, the NHDS was redesigned: a new sample of hospitals was selected, and several data collection and estimation procedures were revised (8). These changes enabled comparisons to be made between NHDS and other NCHS surveys and facilitated the use of automated abstracting systems. The modifications, however, resulted in a downward shift in the estimated numbers and rates of hysterectomies, and trends during the entire 14-year surveillance period could not be examined. For this reason, data for 1980-1987 and 1988-1993 were evaluated separately. Trends were analyzed by using the weighted least squares regression method, with the inverses of the variances of each annual estimate as the weights (9). The population estimates of the female civilian residents of the United States that were used to compute rates for this report were obtained from the U.S. Bureau of the Census. Standard errors for rates were estimated by using the NCHS generalized variance curves for 1980-1987 and SUDAAN software for complex sample surveys for 1988-1993 (10). Age Most hysterectomies are performed on reproductive-aged women, and previously published CDC surveillance summaries concerning hysterectomy reported data for women aged 15-44 years. In comparison with previous years, a larger proportion of the U.S. population is composed of women aged greater than 44 years; because of this difference, this report includes data for all women aged greater than or equal to 15 years. The following age categories were used to analyze data by age of women at the time the procedure was performed: 15-24, 25-29, 30-34, 35-39, 40-44, 45-54, and greater than or equal to 55 years. Both the youngest and oldest age groups comprised at least 10 years so that numbers would be large enough to produce stable estimates. Race Race was self-reported by women as either white, black, or "other." This latter category included women who were Asian, Pacific Islander, American Indian, Alaskan Native, and other races. For women whose race was unknown, data were categorized on the basis of the distribution of discharged women whose race was known. Geographic Region Data were categorized by the following geographic regions as defined by the U.S. Bureau of the Census: Northeast (Connecticut, Maine, Massachusetts, New Hampshire, New Jersey, New York, Pennsylvania, Rhode Island, and Vermont); Midwest (Illinois, Indiana, Iowa, Kansas, Michigan, Minnesota, Missouri, Nebraska, North Dakota, Ohio, South Dakota, and Wisconsin); South (Alabama, Arkansas, Delaware, District of Columbia, Florida, Georgia, Kentucky, Louisiana, Maryland, Mississippi, North Carolina, Oklahoma, South Carolina, Tennessee, Texas, Virginia, and West Virginia); and West (Alaska, Arizona, California, Colorado, Hawaii, Idaho, Montana, Nevada, New Mexico, Oregon, Utah, Washington, and Wyoming). Surgical Approach The two categories of surgical approach were abdominal and vaginal hysterectomies. Diagnosis Only simple hysterectomy (International Classification of Diseases, Ninth Revision, Clinical Modification {ICD-9-CM} procedure code of 68.3, 68.4, or 68.5) was evaluated in this report. Radical hysterectomy and pelvic evisceration performed to treat women who had advanced pelvic cancer were excluded. The ICD-9-CM procedure codes 65.5 or 65.6 indicated concomitant bilateral oophorectomy; the procedure code 54.21 indicated a laparoscopy was performed. To determine the indications for hysterectomy, a maximum of seven diagnostic and four procedural codes collected from the hospital discharge form for each patient were reviewed (7,11). The primary diagnosis was assigned using the following hierarchy. First, if cancer of the reproductive tract was listed as one of the diagnoses, it was assigned as the primary indication for hysterectomy. Second, if both hysterectomy and the debulking of cancer of the urinary or intestinal tract were listed, the debulking procedure was assigned as the primary indication. Third, if a precancerous condition (e.g., endometrial hyperplasia or carcinoma-in-situ of the cervix) was listed in the absence of a diagnosis of cancer, then the precancerous condition was assigned as the primary diagnosis. Fourth, if cancer or a precancerous condition was not listed, the diagnoses were scanned for one of the three most common indications for hysterectomy (i.e., uterine leiomyoma, endometriosis, or uterine prolapse {11}), and the first of these diagnoses listed was assigned as the primary diagnosis. Fifth, the remaining records were placed in the "other" diagnostic category. RESULTS In the United States during 1980-1993, an estimated 8,588,000 women aged greater than or equal to 15 years underwent a hysterectomy in a non-Federal, short-stay hospital (annual average: 613,000 hysterectomies) (Table_1). During 1980-1987, the average annual rate of hysterectomy was 6.9 per 1,000 women. For 1980, the hysterectomy rate was 7.1 per 1,000 women; by 1987, this rate had decreased to 6.6 per 1,000 women. The redesign of the NHDS in 1988 resulted in a decrease in the estimated rates of hysterectomy. From 1988 through 1993, the average annual rate remained stable at 5.5 hysterectomies per 1,000 women. Overall hysterectomy rates did not differ significantly by race (Figure_1); however, rates substantially differed by age (Table_2). For every year during 1980-1993, the hysterectomy rate was highest for women aged 40-44 years and lowest for women aged 15-24 years (Figure_2). During 1988-1993, the average annual rate of hysterectomy for women aged 40-44 years was 12.9 per 1,000 women (Table_2). In this time period, 55% of all hysterectomies were obtained by women aged 35-49 years, and each year approximately one in 86 women aged 35-49 years underwent a hysterectomy. Hysterectomy rates differed by geographic region (Figure_3), reflecting the same pattern noted since 1970 (i.e., when surveillance for hysterectomy began in the United States). For 1988-1993, hysterectomy rates were lowest for women in the Northeast (average annual rate: 3.9 hysterectomies per 1,000 women) and highest for women in the South (6.8 per 1,000 women). The average annual rates for women in the Midwest and West were 5.5 and 4.9 per 1,000 women, respectively. During 1980-1993, the average age at the time of hysterectomy was 47.7 years in the Northeast; 44.5 years, the Midwest; 44.0 years, the West; and 41.6 years, the South. At the time of hysterectomy, women in the Northeast were significantly older, and women in the South were significantly younger, than those in the other geographic regions. During 1988-1993, the three diagnoses most often associated with hysterectomy were uterine leiomyoma (i.e., "fibroid tumors"), endometriosis, and uterine prolapse (Table_3). The most frequently listed diagnosis, uterine leiomyoma, accounted for 61% of hysterectomies among black women, 29% of hysterectomies among white women, and 45% of hysterectomies among women of other races. Endometriosis and uterine prolapse, the second and third leading diagnoses, were listed more often for white women than for black women or women of other races. The indications for hysterectomy also differed by age (Table_4). For women aged less than 30 years, the most frequently associated diagnoses were menstrual disturbances and cervical dysplasia. For women aged 30-34 years, endometriosis was the most frequently associated diagnosis; for women aged 35-39, 40-44, and 45-54 years, uterine leiomyoma; for women aged greater than or equal to 55 years, uterine prolapse and cancer. Hysterectomy rates were stratified by the three most commonly associated diagnoses (i.e., uterine leiomyoma, endometriosis, and uterine prolapse), by broad age categories (i.e., 15-34 years, 35-44 years, and greater than or equal to 45 years), and by race. The annual rates of hysterectomy associated with endometriosis and uterine prolapse were highest for white women aged 35-44 years (3.5 and 1.8 hysterectomies per 1,000 women, respectively). The annual rate of hysterectomy associated with uterine leiomyoma was highest for black women aged 35-44 years; this rate was 12.1 hysterectomies per 1,000 women -- more than twice the combined rate of both the other diagnoses among white women. From 1988 through 1993, 51% of women who had hysterectomies also underwent bilateral oophorectomy. A statistically significant increase was observed during this time period: during 1988, 47% of hysterectomies were accompanied by bilateral oophorectomy; during 1993, this percentage was 52% (p less than 0.01). The concurrent performance of bilateral oophorectomy was associated with surgical route, diagnosis, and age. Oophorectomy was performed more than three times more frequently when the surgical approach was abdominal in comparison with vaginal: 63% of women who had an abdominal hysterectomy and 18% of those who had a vaginal hysterectomy also had oophorectomy. Approximately two thirds of women who had a hysterectomy for cancer or endometrial hyperplasia had concomitant oophorectomy. Slightly more than half of the women who had a hysterectomy for uterine leiomyoma or endometriosis had bilateral oophorectomy. Only 20% of women who had a hysterectomy for uterine prolapse also had bilateral oophorectomy. Concomitant oophorectomy was associated with age. Approximately 18% of women aged 15-24 years who had a hysterectomy also had bilateral oophorectomy (Figure_4). This proportion tended to increase with each increasingly older age group, peaking at 76% among women aged 45-54 years and then declining to 62% among women aged greater than or equal to 55 years. During 1980-1993, 26% of all hysterectomies were performed vaginally. This route of surgery was used for 28% of hysterectomies performed on white women, 15% on black women, and 23% on women of other races. During 1988-1993, the proportion of hysterectomies performed vaginally increased significantly, primarily reflecting the marked increase in the percentage of vaginal hysterectomies performed on white women (Figure_5). During 1990-1993, 32% of hysterectomies performed on white women were by the vaginal route, compared with 26% during the 1980s. The frequency of bilateral oophorectomy associated with vaginal hysterectomy increased almost threefold from 1988 (9%) to 1993 (26%) (Figure_6). The percentage of abdominal hysterectomies with concomitant bilateral oophorectomy increased only slightly (from 47% in 1988 to 52% in 1993). In addition to increases in the percentage of hysterectomies performed vaginally and the percentage of vaginal hysterectomies with concomitant oophorectomy, the percentage of vaginal hysterectomies associated with laparoscopy also increased. Throughout the 1980s, laparoscopy was coded concomitantly with vaginal hysterectomy in less than 1% of all cases. In 1990, this percentage rose to 1.4%; in 1991, it was 6.3%. In 1992, 15.3% of vaginal hysterectomies were associated with laparoscopy; in 1993, the percentage remained stable at 14.2% (Figure_6). DISCUSSION The available data concerning hysterectomies performed in the United States revealed a slight downward trend in the rate of procedures performed during the first half of this 14-year surveillance period and a leveling off during the second half. Rates of hysterectomy significantly differed by age, with women aged 40-44 years more likely than women in other age groups to have the procedure. The most frequently associated diagnoses were uterine leiomyoma, endometriosis, and uterine prolapse. As noted previously (i.e., for 1988-1990) (7), the indications for hysterectomy differed by race. The rate of hysterectomy for uterine leiomyoma among black women was more than twice that among white women, whereas endometriosis and uterine prolapse were more frequently associated with hysterectomy among white women than among black women. In comparison with previous surveillance periods, a higher percentage of hysterectomies were performed by the vaginal route, and a higher percentage of vaginal hysterectomies were performed with concomitant oophorectomy. Finally, the percentage of vaginal hysterectomies associated with laparoscopy increased over the percentages reported for previous years. The number of hysterectomies performed during 1990-1993 was lower than was estimated previously on the basis of population dynamics; these previous estimates included as a factor the large number of women born after the end of World War II who began, in 1979, entering the age groups most likely to have a hysterectomy. According to these projections, greater than 800,000 hysterectomies would have been performed annually in the United States by 1995 (12). This projected number for 1995 did not occur because a) the rates of hysterectomies declined during the mid- to late-1980s and b) the redesign of the NHDS in 1988 resulted in a downward shift in estimated rates. Data obtained from the NHDS indicate that 574,000 hysterectomies were performed during 1995 (National Center for Health Statistics, unpublished data, 1997). Several other factors also could affect increases in hysterectomy numbers or rates. First, practices related to health-care reform (e.g., quality assurance, peer review, and second opinion programs) have been associated with lower hysterectomy rates (13-16). Second, alternatives to hysterectomy -- including medical treatments and endoscopic procedures (e.g., laser therapies) -- have become increasingly available (17-19). Third, many women in the United States have been opting to delay childbearing (20), and the resultant desire to preserve fertility might be affecting hysterectomy rates. The recent trend in the increased usage of vaginal hysterectomy has paralleled the rise in simultaneous ICD-9-CM coding for laparoscopy and vaginal hysterectomy on hospital discharge forms. Beginning in the late 1980s and increasing substantially in the early 1990s, laparoscopically assisted vaginal hysterectomy (LAVH) became adopted as an alternative to abdominal hysterectomy in selected cases. Because LAVH does not have a unique ICD-9-CM code, the marked rise in simultaneous coding for vaginal hysterectomy and laparoscopy probably represents the increasing use of LAVH, a new and somewhat controversial procedure (21-23). Furthermore, the marked increase in concurrent oophorectomy with vaginal hysterectomy may be a consequence of the improved access to the ovaries afforded by laparoscopy. During 1991-1993, 47% of vaginal hysterectomies associated with laparoscopy were accompanied by bilateral oophorectomy, whereas only 22% of vaginal hysterectomies performed without laparoscopy were accompanied by bilateral oophorectomy. The use of LAVH raises practical issues pertaining to hysterectomy surveillance. First, its use may increase if this method of hysterectomy achieves wider acceptance and application. A unique ICD-9-CM code for this procedure would help monitor trends in its usage. Second, as surgeons become more skilled in LAVH and as demands to contain health-care costs grow, the procedure might be performed more frequently in the ambulatory surgical setting (24). The consequence for hysterectomy surveillance through the NHDS, which is derived exclusively from hospital discharges, will be reporting that is increasingly incomplete. Supplemental surveillance sources need to be identified to enable collection of information regarding hysterectomies performed in ambulatory-care settings. The NHDS provides the only available population-based estimates of surgical rates and is the only instrument by which national surveillance for hysterectomy can be conducted. As such, these surveillance data reflect the influence of factors that affect hysterectomy rates; such factors include changes in the prevalence of gynecologic disorders, introduction of less-invasive treatment modalities, and adoption of utilization review processes. Furthermore, because the results of this surveillance system are based on large sample sizes with relative standard errors of approximately 10%, large differences revealed are unlikely to be due to chance. The NHDS has several important limitations. First, the redesign of the survey in 1988 constrained accurate comparisons of rates before and after that year. Second, the data set did not contain clinical information such as parity, which has been known to influence hysterectomy rates, and the indications for hysterectomy could not be validated because pathology reports and medical records were not available for review. Third, the NHDS requests information regarding the race of patients discharged from the participating hospitals. Such data were analyzed to determine whether hysterectomy rates and the indications for hysterectomy differed depending on this variable. However, the reasons for the race-specific differences in the indications for hysterectomy could not be determined from the available information. In addition, the analyses of data by race was limited by the high proportion of women for whom race was not stated in the NHDS. During 1982-1989, 9%-11% of hospital discharge forms did not provide information regarding the race of the patient. The percentage of such discharges increased to 16% in 1990, 18% in 1991, and 20% in 1992. Because of this lack of information, the data for women whose race was unknown were categorized on the basis of the distribution of discharged women whose race was known. Although this method was based on the assumption that all races were equally underreported, the evidence indicates that hospitals not reporting race might provide medical services to a higher proportion of white persons than would have been imputed based on the distribution of known races (25). Such a redistribution introduces a potential error in the calculation of rates; however, eliminating those discharges would have resulted in an underestimation of rates. Therefore, the analyses involving race should be interpreted cautiously. The results of this surveillance system probably underestimated the actual rates of hysterectomy because women who had already had a hysterectomy were not excluded from the denominators. This retention of the number of women who had previously had a hysterectomy in the denominator probably had the greatest effect on rates for women in the age groups with highest rates of hysterectomy. However, the results of one study in which hysterectomy rates were adjusted for the number of reproductive-aged women who had already had a hysterectomy were consistent with previous CDC surveillance reports in demonstrating the same secular variations in rates (26). The results of this surveillance system for hysterectomy provide information concerning the numbers and rates of hysterectomy in the United States. Analyses of these data enable determination of the relative public health importance of gynecologic conditions for which hysterectomy is performed. Continued surveillance for hysterectomy will enable changes in clinical practice (e.g., the use of LAVH) to be identified, and information derived from the surveillance system may assist in directing biomedical assessment priorities (e.g., to determine the reasons for race-specific differences in the prevalence of uterine leiomyoma). References
Table_1 Note: To print large tables and graphs users may have to change their printer settings to landscape and use a small font size. TABLE 1. Estimated numbers and rates * of hysterectomies, by year + -- United States, 1980-1993 ======================================================================== Year No. Rate Standard error ------------------------------------------------------------------------ 1980 647,004 7.1 0.50 1981 668,922 7.2 0.44 1982 644,850 6.9 0.49 1983 667,302 7.0 0.38 1984 657,144 6.9 0.39 1985 665,463 6.9 0.44 1986 638,556 6.5 0.41 1987 648,013 6.6 0.45 1988 571,204 5.7 0.36 1989 533,620 5.3 0.30 1990 585,605 5.8 0.26 1991 539,906 5.3 0.22 1992 573,943 5.6 0.21 1993 546,683 5.3 0.26 Total 8,588,215 ------------------------------------------------------------------------ * Per 1,000 female, civilian residents aged >=15 years. + Break in lines (after 1987) reflects change in rates resulting from redesign of the National Hospital Discharge Survey; the changes in sampling design precluded comparison of the two time periods (i.e., 1980-1987 and 1988-1993). ======================================================================== Return to top. Figure_1 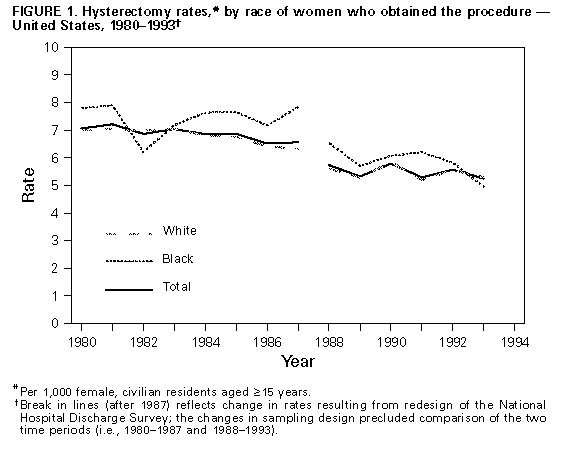 Return to top. Table_2 Note: To print large tables and graphs users may have to change their printer settings to landscape and use a small font size.
TABLE 2. Estimated rates * of hysterectomy, by age and race of women who obtained the procedure -- United States, 1988-1993
====================================================================================================================================
                                                      Race
                 --------------------------------------------------------------------------------
                          White                      Black                      Other +                      All races
                 -----------------------    ------------------------     ------------------------      -----------------------------
Age (yrs)         Rate     SE &       No.    Rate     SE          No.    Rate      SE         No.        Rate     SE         No.
------------------------------------------------------------------------------------------------------------------------------------
15-24              0.5   0.07      39,974      --     --        4,762      --      --         301         0.4   0.06      45,037
25-29              3.7   0.29     186,467     2.8   0.43       23,775     1.4    0.30       3,817 @       3.5   0.24     214,059
30-34              6.0   0.41     325,994     7.4   0.95       63,915     2.7    0.47       7,886         6.0   0.37     397,795
35-39              9.5   0.54     479,853    13.9   1.11      107,953     6.2    0.90      16,972         9.9   0.44     604,779
40-44             12.5   0.61     572,278    15.7   1.03       99,744    13.2    1.53      30,868        12.9   0.59     702,890
45-54              9.8   0.48     664,734    10.1   0.64       88,484    11.0    2.04      32,411         9.9   0.46     785,629
 >=55              3.4   0.15     546,642     2.3   0.30       36,676     4.3    0.78      17,453         3.3   0.14     600,772

Total              5.5   0.25   2,815,943     5.9   0.37      425,309     4.8    0.58     109,708         5.5   0.22   3,350,961
------------------------------------------------------------------------------------------------------------------------------------
*  Per 1,000 female, civilian residents in each age and race category. Rates by race were adjusted be redistributing the number of
   of women for whom race was unknown according to the known distribution of race in the National Hospital Discharge Survey. Rates
   were calculated by applying population weights to the sum of the number of hysterectomies obtained each year, and then dividing
   this value by the sum of the population esimates for each year. Population estimates were obtained from the U. S. Department of
   Commerce, Bureau of the Census.
+  Includes Asian, Pacific Islander, American Indian, Alaskan Native, and other races.
&  Standard error.
@  Based on 30-59 women in the sample; number was unreliable.
-- Fewer than 30 women in the sample; numbers were too small for meaningful analysis.
====================================================================================================================================
Return to top. Figure_2 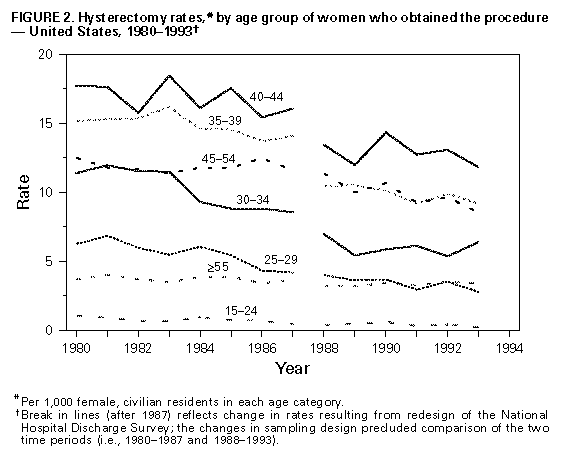 Return to top. Figure_3 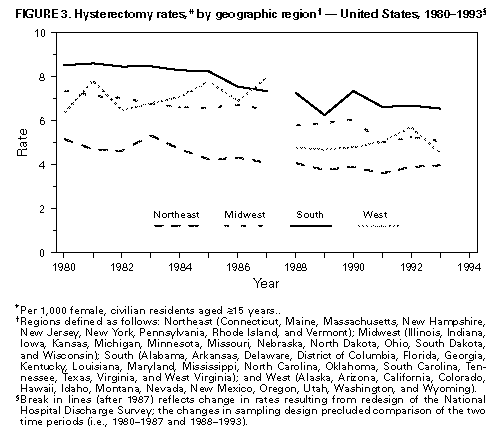 Return to top. Table_3 Note: To print large tables and graphs users may have to change their printer settings to landscape and use a small font size.
TABLE 3. Estimated rates * of hysterectomy, by race of women who obtained the procedure and primary discharge diagnosis -- United States, 1988-1993
====================================================================================================================================================
                                                               Race
                         -------------------------------------------------------------------------------
                                   White                       Black                    Other +                       All races
                         --------------------------   -----------------------   ------------------------     ---------------------------------------
Diagnosis                  Rate      SE &       No.    Rate     SE       No.     Rate      SE       No.        Rate     SE         No.
----------------------------------------------------------------------------------------------------------------------------------------------------
Cancer                      0.6    0.03     294,892     0.4   0.05    28,179      0.8    0.12    17,177         0.6   0.02     340,248
Endometrial hyperplasia     0.3    0.03     164,592     0.1   0.02    10,582       --      --     4,173         0.3   0.02     179,347
Endometriosis               1.1    0.07     577,846     0.5   0.05    39,434      0.6    0.09    14,377         1.0   0.06     631,657
Uterine leiomyoma           1.6    0.08     807,598     3.6   0.23   260,783      2.2    0.34    49,190         1.8   0.08   1,117,571
Uterine prolapse            1.0    0.06     513,049     0.3   0.04    21,911      0.6    0.09    13,697         0.9   0.05     548,657
Other                       0.9    0.06     459,316     0.9   0.10    63,362      0.5    0.09    10,803         0.9   0.05     533,481

Total                       5.5    0.25   2,817,293     5.9   0.37   424,251      4.8    0.58   109,417         5.5   0.22   3,350,961
----------------------------------------------------------------------------------------------------------------------------------------------------
*  Per 1,000 female, civilian residents in each age and race category. Rates by race were adjusted by redistributing the number of women for
   whom race was unknown according to the known distribution of race iin the National Hospital Discharge Survey. Rates were
   calculated by applying population weights to the sum of the numbers of hysterectomies obtained each year, and then dividing this value
   by the sum of the population estimates for each year. Population estimates were obtained from the U.S. Department of Commerce, Bureau of
   the Census.
+  Included Asian, Pacidic Islander, American Indian, Alaskan Native, and other races.
&  Standard error.
-- Fewer than 30 women in the sample; numbers were too small for meaningful analysis.
====================================================================================================================================================
Return to top. Table_4 Note: To print large tables and graphs users may have to change their printer settings to landscape and use a small font size.
TABLE 4. Estimated rates * of hysterectomy, by age group of women who obtained the procedure and primary discharge
diagnosis -- United States, 1988-1993
==========================================================================================================================
                                                               Diagnosis
                   -----------------------------------------------------------------------------------------------
                          Cancer                        Endometrial hyperplasia              Endometriosis
                   -----------------------             --------------------------         ------------------------
Age (yrs)           Rate     SE +     No.                Rate     SE       No.            Rate      SE        No.
--------------------------------------------------------------------------------------------------------------------------
15-24                 --     --     4,809                  --     --       948             0.1    0.02      7,288 &
25-29                0.3   0.04    18,408                  --     --     2,305             1.0    0.13     64,883
30-34                0.4   0.07    29,555                 0.2   0.04                       1.8    0.13    115,553
                                                                       11,749&
35-39                0.7   0.07    40,291                 0.3   0.05    19,156             2.6    0.21    160,615
40-44                0.6   0.06    31,063                 0.4   0.06    23,200             2.7    0.23    149,801
45-54                0.6   0.04    46,234                 0.8   0.08    60,260             1.4    0.11    108,052
 >=55                0.9   0.05   169,888                 0.3   0.03    61,729             0.1    0.03     25,465

Total                0.6   0.02   340,248                 0.3   0.02   179,347             1.0    0.06    631,657
==========================================================================================================================


                                                Diagnosis
              ---------------------------------------------------------------------------------
                Uterine leiomyoma            Uterine prolapse                  Other                     Total
              -----------------------     --------------------------    -----------------------   ------------------------
Age (yrs)     Rate     SE         No.      Rate      SE          No.     Rate      SE       No.   Rate     SE          No.
--------------------------------------------------------------------------------------------------------------------------
15-24           --     --         881       0.1    0.03        7,442 &    0.2    0.04    23,669    0.4   0.06       45,037
25-29          0.3   0.05      17,456       0.5    0.07       31,506      1.3    0.14    79,501    3.5   0.24      214,059
30-34          1.1   0.10      72,732       0.9    0.10       62,028      1.6    0.16   106,178    6.0   0.37      397,795
35-39          3.3   0.16     202,990       1.3    0.11       78,515      1.7    0.15   103,212    9.9   0.44      604,779
40-44          6.3   0.31     341,741       1.3    0.10       70,553      1.6    0.10    86,532   12.9   0.59      702,890
45-54          5.2   0.36     415,760       1.1    0.09       89,858      0.8    0.07    65,465    9.9   0.46      785,629
 >=55          0.4   0.03      66,010       1.2    0.07      208,755      0.4    0.04    68,925    3.3   0.14      600,772

Total          1.8   0.08   1,117,570       0.9    0.05      548,657      0.9    0.05   533,482    5.5   0.22    3,350,961
--------------------------------------------------------------------------------------------------------------------------
*  Per 1,000 female, civilian residents in each age category. Rates were calculated by applying population weights to the
   sum of the number of hysterectomies obtained each year, and then dividing this value by the sum of the population
   estimates for each year. Population estimates were obtained from the U.S. Department of Commers, Bureau of the Census.
+  Standard error.
&  Based on 30-59 women in the sample; number was unreliable.
@  Includes cervical dysplasia and menstrual disturbances.
-- Fewer than 30 women in the sample; numbers were too small for meaningful analysis.
==========================================================================================================================
Return to top. Figure_4 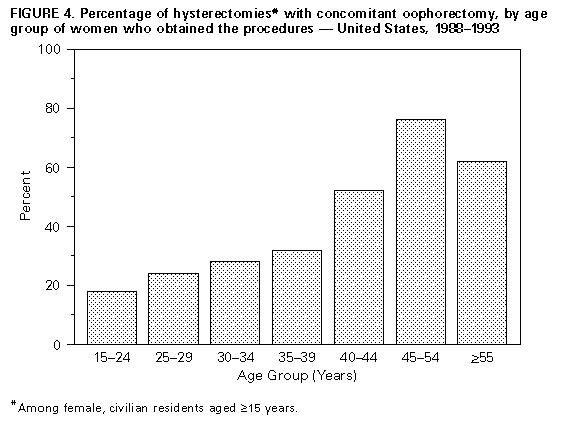 Return to top. Figure_5 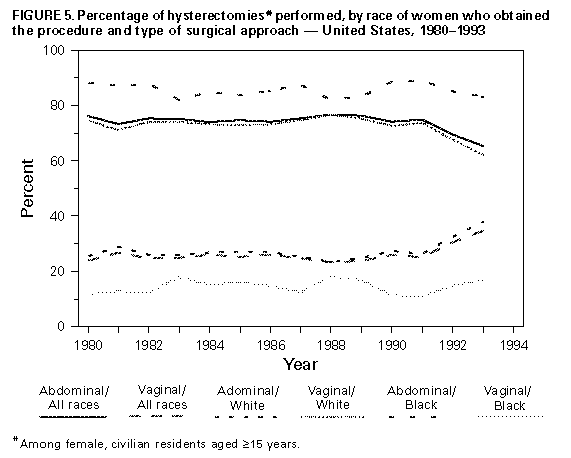 Return to top. Figure_6 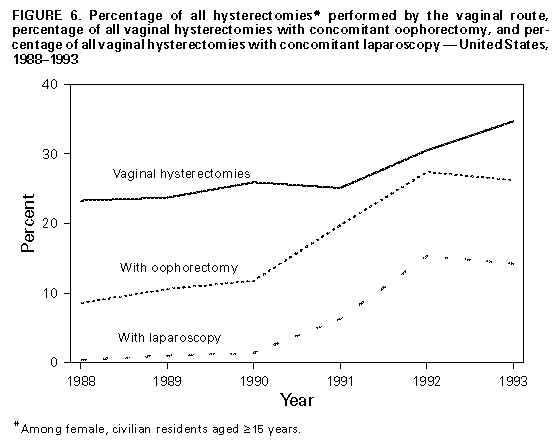 Return to top. Disclaimer All MMWR HTML versions of articles are electronic conversions from ASCII text into HTML. This conversion may have resulted in character translation or format errors in the HTML version. Users should not rely on this HTML document, but are referred to the electronic PDF version and/or the original MMWR paper copy for the official text, figures, and tables. An original paper copy of this issue can be obtained from the Superintendent of Documents, U.S. Government Printing Office (GPO), Washington, DC 20402-9371; telephone: (202) 512-1800. Contact GPO for current prices. **Questions or messages regarding errors in formatting should be addressed to mmwrq@cdc.gov.Page converted: 09/19/98 |
|||||||||
This page last reviewed 5/2/01
|