 |
|
|
|
|
|
|
| ||||||||||
|
|
|
|
|
|
|
||||
| ||||||||||
|
|
|
|
|
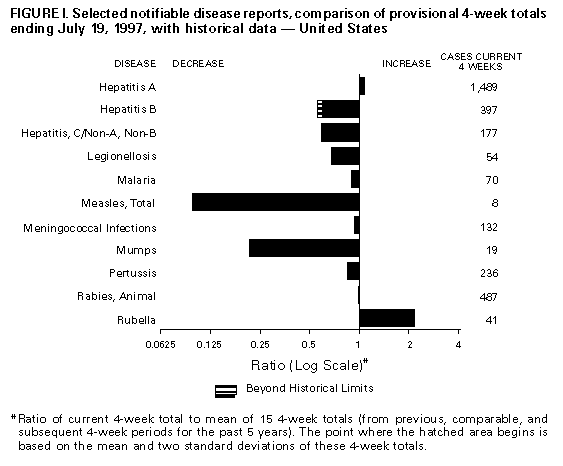
Persons using assistive technology might not be able to fully access information in this file. For assistance, please send e-mail to: mmwrq@cdc.gov. Type 508 Accommodation and the title of the report in the subject line of e-mail. Notifiable Diseases/Deaths in Selected Cities Weekly InformationFigure_I Selected notifiable disease reports, comparison of provisional 4-week totals ending July 19, 1997, with historical data -- United States Table_I Summary -- provisional cases of selected notifiable diseases, United States, cumulative, week ending July 19, 1997 (29th Week) Table_II Provisional cases of selected notifiable diseases, United States, weeks ending July 19, 1997 and July 20, 1996 (29th Week) Table_III Provisional cases of selected notifiable diseases preventable by vaccination, United States, weeks ending July 19, 1997 and July 20, 1996 (29th Week) Table_IV Deaths in 122 U.S. cities, week ending
July 19, 1997 (29th Week)
TABLE I. Summary -- provisional cases of specified notifiable diseases, United
States, cumulative, week ending July 19, 1997 (29th Week)
==================================================================================
                                             Cum. 1997
------------------------------------------------------
Anthrax                                              -
Brucellosis                                         31
Cholera                                              4
Congenital rubella syndrome                          2
Cryptosporidiosis*                                 687
Diphtheria                                           5
Encephalitis:  California*                           4
               eastern equine*                       -
               St. Louis*                            1
               western equine*                       1
Hansen Disease                                      53
Hantavirus pulmonary syndrome*+                      9
Hemolytic uremic syndrome, post-diarrheal*          22
HIV infection, pediatric*&                         131
Plague                                               2
Poliomyelitis, paralytic                             -
Psittacosis                                         21
Rabies, human                                        2
Rocky Mountain spotted fever (RMSF)                144
Streptococcal disease, invasive Group A            921
Streptococcal toxic-shock syndrome*                 22
Syphilis, congenital@                              125
Tetanus                                             23
Toxic-shock syndrome                                66
Trichinosis                                          3
Typhoid fever                                      153
Yellow fever                                         -
------------------------------------------------------
-: no reported cases
 * Not notifiable in all states
 + Updated weekly from reports to the Division of Viral and Rickettsial
   Diseases, National Center for Infectious Diseases (NCID).
 & Updated monthly to the Division of HIV/AIDS Prevention, National Center
   for HIV, STD, and TB Prevention (NCHSTP), last update June 24, 1997.
 @ Updated quarterly from reports to the Division of STD Prevention,
   NCHSTP.

==================================================================================
Return to top. Table_II Note: To print large tables and graphs users may have to change their printer settings to landscape and use a small font size.
TABLE II. (page 1) Provisional cases of selected notifiable diseases, United States, weeks ending
July 19, 1997, and July 20, 1996 (29th Week)
Escherichia
coli O157:H7
------------------- Hepatitis
AIDS* Chlamydia NETSS** PHLIS*** Gonorrhea C\NA,NB
----------------- -------------------- -------- -------- ------------------- ----------------
Cum. Cum. Cum. Cum. Cum. Cum. Cum. Cum. Cum. Cum.
Reporting Area 1997 1996 1997 1996 1997 1997 1997 1996 1997 1996
------------------------------------------------------------------------------------------------------------------------------
UNITED STATES 30,463 36,705 227,922 220,211 881 392 142,924 163,129 1,683 1,985
NEW ENGLAND 1,277 1,554 9,112 8,919 79 34 3,076 3,455 32 52
Maine 28 22 548 U 8 - 31 24 - -
N.H. 17 50 401 400 5 3 59 81 6 5
Vt. 23 14 214 240 4 1 27 34 - 15
Mass. 467 739 3,937 3,602 50 30 1,247 1,173 22 28
R.I. 85 94 1,069 1,120 1 - 243 283 4 4
Conn. 657 635 2,943 3,557 11 - 1,469 1,860 - -
MID. ATLANTIC 9,745 9,666 31,243 36,640 52 14 18,421 22,847 191 169
Upstate N.Y. 1,645 1,166 N N 34 4 3,011 3,989 148 136
N.Y. City 4,978 5,303 16,336 19,856 8 - 7,287 8,912 - 3
N.J. 1,973 1,937 4,656 6,985 10 8 3,274 4,389 - -
Pa. 1,149 1,260 10,251 9,799 N 2 4,849 5,557 43 30
E.N. CENTRAL 2,041 2,936 32,622 48,084 175 43 20,205 31,562 308 289
Ohio 396 662 6,786 11,333 41 17 4,604 8,051 10 14
Ind. 361 390 4,673 5,251 32 10 3,129 3,455 9 7
Ill. 765 1,205 6,043 13,503 40 - 2,950 9,125 40 58
Mich. 386 521 10,372 12,089 62 6 7,484 8,286 249 210
Wis. 133 158 4,748 5,908 N 10 2,038 2,645 - -
W.N. CENTRAL 565 838 12,988 16,775 159 86 6,207 7,762 96 53
Minn. 101 168 U 2,702 74 48 U 1,099 3 -
Iowa 70 57 2,515 1,980 24 9 686 504 19 25
Mo. 237 398 6,233 7,214 24 22 4,156 4,638 63 13
N. Dak. 7 11 457 539 5 3 34 14 2 -
S. Dak. 4 8 695 705 10 - 77 100 - -
Nebr. 61 55 1,038 1,109 14 - 393 237 2 5
Kans. 85 141 2,050 2,526 8 4 861 1,170 7 10
S. ATLANTIC 7,504 9,281 50,313 28,327 99 43 47,696 52,355 172 101
Del. 144 166 1,276 1,148 3 3 639 799 - -
Md. 950 1,133 3,918 U 8 3 7,268 5,434 10 1
D.C. 538 617 N N - - 1,738 2,474 - -
Va. 651 580 6,178 5,954 N 18 4,423 5,205 18 8
W. Va. 57 66 1,628 1,131 N - 503 384 11 7
N.C. 428 471 10,269 U 28 16 9,870 10,179 33 30
S.C. 410 476 6,934 U 2 - 6,219 6,151 27 15
Ga. 965 1,409 7,105 7,101 26 - 7,775 11,862 U -
Fla. 3,361 4,363 13,005 12,993 31 3 9,261 9,867 73 40
E.S. CENTRAL 1,022 1,208 18,169 16,487 54 7 18,046 17,582 200 355
Ky. 177 173 3,636 3,765 17 - 2,320 2,262 9 20
Tenn. 418 474 7,001 7,127 28 7 5,812 6,166 135 275
Ala. 237 364 4,541 4,548 6 - 6,356 7,293 6 2
Miss. 190 197 2,991 1,047 3 - 3,558 1,861 50 58
W.S. CENTRAL 3,187 3,905 29,224 11,326 28 5 18,413 10,795 199 201
Ark. 120 169 676 970 4 1 1,410 2,329 - 4
La. 545 878 4,904 3,811 4 3 4,581 4,057 121 117
Okla. 166 166 4,071 4,112 2 1 2,555 2,581 5 1
Tex. 2,356 2,692 19,573 2,433 18 - 9,867 1,828 73 79
MOUNTAIN 881 1,174 13,117 13,829 106 63 4,069 4,316 219 352
Mont. 22 22 498 698 7 - 20 14 12 10
Idaho 28 23 790 856 13 8 59 58 28 87
Wyo. 13 3 309 358 5 - 28 20 91 111
Colo. 210 332 1,896 1,091 48 31 1,171 994 25 33
N. Mex. 79 111 1,899 2,258 5 4 653 462 33 42
Ariz. 227 339 5,427 6,147 N 14 1,607 2,113 22 40
Utah 68 106 935 823 25 - 137 161 3 13
Nev. 234 238 1,363 1,598 3 6 394 494 5 16
PACIFIC 4,241 6,142 31,134 39,824 129 94 6,791 12,455 266 413
Wash. 380 442 5,032 5,520 25 22 1,072 1,199 17 35
Oreg. 162 279 2,219 3,073 38 40 350 455 4 6
Calif. 3,643 5,285 22,212 29,669 61 27 4,902 10,288 159 255
Alaska 22 14 790 583 5 1 216 243 - 2
Hawaii 34 122 881 979 N 4 251 270 86 115
Guam 2 4 31 228 N - 3 39 - 6
P.R. 1,021 1,047 U U 25 U 351 356 63 104
V.I. 52 14 N N N U - - - -
Amer. Samoa - - - - N U - - - -
C.N.M.I. 1 - N N N U 16 11 2 -
------------------------------------------------------------------------------------------------------------------------------
N: Not notifiable U: Unavailable -: no reported cases C.N.M.I.: Commonwealth of North Mariana Islands
* Updated monthly to the Division of HIV/AIDS Prevention, National Center for HIV, STD, and TB Prevention, last update June 24, 1997.
** National Electronic Telecommunications System for Surveillance.
*** Public Health Laboratory Information System.
=======================================================================================================================================================
TABLE II. (page 2) Provisional cases of selected notifiable diseases, United States, weeks ending
July 19, 1997, and July 20, 1996 (29th Week)
Lyme Syphilis Rabies,
Legionellosis Disease Malaria (Primary & Secondary) Tuberculosis Animal
---------------- ---------------- ---------------- --------------------- ----------------- -------
Cum. Cum. Cum. Cum. Cum. Cum. Cum. Cum. Cum. Cum. Cum.
Reporting Area 1997 1996 1997 1996 1997 1996 1997 1996 1997 1996 1997
-------------------------------------------------------------------------------------------------------------------------------------------
UNITED STATES 448 426 2,141 4,715 782 737 4,320 6,274 9,240 10,246 4,026
NEW ENGLAND 31 21 396 1,038 37 30 91 89 236 241 591
Maine 1 1 7 9 1 5 - - 11 16 124
N.H. 3 - 7 16 1 1 - 1 9 8 23
Vt. 4 3 3 9 2 2 - - 3 1 90
Mass. 9 11 88 54 15 11 43 40 138 108 127
R.I. 5 6 53 126 4 3 2 1 17 24 11
Conn. 9 N 238 824 14 8 46 47 58 84 216
MID. ATLANTIC 78 92 1,280 3,055 197 229 212 286 1,676 1,804 831
Upstate N.Y. 18 27 276 1,430 33 45 19 43 222 201 615
N.Y. City 3 7 18 168 107 130 46 91 866 952 -
N.J. 12 8 418 686 43 38 88 97 336 387 90
Pa. 45 50 568 771 14 16 59 55 252 264 126
E.N. CENTRAL 144 148 34 216 71 93 347 1,057 1,068 1,074 88
Ohio 72 49 26 12 11 8 110 401 344 164 61
Ind. 25 35 6 12 7 7 70 138 81 102 10
Ill. 5 19 2 7 27 46 38 290 429 580 5
Mich. 36 28 - - 20 20 72 109 153 173 11
Wis. 6 17 U 185 6 12 57 119 61 55 1
W.N. CENTRAL 40 23 31 75 28 17 81 215 286 247 268
Minn. 1 2 20 12 10 5 U 25 76 64 26
Iowa 11 3 1 12 8 2 4 13 34 36 93
Mo. 10 5 7 29 5 7 53 154 116 89 11
N. Dak. 2 - - - 2 - - - 6 3 38
S. Dak. 2 2 - - - - - - 7 13 40
Nebr. 10 9 2 1 1 - 3 8 12 13 1
Kans. 4 2 1 21 2 3 21 15 35 29 59
S. ATLANTIC 69 57 264 192 163 115 1,811 2,132 1,796 1,884 1,722
Del. 6 7 27 85 2 2 15 23 11 27 36
Md. 17 7 186 48 46 31 493 370 170 161 315
D.C. 3 4 7 1 9 7 50 86 57 78 3
Va. 12 12 11 12 37 19 146 242 165 149 339
W. Va. N N 1 7 - 2 3 2 29 33 50
N.C. 8 5 15 30 8 10 404 577 219 267 530
S.C. 3 4 1 3 9 8 222 235 183 203 99
Ga. - 1 1 1 15 14 302 374 330 370 179
Fla. 20 16 15 5 37 22 176 223 632 596 171
E.S. CENTRAL 26 26 39 41 16 18 978 1,450 645 788 145
Ky. 2 2 4 13 4 3 85 77 100 135 19
Tenn. 18 12 20 13 4 8 431 479 228 274 83
Ala. 2 2 4 2 5 3 258 306 223 243 43
Miss. 4 10 11 13 3 4 204 588 94 136 -
W.S. CENTRAL 7 4 25 49 7 14 606 640 1,199 1,218 171
Ark. - 1 6 16 2 - 66 152 118 111 27
La. 2 - 2 1 5 2 212 306 - 6 1
Okla. 2 3 5 3 - - 67 108 104 95 66
Tex. 3 - 12 29 - 12 261 74 977 1,006 77
MOUNTAIN 26 26 9 4 44 31 87 75 295 353 74
Mont. 1 1 - - 2 3 - - 7 14 19
Idaho 2 - 2 - - - - 2 7 5 -
Wyo. 1 3 2 3 2 3 - 2 2 3 18
Colo. 8 7 3 - 23 14 4 22 57 49 -
N. Mex. 1 1 - - 6 1 8 4 16 55 5
Ariz. 7 7 1 - 5 4 65 38 147 130 30
Utah 5 2 - 1 3 4 3 2 13 34 -
Nev. 1 5 1 - 3 2 7 5 46 63 2
PACIFIC 27 29 63 45 219 190 107 330 2,039 2,637 136
Wash. 6 3 2 3 9 11 7 6 112 146 -
Oreg. - - 9 10 11 13 5 4 94 98 2
Calif. 20 24 52 31 194 159 93 318 1,691 2,240 115
Alaska - 1 - - 3 2 1 - 46 49 19
Hawaii 1 1 - 1 2 5 1 2 96 104 -
Guam - 1 - - - - - 3 5 55 -
P.R. - - - - 3 1 134 135 129 105 36
V.I. - - - - - - - - - - -
Amer. Samoa - - - - - - - - - - -
C.N.M.I. - - - - - - 9 1 2 - -
-------------------------------------------------------------------------------------------------------------------------------------------
N: Not notifiable U: Unavailable -: no reported cases
=======================================================================================================================================================
Return to top. Table_III Note: To print large tables and graphs users may have to change their printer settings to landscape and use a small font size.
TABLE III. (page 1) Provisional cases of selected notifiable diseases preventable by vaccination, United
States, weeks ending July 19, 1997, and July 20, 1996 (29th Week)
Hepatitis (Viral), by type Measles (Rubeola)
H. influenzae, --------------------------------------- ------------------------------------------------------------
invasive A B Indigenous Imported** Total
---------------- ----------------- ----------------- --------------- --------------- ---------------
Cum. Cum. Cum. Cum. Cum. Cum. Cum. Cum. Cum. Cum.
Reporting Area 1997* 1996 1997 1996 1997 1996 1997 1997 1997 1997 1997 1996
-----------------------------------------------------------------------------------------------------------------------------------------------------
UNITED STATES 641 667 14,763 15,012 4,662 5,265 - 50 3 27 77 306
NEW ENGLAND 35 21 362 175 82 114 - 9 - 2 11 11
Maine 3 - 45 12 7 2 - - - - - -
N.H. 4 10 19 8 5 8 - 1 - - 1 -
Vt. 3 - 7 4 2 9 - - - - - 1
Mass. 22 10 139 87 33 33 - 8 - 1 9 9
R.I. 2 1 80 7 9 6 - - - - - -
Conn. 1 - 72 57 26 56 - - - 1 1 1
MID. ATLANTIC 72 137 1,110 1,018 668 841 - 12 1 5 17 27
Upstate N.Y. 14 35 158 228 139 203 - 2 - 3 5 5
N.Y. City 20 35 420 318 238 299 - 4 - 1 5 9
N.J. 28 35 184 219 136 170 - 1 - - 1 2
Pa. 10 32 348 253 155 169 - 5 1 1 6 11
E.N. CENTRAL 105 117 1,474 1,368 498 611 - 5 - 3 8 16
Ohio 60 66 207 498 48 71 - - - - - 2
Ind. 11 7 178 175 60 83 - - - - - -
Ill. 23 32 313 342 120 185 - 5 - 1 6 3
Mich. 10 7 690 237 253 217 - - - 2 2 2
Wis. 1 5 86 116 17 55 - - - - - 9
W.N. CENTRAL 33 25 1,143 1,179 291 269 - 9 - 2 11 16
Minn. 23 13 104 59 23 28 - - - 2 2 14
Iowa 3 3 196 213 29 35 - - - - - -
Mo. 3 6 597 606 209 164 - 1 - - 1 1
N. Dak. - - 10 28 2 - - - - - - -
S. Dak. 2 1 14 39 - - - 8 - - 8 -
Nebr. 1 1 56 86 9 20 - - - - - -
Kans. 1 1 166 148 19 22 - - - - - 1
S. ATLANTIC 116 120 939 601 684 698 - 2 2 7 9 5
Del. - 1 16 7 4 6 - - - - - 1
Md. 46 41 149 108 102 89 - - 1 2 2 -
D.C. 2 5 15 18 24 26 - - - 1 1 -
Va. 7 5 114 88 74 85 - - - 1 1 2
W. Va. 3 6 6 12 9 14 - - - - - -
N.C. 17 18 113 76 134 195 - - - 1 1 -
S.C. 4 3 68 30 62 47 - - - - - -
Ga. 22 30 196 48 64 8 - - 1 1 1 1
Fla. 15 11 262 214 211 228 - 2 - 1 3 1
E.S. CENTRAL 35 19 360 841 387 455 - - - - - -
Ky. 4 5 45 21 24 43 - - - - - -
Tenn. 23 8 228 574 255 262 - - - - - -
Ala. 8 5 52 110 40 31 - - - - - -
Miss. - 1 35 136 68 119 U - U - - -
W.S. CENTRAL 33 29 2,949 2,863 561 621 - 3 - 1 4 14
Ark. 1 - 150 268 33 48 - - - - - -
La. 7 3 119 88 83 65 - - - - - -
Okla. 20 23 939 1,227 21 24 - - - - - -
Tex. 5 3 1,741 1,280 424 484 - 3 - 1 4 14
MOUNTAIN 66 33 2,341 2,437 503 636 - 5 - - 5 84
Mont. - - 54 71 5 7 - - - - - -
Idaho 1 1 80 140 15 64 U - U - - 1
Wyo. 2 - 20 23 21 25 - - - - - -
Colo. 9 7 254 220 98 69 - - - - - 7
N. Mex. 8 8 188 267 168 215 - - - - - 7
Ariz. 27 12 1,229 934 116 148 - 5 - - 5 8
Utah 3 5 370 559 57 63 - - - - - 56
Nev. 16 - 146 223 23 45 - - - - - 5
PACIFIC 146 166 4,085 4,530 988 1,020 - 5 - 7 12 133
Wash. 2 2 295 300 43 57 - - - - - 37
Oreg. 22 22 215 578 62 65 - - - - - 7
Calif. 114 136 3,476 3,572 861 886 - 2 - 7 9 24
Alaska 2 4 23 28 14 4 - - - - - 63
Hawaii 6 2 76 52 8 8 - 3 - - 3 2
Guam - - - 6 1 - U - U - - -
P.R. - 1 185 118 827 554 - - - - - 2
V.I. - - - 25 - 23 U - U - - -
Amer. Samoa - - - - - - U - U - - -
C.N.M.I. 5 10 1 1 26 5 U 1 U - 1 -
-----------------------------------------------------------------------------------------------------------------------------------------------------
N: Not notifiable U: Unavailable -: no reported cases
* Of 137 cases among children aged <5 years, serotype was reported for 75 and of those, 28 were type b.
** For imported measles, cases include only those resulting from importation from other countries.
=======================================================================================================================================================
TABLE III. (page 2) Provisional cases of selected notifiable diseases preventable by vaccination, United
States, weeks ending July 19, 1997, and July 20, 1996 (29th Week)
Meningococcal
Disease Mumps Pertussis Rubella
----------------- -------------------------- --------------------------- ---------------------------
Cum. Cum. Cum. Cum. Cum. Cum. Cum. Cum.
Reporting Area 1997 1996 1997 1997 1996 1997 1997 1996 1997 1997 1996
------------------------------------------------------------------------------------------------------------------------------------------
UNITED STATES 2,086 2,039 6 337 406 59 2,697 2,094 27 94 138
NEW ENGLAND 129 88 - 7 1 7 546 443 - - 24
Maine 15 9 - - - - 6 15 - - -
N.H. 13 3 - - - - 64 20 - - -
Vt. 2 3 - - - 3 178 12 - - 2
Mass. 65 33 - 2 1 4 275 391 - - 20
R.I. 9 10 - 4 - - 12 - - - -
Conn. 25 30 - 1 - - 11 5 - - 2
MID. ATLANTIC 184 225 - 30 56 2 177 135 - 3 7
Upstate N.Y. 48 57 - 6 17 - 54 69 - 1 3
N.Y. City 34 35 - - 13 - 40 21 - 2 2
N.J. 42 48 - - 2 - 5 7 - - 2
Pa. 60 85 - 24 24 2 78 38 - - -
E.N. CENTRAL 300 291 3 38 88 11 202 280 - 4 3
Ohio 116 107 1 18 28 7 85 89 - - -
Ind. 35 40 - 4 5 3 33 19 - - -
Ill. 89 83 - 7 17 1 30 63 - 1 1
Mich. 36 29 2 9 37 - 31 25 - - 2
Wis. 24 32 - - 1 - 23 84 - 3 -
W.N. CENTRAL 160 161 - 13 7 9 164 83 - - -
Minn. 24 22 - 5 3 7 108 54 - - -
Iowa 37 32 - 6 - - 18 3 - - -
Mo. 74 62 - - 2 2 25 15 - - -
N. Dak. 1 3 - - 2 - 2 1 - - -
S. Dak. 4 8 - - - - 2 2 - - -
Nebr. 6 14 - 2 - - 4 3 - - -
Kans. 14 20 - - - - 5 5 - - -
S. ATLANTIC 377 319 2 48 57 11 271 217 27 60 29
Del. 5 2 - - - - - 14 - - -
Md. 35 36 - 4 19 2 82 75 - - -
D.C. 1 4 - - - - 3 - - - 1
Va. 34 35 1 7 7 1 32 26 - 1 2
W. Va. 14 13 - - - - 5 2 - - -
N.C. 69 54 - 7 11 5 73 34 27 49 15
S.C. 44 41 - 10 5 - 11 15 - 9 1
Ga. 73 96 1 5 2 2 9 13 - - -
Fla. 102 38 - 15 13 1 56 38 - 1 10
E.S. CENTRAL 159 142 - 16 16 2 61 156 - - 2
Ky. 37 20 - 3 - - 14 128 - - -
Tenn. 61 43 - 3 1 2 24 14 - - -
Ala. 45 43 - 6 3 - 15 8 - - 2
Miss. 16 36 U 4 12 U 8 6 U - N
W.S. CENTRAL 204 229 - 34 30 3 67 71 - 4 7
Ark. 25 27 - - 1 1 12 2 - - -
La. 42 42 - 11 11 - 12 5 - - 1
Okla. 23 23 - - - 2 12 5 - - -
Tex. 114 137 - 23 18 - 31 59 - 4 6
MOUNTAIN 120 119 - 44 18 14 764 206 - 5 6
Mont. 8 6 - - - 1 10 7 - - -
Idaho 8 17 U 2 - U 520 65 U 1 2
Wyo. 1 3 - 1 - - 5 1 - - -
Colo. 34 19 - 3 3 5 161 51 - - 2
N. Mex. 19 20 N N N 3 38 33 - - -
Ariz. 33 30 - 30 1 - 19 12 - 4 1
Utah 11 11 - 6 3 5 9 10 - - -
Nev. 6 13 - 2 11 - 2 27 - - 1
PACIFIC 453 465 1 107 133 - 445 503 - 18 60
Wash. 55 62 - 13 18 - 207 208 - 3 12
Oreg. 92 82 N N N - 18 33 - - 1
Calif. 303 314 1 82 95 - 211 248 - 8 44
Alaska 1 5 - 2 2 - 2 1 - - -
Hawaii 2 2 - 10 18 - 7 13 - 7 3
Guam - 4 U 1 4 U - - U - -
P.R. 9 10 - 5 1 - - 2 - - -
V.I. - - U - 1 U - - U - -
Amer. Samoa - - U - - U - - U - -
C.N.M.I. - - U 4 - U - - U - -
------------------------------------------------------------------------------------------------------------------------------------------
N: Not notifiable U: Unavailable -: no reported cases
=======================================================================================================================================================
Return to top. Table_IV Note: To print large tables and graphs users may have to change their printer settings to landscape and use a small font size.
TABLE IV. Deaths in 122 U.S. cities,* week ending
July 19, 1997 (29th Week)
===================================================================================================================================
All Causes, By Age (Years)
------------------------------------------------------------------------ P&I**
Reporting Area All Ages >=65 45-64 25-44 1-24 <1 Total
---------------------------------------------------------------------------------------------------------------
NEW ENGLAND 448 319 79 35 9 6 24
Boston, Mass. 146 90 34 14 5 3 5
Bridgeport, Conn. 30 24 4 2 - - 2
Cambridge, Mass. 19 12 5 1 1 - 1
Fall River, Mass. 38 30 5 3 - - 1
Hartford, Conn. U U U U U U U
Lowell, Mass. 22 18 3 1 - - -
Lynn, Mass. 18 14 2 1 1 - -
New Bedford, Mass. 13 11 - 1 1 - -
New Haven, Conn. 36 27 6 2 - 1 5
Providence, R.I. U U U U U U U
Somerville, Mass. 6 4 2 - - - -
Springfield, Mass. 37 29 3 4 - 1 3
Waterbury, Conn. 28 21 6 1 - - 2
Worcester, Mass. 55 39 9 5 1 1 5
MID. ATLANTIC 2,325 1,596 432 200 47 50 130
Albany, N.Y. 44 32 7 2 - 3 2
Allentown, Pa. 16 15 - 1 - - 1
Buffalo, N.Y. 70 52 15 2 - 1 1
Camden, N.J. 28 20 3 1 3 1 -
Elizabeth, N.J. 22 15 2 2 1 2 -
Erie, Pa. 47 34 7 5 - 1 1
Jersey City, N.J. 41 29 8 4 - - -
New York City, N.Y. 1,140 761 224 121 16 18 52
Newark, N.J. 62 26 20 9 2 5 3
Paterson, N.J. 32 17 8 5 1 1 -
Philadelphia, Pa. 400 269 74 32 16 9 33
Pittsburgh, Pa.*** 87 65 17 1 2 2 8
Reading, Pa. 7 6 - - 1 - -
Rochester, N.Y. 120 98 17 2 2 1 8
Schenectady, N.Y. 20 13 7 - - - 2
Scranton, Pa. 34 30 1 3 - - 1
Syracuse, N.Y. 111 83 18 6 2 2 13
Trenton, N.J. 28 20 2 2 1 3 5
Utica, N.Y. 16 11 2 2 - 1 -
Yonkers, N.Y. U U U U U U U
E.N. CENTRAL 2,116 1,361 429 185 65 72 120
Akron, Ohio 32 20 4 3 2 3 -
Canton, Ohio 30 22 4 1 2 1 6
Chicago, Ill. 455 248 103 48 21 31 23
Cincinnati, Ohio 113 73 24 11 3 2 15
Cleveland, Ohio 171 112 34 16 4 5 4
Columbus, Ohio 145 103 29 9 2 2 12
Dayton, Ohio 112 86 15 9 - 2 5
Detroit, Mich. 238 129 61 28 14 6 9
Evansville, Ind. 35 29 3 3 - - -
Fort Wayne, Ind. 77 62 6 5 3 1 5
Gary, Ind. 8 5 2 1 - - -
Grand Rapids, Mich. 67 42 15 5 1 4 6
Indianapolis, Ind. 177 117 36 16 4 4 16
Lansing, Mich. 45 29 14 2 - - 1
Milwaukee, Wis. 142 97 24 14 2 5 5
Peoria, Ill. 26 16 7 3 - - 2
Rockford, Ill. 46 29 13 3 1 - 2
South Bend, Ind. 52 34 13 1 2 2 4
Toledo, Ohio 83 70 4 4 3 2 2
Youngstown, Ohio 62 38 18 3 1 2 3
W.N. CENTRAL 632 441 114 39 24 11 29
Des Moines, Iowa U U U U U U U
Duluth, Minn. 24 18 3 3 - - -
Kansas City, Kans. 50 27 11 7 3 2 -
Kansas City, Mo. 56 36 8 4 3 2 1
Lincoln, Nebr. 39 30 7 2 - - 3
Minneapolis, Minn. 133 102 19 10 2 - 11
Omaha, Nebr. 86 61 15 5 4 1 5
St. Louis, Mo. 83 58 15 3 6 1 -
St. Paul, Minn. 58 46 9 1 1 1 5
Wichita, Kans. 103 63 27 4 5 4 4
S. ATLANTIC 1,175 729 250 127 40 29 63
Atlanta, Ga. 142 79 34 20 6 3 6
Baltimore, Md. 152 86 36 19 5 6 6
Charlotte, N.C. 82 48 19 9 4 2 7
Jacksonville, Fla. 135 93 27 10 4 1 8
Miami, Fla. 104 62 23 13 3 3 -
Norfolk, Va. 49 31 5 7 3 3 3
Richmond, Va. 69 42 11 12 4 - 6
Savannah, Ga. 44 31 9 2 - 2 8
St. Petersburg, Fla. 65 45 12 4 1 3 2
Tampa, Fla. 193 133 41 9 4 6 13
Washington, D.C. 120 65 27 22 6 - 4
Wilmington, Del. 20 14 6 - - - -
E.S. CENTRAL 752 522 123 66 25 15 42
Birmingham, Ala. 185 138 29 11 5 1 11
Chattanooga, Tenn. 60 39 12 2 4 3 3
Knoxville, Tenn. 69 46 14 7 - 2 5
Lexington, Ky. 69 39 17 11 2 - 7
Memphis, Tenn. 157 113 17 16 5 6 5
Mobile, Ala. 30 24 3 2 - 1 -
Montgomery, Ala. 61 44 10 3 3 1 6
Nashville, Tenn. 121 79 21 14 6 1 5
W.S. CENTRAL 1,459 941 293 135 50 40 84
Austin, Tex. 90 57 15 8 5 5 11
Baton Rouge, La. 27 22 4 1 - - 1
Corpus Christi, Tex. 46 33 7 6 - - 2
Dallas, Tex. 168 101 33 20 10 4 5
El Paso, Tex. 54 42 10 1 1 - 3
Ft. Worth, Tex. 114 81 16 7 5 5 9
Houston, Tex. 390 222 97 50 10 11 23
Little Rock, Ark. 74 47 14 4 7 2 4
New Orleans, La. 132 71 34 18 4 5 -
San Antonio, Tex. 210 162 33 7 1 7 14
Shreveport, La. 56 37 9 8 1 1 7
Tulsa, Okla. 98 66 21 5 6 - 5
MOUNTAIN 869 564 167 93 24 20 43
Albuquerque, N.M. 104 64 22 16 2 - 3
Boise, Idaho 25 19 5 1 - - 2
Colo. Springs, Colo. 51 35 10 4 2 - 3
Denver, Colo. 83 44 18 12 4 5 3
Las Vegas, Nev. 124 86 21 13 2 2 5
Ogden, Utah 32 25 4 2 - 1 4
Phoenix, Ariz. 189 116 40 22 5 5 7
Pueblo, Colo. 30 24 4 2 - - 5
Salt Lake City, Utah 110 81 16 8 5 - 8
Tucson, Ariz. 121 70 27 13 4 7 3
PACIFIC 1,869 1,328 314 132 48 46 139
Berkeley, Calif. 14 9 4 1 - - -
Fresno, Calif. 76 53 12 4 4 3 7
Glendale, Calif. 34 25 8 1 - - 4
Honolulu, Hawaii 71 53 14 - 3 1 6
Long Beach, Calif. 52 38 10 3 1 - 10
Los Angeles, Calif. 496 356 86 33 10 11 29
Pasadena, Calif. 12 10 1 1 - - 3
Portland, Oreg. 117 83 17 8 7 2 3
Sacramento, Calif. 159 113 26 13 6 1 15
San Diego, Calif. 156 103 31 14 5 2 16
San Francisco, Calif. 129 88 24 13 1 3 13
San Jose, Calif. 229 158 36 17 4 14 15
Santa Cruz, Calif. 35 25 4 4 1 1 3
Seattle, Wash. 133 95 18 13 5 2 5
Spokane, Wash. 53 45 5 - 1 2 2
Tacoma, Wash. 103 74 18 7 - 4 8
TOTAL 11,645**** 7,801 2,201 1,012 332 289 674
---------------------------------------------------------------------------------------------------------------
U: Unavailable -: no reported cases
* Mortality data in this table are voluntarily reported from 122 cities in the United States, most of which have populations
of 100,000 or more. A death is reported by the place of its occurrence and by the week that the death certificate was
filed. Fetal deaths are not included.
** Pneumonia and influenza.
*** Because of changes in reporting methods in these 3 Pennsylvania cities, these numbers are partial counts for the current
week. Complete counts will be available in 4 to 6 weeks.
**** Total includes unknown ages.
===================================================================================================================================
Return to top. Disclaimer All MMWR HTML versions of articles are electronic conversions from ASCII text into HTML. This conversion may have resulted in character translation or format errors in the HTML version. Users should not rely on this HTML document, but are referred to the electronic PDF version and/or the original MMWR paper copy for the official text, figures, and tables. An original paper copy of this issue can be obtained from the Superintendent of Documents, U.S. Government Printing Office (GPO), Washington, DC 20402-9371; telephone: (202) 512-1800. Contact GPO for current prices. **Questions or messages regarding errors in formatting should be addressed to mmwrq@cdc.gov.Page converted: 09/19/98 |
|||||||||
This page last reviewed 5/2/01
|