 |
|
|
|
|
|
|
| ||||||||||
|
|
|
|
|
|
|
||||
| ||||||||||
|
|
|
|
|
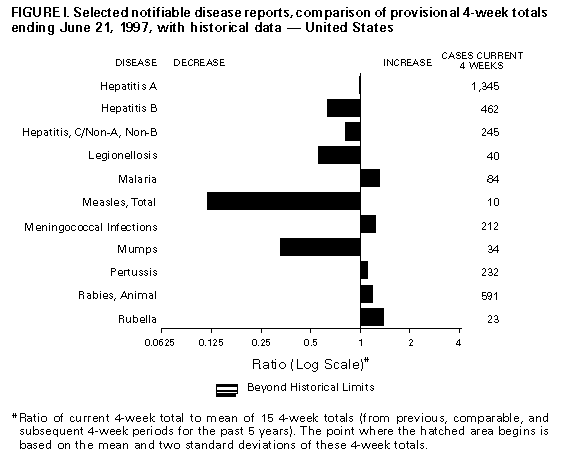
Persons using assistive technology might not be able to fully access information in this file. For assistance, please send e-mail to: mmwrq@cdc.gov. Type 508 Accommodation and the title of the report in the subject line of e-mail. Notifiable Diseases/Deaths in Selected Cities Weekly InformationFigure_I Selected notifiable disease reports, comparison of provisional 4-week totals ending June 21, 1997, with historical data -- United States Table_I Summary -- provisional cases of selected notifiable diseases, United States, cumulative, week ending June 21, 1997 (25th Week) Table_II Provisional cases of selected notifiable diseases, United States, weeks ending June 21, 1997 and June 22, 1996 (25th Week) Table_III Provisional cases of selected notifiable diseases preventable by vaccination, United States, weeks ending June 21, 1997 and June 22, 1996 (25th Week) Table_IV Deaths in 122 U.S. cities, week ending
June 21, 1997 (25th Week)
TABLE I. Summary -- provisional cases of specified notifiable diseases, United
States, cumulative, week ending June 21, 1997 (25th Week)
==================================================================================
                                             Cum. 1997
------------------------------------------------------
Anthrax                                              -
Brucellosis                                         23
Cholera                                              3
Congenital rubella syndrome                          2
Cryptosporidiosis*                                 562
Diphtheria                                           4
Encephalitis:  California*                           4
               eastern equine*                       -
               St. Louis*                            1
               western equine*                       1
Hansen Disease                                      52
Hantavirus pulmonary syndrome*+                      6
Hemolytic uremic syndrome, post-diarrheal*          21
HIV infection, pediatric*&                         112
Plague                                               1
Poliomyelitis, paralytic                             -
Psittacosis                                         21
Rabies, human                                        2
Rocky Mountain spotted fever (RMSF)                 99
Streptococcal disease, invasive Group A            822
Streptococcal toxic-shock syndrome*                 20
Syphilis, congenital@                              122
Tetanus                                             20
Toxic-shock syndrome                                54
Trichinosis                                          4
Typhoid fever                                      131
Yellow fever                                         -
------------------------------------------------------
-: no reported cases
 * Not notifiable in all states
 + Updated weekly from reports to the Division of Viral and Rickettsial
   Diseases, National Center for Infectious Diseases (NCID).
 & Updated monthly to the Division of HIV/AIDS Prevention, National Center
   for HIV, STD, and TB Prevention (NCHSTP), last update May 27, 1997.
 @ Updated quarterly from reports to the Division of STD Prevention,
   NCHSTP.

==================================================================================
Return to top. Table_II Note: To print large tables and graphs users may have to change their printer settings to landscape and use a small font size.
TABLE II. (page 1) Provisional cases of selected notifiable diseases, United States, weeks ending
June 21, 1997, and June 22, 1996 (25th Week)
Escherichia
coli O157:H7
------------------- Hepatitis
AIDS* Chlamydia NETSS** PHLIS*** Gonorrhea C\NA,NB
----------------- -------------------- -------- -------- ------------------- ----------------
Cum. Cum. Cum. Cum. Cum. Cum. Cum. Cum. Cum. Cum.
Reporting Area 1997 1996 1997 1996 1997 1997 1997 1996 1997 1996
------------------------------------------------------------------------------------------------------------------------------
UNITED STATES 25,284 31,333 190,053 194,966 565 269 119,650 143,001 1,485 1,697
NEW ENGLAND 903 1,247 7,805 7,736 47 23 2,613 2,945 27 45
Maine 25 16 453 U 3 - 28 21 - -
N.H. 14 42 314 347 2 2 55 68 5 2
Vt. 18 10 188 212 3 1 24 28 - 14
Mass. 419 648 3,390 3,161 31 20 1,062 1,012 19 26
R.I. 71 94 983 973 1 - 223 249 3 3
Conn. 356 437 2,477 3,043 7 - 1,221 1,567 - -
MID. ATLANTIC 8,301 9,075 26,473 32,981 34 9 15,695 19,909 156 144
Upstate N.Y. 1,358 1,098 N N 21 4 2,629 3,407 121 113
N.Y. City 4,157 5,292 13,648 17,878 6 - 6,042 7,802 - 3
N.J. 1,773 1,651 4,261 6,537 7 3 2,955 3,999 - -
Pa. 1,013 1,034 8,564 8,566 N 2 4,069 4,701 35 28
E.N. CENTRAL 1,687 2,423 27,871 41,738 97 28 17,129 26,989 271 253
Ohio 357 550 6,074 9,898 28 11 3,967 6,917 7 7
Ind. 329 344 4,191 4,695 21 5 2,817 3,107 7 7
Ill. 612 990 5,251 11,822 24 - 2,546 7,839 24 50
Mich. 306 400 8,678 10,171 24 4 6,197 6,818 233 189
Wis. 83 139 3,677 5,152 N 8 1,602 2,308 - -
W.N. CENTRAL 469 791 10,773 14,955 81 47 4,982 6,815 104 47
Minn. 84 157 U 2,293 36 21 U 931 2 -
Iowa 67 53 2,198 1,907 16 8 596 481 27 22
Mo. 195 397 5,360 6,392 10 13 3,450 4,042 54 12
N. Dak. 5 7 387 476 3 2 24 13 2 -
S. Dak. 3 8 578 662 5 - 58 92 - -
Nebr. 48 49 464 1,025 8 - 124 214 2 5
Kans. 67 120 1,786 2,200 3 3 730 1,042 17 8
S. ATLANTIC 6,203 7,761 40,963 26,384 66 19 39,581 46,761 135 82
Del. 111 165 - - 2 2 542 691 - -
Md. 734 853 3,447 2,978 4 1 6,266 5,952 9 1
D.C. 409 456 N N - - 1,319 2,097 - -
Va. 551 485 5,166 5,330 N 7 3,734 4,515 10 7
W. Va. 38 63 1,478 994 N - 449 349 9 7
N.C. 361 361 7,963 U 18 9 7,502 9,073 28 22
S.C. 300 414 5,918 U 1 - 5,346 5,371 25 15
Ga. 850 1,203 5,651 5,910 19 - 6,379 10,226 U -
Fla. 2,849 3,761 11,340 11,172 22 - 8,044 8,487 54 30
E.S. CENTRAL 810 1,076 16,014 14,462 44 7 15,669 15,313 175 321
Ky. 113 153 3,149 3,274 14 - 1,628 1,957 8 18
Tenn. 358 408 6,027 6,231 21 7 5,024 5,307 111 258
Ala. 194 323 3,847 4,079 6 - 5,459 6,353 6 2
Miss. 145 192 2,991 878 3 - 3,558 1,696 50 43
W.S. CENTRAL 2,596 3,277 21,759 10,300 27 5 14,587 9,605 179 146
Ark. 96 144 595 829 3 1 1,227 1,978 - 4
La. 476 758 3,941 3,318 4 3 3,711 3,561 102 86
Okla. 138 139 3,482 3,720 2 1 2,227 2,238 4 1
Tex. 1,886 2,236 13,741 2,433 18 - 7,422 1,828 73 55
MOUNTAIN 730 902 11,851 12,002 68 42 3,512 3,767 197 312
Mont. 18 10 477 588 4 - 20 13 10 10
Idaho 22 23 691 759 11 8 50 51 23 82
Wyo. 13 3 255 325 4 - 25 14 82 91
Colo. 180 245 1,896 942 20 13 915 889 25 28
N. Mex. 65 55 1,709 1,925 5 4 594 428 33 39
Ariz. 188 280 4,645 5,399 N 13 1,395 1,845 18 37
Utah 55 93 815 713 21 - 119 136 3 12
Nev. 189 193 1,363 1,351 3 4 394 391 3 13
PACIFIC 3,585 4,781 26,544 34,408 101 86 5,882 10,897 241 347
Wash. 288 379 4,334 4,794 21 20 922 1,061 14 32
Oreg. 144 234 1,762 2,679 30 39 258 400 4 5
Calif. 3,111 4,068 19,036 25,573 47 24 4,294 8,968 145 208
Alaska 16 11 658 499 3 - 190 220 - 2
Hawaii 26 89 754 863 N 3 218 248 78 100
Guam 2 4 31 206 N - 3 35 - 5
P.R. 762 1,047 N N 21 U 317 316 53 86
V.I. 36 14 N N N U - - - -
Amer. Samoa - - - - N U - - - -
C.N.M.I. 1 - N N N U 16 11 2 -
------------------------------------------------------------------------------------------------------------------------------
N: Not notifiable U: Unavailable -: no reported cases C.N.M.I.: Commonwealth of North Mariana Islands
* Updated monthly to the Division of HIV/AIDS Prevention, National Center for HIV, STD, and TB Prevention, last update May 27, 1997.
** National Electronic Telecommunications System for Surveillance.
*** Public Health Laboratory Information System.
=======================================================================================================================================================
TABLE II. (page 2) Provisional cases of selected notifiable diseases, United States, weeks ending
June 21, 1997, and June 22, 1996 (25th Week)
Lyme Syphilis Rabies,
Legionellosis Disease Malaria (Primary & Secondary) Tuberculosis Animal
---------------- ---------------- ---------------- --------------------- ----------------- -------
Cum. Cum. Cum. Cum. Cum. Cum. Cum. Cum. Cum. Cum. Cum.
Reporting Area 1997 1996 1997 1996 1997 1996 1997 1996 1997 1996 1997
-------------------------------------------------------------------------------------------------------------------------------------------
UNITED STATES 380 360 1,364 2,328 610 566 3,791 5,548 7,669 8,600 3,482
NEW ENGLAND 26 18 291 384 28 24 76 72 200 190 533
Maine 1 1 3 3 1 3 - - 11 12 108
N.H. 4 - 7 7 1 1 - 1 6 6 20
Vt. 4 2 3 3 2 2 - - 3 1 86
Mass. 7 9 46 24 14 7 37 34 113 76 103
R.I. 5 6 43 43 2 3 1 1 16 21 11
Conn. 5 N 189 304 8 8 38 36 51 74 205
MID. ATLANTIC 60 78 777 1,674 158 173 174 248 1,443 1,502 715
Upstate N.Y. 14 20 117 699 28 32 17 35 197 172 524
N.Y. City 1 4 13 92 84 97 36 78 778 773 -
N.J. 7 7 193 330 33 33 65 85 284 329 72
Pa. 38 47 454 553 13 11 56 50 184 228 119
E.N. CENTRAL 131 130 25 21 38 74 324 946 811 915 73
Ohio 71 43 20 10 7 7 106 358 151 140 54
Ind. 23 32 5 8 6 6 80 124 65 90 8
Ill. - 17 - 3 5 34 26 263 410 498 2
Mich. 31 25 - - 17 16 59 92 133 141 8
Wis. 6 13 U U 3 11 53 109 52 46 1
W.N. CENTRAL 35 21 18 55 22 13 60 196 233 228 212
Minn. 1 1 14 3 9 3 U 20 63 55 20
Iowa 10 3 1 8 8 2 3 13 27 31 75
Mo. 8 5 2 24 3 6 38 144 92 86 11
N. Dak. 2 - - - - - - - 5 2 28
S. Dak. 1 2 - - - - - - 4 13 32
Nebr. 9 8 1 - 1 - 1 7 8 13 1
Kans. 4 2 - 20 1 2 18 12 34 28 45
S. ATLANTIC 61 44 154 110 142 87 1,597 1,868 1,476 1,570 1,476
Del. 5 2 15 54 2 2 14 18 11 24 31
Md. 15 6 105 20 44 22 441 296 145 130 266
D.C. 3 3 7 1 7 5 41 79 46 70 2
Va. 11 12 3 4 29 15 134 223 140 118 289
W. Va. N N 1 4 - 1 1 2 26 27 39
N.C. 6 3 7 20 7 10 344 517 172 216 469
S.C. 2 4 1 2 9 3 206 213 155 176 83
Ga. - 1 1 - 14 8 265 329 261 326 149
Fla. 19 12 14 5 30 21 151 191 520 483 148
E.S. CENTRAL 15 21 30 32 15 13 890 1,307 545 687 135
Ky. 2 2 3 11 3 3 79 67 115 118 18
Tenn. 7 8 12 9 4 5 374 418 136 231 80
Ala. 2 2 4 1 5 2 233 271 200 222 37
Miss. 4 9 11 11 3 3 204 551 94 116 -
W.S. CENTRAL 6 2 14 18 6 11 496 563 992 966 160
Ark. - - 2 9 2 - 59 129 98 91 22
La. 1 - 1 - 4 1 197 274 - 5 1
Okla. 2 2 4 2 - - 58 86 82 72 60
Tex. 3 - 7 7 - 10 182 74 812 798 77
MOUNTAIN 23 23 5 3 34 29 71 64 251 293 53
Mont. 1 1 - - 2 3 - - 7 7 12
Idaho 2 - - - - - - 1 5 4 -
Wyo. 1 2 2 3 2 2 - 2 2 3 17
Colo. 5 6 2 - 16 14 2 20 50 43 -
N. Mex. 1 1 - - 5 1 - - 16 42 4
Ariz. 7 7 1 - 4 3 59 36 114 106 19
Utah 5 1 - - 2 4 3 1 11 33 -
Nev. 1 5 - - 3 2 7 4 46 55 1
PACIFIC 23 23 50 31 167 142 103 284 1,718 2,249 125
Wash. 6 1 1 1 8 7 7 3 94 126 -
Oreg. - - 9 9 10 11 4 4 71 86 2
Calif. 16 22 40 20 144 118 90 276 1,426 1,913 105
Alaska - - - - 3 2 1 - 44 41 18
Hawaii 1 - - 1 2 4 1 1 83 83 -
Guam - 1 - - - - - 3 5 55 -
P.R. - - - - 3 - 110 123 88 38 28
V.I. - - - - - - - - - - -
Amer. Samoa - - - - - - - - - - -
C.N.M.I. - - - - - - 5 1 - - -
-------------------------------------------------------------------------------------------------------------------------------------------
N: Not notifiable U: Unavailable -: no reported cases
=======================================================================================================================================================
Return to top. Table_III Note: To print large tables and graphs users may have to change their printer settings to landscape and use a small font size.
TABLE III. (page 1) Provisional cases of selected notifiable diseases preventable by vaccination, United
States, weeks ending June 21, 1997, and June 22, 1996 (25th Week)
Hepatitis (Viral), by type Measles (Rubeola)
H. influenzae, --------------------------------------- ------------------------------------------------------------
invasive A B Indigenous Imported** Total
---------------- ----------------- ----------------- --------------- --------------- ---------------
Cum. Cum. Cum. Cum. Cum. Cum. Cum. Cum. Cum. Cum.
Reporting Area 1997* 1996 1997 1996 1997 1996 1997 1997 1997 1997 1997 1996
-----------------------------------------------------------------------------------------------------------------------------------------------------
UNITED STATES 549 586 12,793 13,000 4,042 4,452 - 46 - 20 66 256
NEW ENGLAND 30 14 274 154 72 95 - 8 - 1 9 11
Maine 3 - 41 12 6 2 - - - - - -
N.H. 2 9 17 5 5 7 U - U - - -
Vt. 2 - 7 3 2 8 - - - - - 1
Mass. 20 5 121 78 30 27 - 8 - - 8 9
R.I. 2 - 26 6 8 6 - - - - - -
Conn. 1 - 62 50 21 45 - - - 1 1 1
MID. ATLANTIC 64 122 939 850 553 723 - 11 - 4 15 21
Upstate N.Y. 7 32 129 186 112 171 - 1 - 3 4 4
N.Y. City 20 30 336 282 187 265 - 4 - 1 5 7
N.J. 27 33 168 189 127 143 - 1 - - 1 -
Pa. 10 27 306 193 127 144 - 5 - - 5 10
E.N. CENTRAL 80 99 1,304 1,184 429 533 - 4 - 3 7 16
Ohio 46 51 194 457 41 60 - - - - - 2
Ind. 8 7 146 159 49 73 - - - - - -
Ill. 18 30 268 279 93 154 - 4 - 1 5 3
Mich. 7 6 624 184 232 197 - - - 2 2 2
Wis. 1 5 72 105 14 49 - - - - - 9
W.N. CENTRAL 27 20 972 983 262 229 - 9 - 2 11 16
Minn. 17 10 91 50 23 19 - - - 2 2 14
Iowa 3 3 151 203 42 24 - - - - - -
Mo. 3 4 521 492 171 148 - 1 - - 1 1
N. Dak. - - 9 27 1 - U - U - - -
S. Dak. 2 1 14 39 - - - 8 - - 8 -
Nebr. 1 1 47 70 8 16 - - - - - -
Kans. 1 1 139 102 17 22 U - U - - 1
S. ATLANTIC 111 104 752 526 591 597 - 1 - 3 4 4
Del. - 1 12 6 3 4 - - - - - 1
Md. 44 35 130 97 87 78 - - - 1 1 -
D.C. 2 5 14 15 21 15 - - - 1 1 -
Va. 7 4 92 77 59 69 - - - - - 2
W. Va. 3 4 6 11 9 14 - - - - - -
N.C. 16 17 103 60 108 177 - - - 1 1 -
S.C. 4 3 63 30 59 40 - - - - - -
Ga. 20 27 128 41 57 7 - - - - - -
Fla. 15 8 204 189 188 193 - 1 - - 1 1
E.S. CENTRAL 35 18 324 778 346 395 - - - - - -
Ky. 5 5 40 16 20 39 - - - - - -
Tenn. 22 7 199 546 221 236 - - - - - -
Ala. 8 5 50 101 37 27 - - - - - -
Miss. - 1 35 115 68 U - - - - - -
W.S. CENTRAL 30 24 2,696 2,406 513 472 - 3 - 1 4 2
Ark. 1 - 136 242 30 43 - - - - - -
La. 6 1 109 67 64 55 - - - - - -
Okla. 18 21 830 995 17 23 - - - - - -
Tex. 5 2 1,621 1,102 402 351 - 3 - 1 4 2
MOUNTAIN 57 32 1,950 2,106 440 545 - 5 - - 5 61
Mont. - - 51 62 5 6 - - - - - -
Idaho 1 1 75 134 16 62 - - - - - 1
Wyo. - - 20 20 20 17 - - - - - -
Colo. 7 6 223 188 90 63 - - - - - 6
N. Mex. 7 8 157 244 153 178 - - - - - 2
Ariz. 23 12 977 802 89 127 - 5 - - 5 8
Utah 3 5 342 469 50 58 - - - - - 40
Nev. 16 - 105 187 17 34 U - U - - 4
PACIFIC 115 153 3,582 4,013 836 863 - 5 - 6 11 125
Wash. 2 2 261 261 34 50 - - - - - 37
Oreg. 20 21 187 540 55 58 - - - - - 6
Calif. 87 124 3,044 3,140 728 745 - 2 - 6 8 17
Alaska 1 4 21 28 13 4 - - - - - 63
Hawaii 5 2 69 44 6 6 - 3 - - 3 2
Guam - - - 6 1 - U - U - - -
P.R. - 1 166 101 619 494 - - - - - 1
V.I. - - - 23 - 20 U - U - - -
Amer. Samoa - - - - - - U - U - - -
C.N.M.I. 5 10 1 1 21 5 U 1 U - 1 -
-----------------------------------------------------------------------------------------------------------------------------------------------------
N: Not notifiable U: Unavailable -: no reported cases
* Of 120 cases among children aged <5 years, serotype was reported for 63 and of those, 24 were type b.
** For imported measles, cases include only those resulting from importation from other countries.
=======================================================================================================================================================
TABLE III. (page 2) Provisional cases of selected notifiable diseases preventable by vaccination, United
States, weeks ending June 21, 1997, and June 22, 1996 (25th Week)
Meningococcal
Disease Mumps Pertussis Rubella
----------------- -------------------------- --------------------------- ---------------------------
Cum. Cum. Cum. Cum. Cum. Cum. Cum. Cum.
Reporting Area 1997 1996 1997 1997 1996 1997 1997 1996 1997 1997 1996
------------------------------------------------------------------------------------------------------------------------------------------
UNITED STATES 1,920 1,836 12 312 354 46 2,312 1,718 - 47 124
NEW ENGLAND 112 77 - 7 - 3 498 335 - - 23
Maine 11 9 - - - - 6 9 - - -
N.H. 10 3 U - - U 61 19 U - -
Vt. 2 3 - - - 2 165 10 - - 2
Mass. 60 28 - 2 - 1 244 294 - - 19
R.I. 8 7 - 4 - - 12 - - - -
Conn. 21 27 - 1 - - 10 3 - - 2
MID. ATLANTIC 173 204 - 27 52 3 167 113 - 3 7
Upstate N.Y. 42 50 - 5 14 - 52 54 - 1 3
N.Y. City 31 29 - - 13 - 40 18 - 2 2
N.J. 40 45 - - 2 - 5 6 - - 2
Pa. 60 80 - 22 23 3 70 35 - - -
E.N. CENTRAL 263 262 1 32 81 10 180 241 - 3 3
Ohio 105 90 1 14 27 4 72 75 - - -
Ind. 32 37 - 4 5 2 29 14 - - -
Ill. 78 79 - 7 16 4 28 60 - - 1
Mich. 27 28 - 7 32 - 31 19 - - 2
Wis. 21 28 - - 1 - 20 73 - 3 -
W.N. CENTRAL 145 136 3 11 5 1 129 69 - - -
Minn. 19 14 1 4 1 1 85 43 - - -
Iowa 33 29 2 6 - - 16 3 - - -
Mo. 71 56 - - 2 - 16 15 - - -
N. Dak. 1 2 U - 2 U 2 - U - -
S. Dak. 4 4 - - - - 2 1 - - -
Nebr. 5 12 - 1 - - 3 2 - - -
Kans. 12 19 U - - U 5 5 U - -
S. ATLANTIC 346 279 5 46 48 12 212 168 - 21 22
Del. 4 2 - - - - - 13 - - -
Md. 33 32 - 4 16 1 74 56 - - -
D.C. 1 4 - - - - 2 - - - 1
Va. 33 33 2 6 4 6 25 19 - 1 2
W. Va. 13 12 - - - - 4 2 - - -
N.C. 59 48 - 7 10 - 46 34 - 10 8
S.C. 41 37 1 10 5 3 11 6 - 9 1
Ga. 70 77 - 4 2 - 7 7 - - -
Fla. 92 34 2 15 11 2 43 31 - 1 10
E.S. CENTRAL 146 135 - 16 15 2 41 148 - - 2
Ky. 36 19 - 3 - - 2 128 - - -
Tenn. 50 41 - 3 1 2 19 12 - - -
Ala. 44 39 - 6 3 - 12 4 - - 2
Miss. 16 36 - 4 11 - 8 4 - - N
W.S. CENTRAL 200 205 1 34 27 1 41 55 - 4 7
Ark. 25 26 - - - - 7 2 - - -
La. 38 35 - 11 10 - 11 4 - - 1
Okla. 23 20 - - - 1 6 4 - - -
Tex. 114 124 1 23 17 - 17 45 - 4 6
MOUNTAIN 114 115 2 43 14 12 702 174 - 4 6
Mont. 8 5 - - - - 8 6 - - -
Idaho 9 16 - 2 - 4 511 60 - 1 2
Wyo. 1 3 - 1 - - 4 1 - - -
Colo. 32 19 - 3 2 8 127 36 - - 2
N. Mex. 18 20 N N N - 31 30 - - -
Ariz. 29 28 2 29 1 - 15 12 - 3 1
Utah 11 11 - 6 2 - 4 5 - - -
Nev. 6 13 U 2 9 U 2 24 U - 1
PACIFIC 421 423 - 96 112 2 342 415 - 12 54
Wash. 51 54 - 12 13 2 179 162 - - 12
Oreg. 87 74 - 1 - - 17 33 - - 1
Calif. 280 289 - 71 82 - 139 208 - 7 38
Alaska 1 4 - 2 2 - 1 1 - - -
Hawaii 2 2 - 10 15 - 6 11 - 5 3
Guam - 1 U 1 4 U - - U - -
P.R. 8 7 - 4 1 - - 2 - - -
V.I. - - U - 1 U - - U - -
Amer. Samoa - - U - - U - - U - -
C.N.M.I. - - U 4 - U - - U - -
------------------------------------------------------------------------------------------------------------------------------------------
N: Not notifiable U: Unavailable -: no reported cases
=======================================================================================================================================================
Return to top. Table_IV Note: To print large tables and graphs users may have to change their printer settings to landscape and use a small font size.
TABLE IV. Deaths in 122 U.S. cities,* week ending
June 21, 1997 (25th Week)
===================================================================================================================================
All Causes, By Age (Years)
------------------------------------------------------------------------ P&I**
Reporting Area All Ages >=65 45-64 25-44 1-24 <1 Total
---------------------------------------------------------------------------------------------------------------
NEW ENGLAND 509 370 89 34 12 4 36
Boston, Mass. 165 109 39 8 8 1 17
Bridgeport, Conn. U U U U U U U
Cambridge, Mass. 19 16 2 1 - - 1
Fall River, Mass. 22 16 6 - - - -
Hartford, Conn. 50 31 12 5 1 1 1
Lowell, Mass. 18 12 3 3 - - 3
Lynn, Mass. 11 8 1 2 - - 1
New Bedford, Mass. 18 15 2 1 - - 1
New Haven, Conn. 28 22 2 3 - 1 1
Providence, R.I. 54 45 4 4 1 - 2
Somerville, Mass. 5 4 1 - - - -
Springfield, Mass. 43 35 4 3 1 - 5
Waterbury, Conn. 21 15 5 1 - - -
Worcester, Mass. 55 42 8 3 1 1 4
MID. ATLANTIC 2,403 1,652 472 197 46 36 119
Albany, N.Y. 41 27 10 2 1 1 5
Allentown, Pa. 16 12 4 - - - 1
Buffalo, N.Y. 63 48 10 3 1 1 1
Camden, N.J. 25 10 7 4 3 1 2
Elizabeth, N.J. 15 9 6 - - - 1
Erie, Pa. 49 36 10 2 - 1 -
Jersey City, N.J. 48 30 12 4 - 2 3
New York City, N.Y. 1,207 840 222 108 18 19 53
Newark, N.J. 47 22 13 11 1 - 3
Paterson, N.J. 27 14 9 3 1 - -
Philadelphia, Pa. 500 326 106 45 16 7 22
Pittsburgh, Pa.*** 70 52 11 4 2 1 6
Reading, Pa. 12 9 3 - - - 1
Rochester, N.Y. 125 90 26 7 - 2 7
Schenectady, N.Y. 18 16 2 - - - 1
Scranton, Pa. 28 23 4 - 1 - 2
Syracuse, N.Y. 72 60 8 2 1 1 11
Trenton, N.J. 14 6 7 1 - - -
Utica, N.Y. 26 22 2 1 1 - -
Yonkers, N.Y. U U U U U U U
E.N. CENTRAL 1,940 1,289 394 163 52 41 122
Akron, Ohio 28 16 1 5 3 3 -
Canton, Ohio 30 18 6 3 - 3 4
Chicago, Ill. 409 244 91 52 9 12 28
Cincinnati, Ohio 123 90 24 4 1 4 12
Cleveland, Ohio 127 77 29 15 4 2 4
Columbus, Ohio 138 99 29 7 1 2 6
Dayton, Ohio 128 97 21 6 3 1 15
Detroit, Mich. 237 133 63 28 9 4 11
Evansville, Ind. 48 34 8 4 2 - -
Fort Wayne, Ind. 50 29 12 6 3 - 3
Gary, Ind. 10 5 1 3 1 - -
Grand Rapids, Mich. 59 44 10 4 1 - 3
Indianapolis, Ind. 140 88 34 7 8 3 8
Lansing, Mich. 36 28 4 1 1 2 3
Milwaukee, Wis. 122 89 20 6 3 4 6
Peoria, Ill. 34 29 5 - - - 1
Rockford, Ill. 45 35 4 6 - - 4
South Bend, Ind. 28 22 4 1 - 1 2
Toledo, Ohio 83 59 19 3 2 - 6
Youngstown, Ohio 65 53 9 2 1 - 6
W.N. CENTRAL 674 480 107 52 14 18 32
Des Moines, Iowa U U U U U U U
Duluth, Minn. 31 25 5 - - 1 2
Kansas City, Kans. 27 18 5 3 - 1 -
Kansas City, Mo. 101 67 17 6 6 2 1
Lincoln, Nebr. 26 18 5 3 - - -
Minneapolis, Minn. 187 129 36 14 2 6 13
Omaha, Nebr. 73 50 13 3 2 5 6
St. Louis, Mo. 93 65 11 12 3 2 2
St. Paul, Minn. 64 47 8 8 1 - 7
Wichita, Kans. 72 61 7 3 - 1 1
S. ATLANTIC 1,248 774 283 112 40 37 58
Atlanta, Ga. 109 60 28 12 4 5 3
Baltimore, Md. 239 128 61 30 11 9 19
Charlotte, N.C. 73 48 15 6 - 4 7
Jacksonville, Fla. 118 82 26 5 3 2 3
Miami, Fla. 115 68 28 12 4 3 1
Norfolk, Va. 39 26 6 2 2 3 4
Richmond, Va. 87 51 23 5 6 2 3
Savannah, Ga. 38 20 12 4 2 - 4
St. Petersburg, Fla. 68 51 10 6 - 1 2
Tampa, Fla. 188 139 36 6 2 5 11
Washington, D.C. 153 84 35 23 6 3 1
Wilmington, Del. 21 17 3 1 - - -
E.S. CENTRAL 605 426 123 34 12 10 49
Birmingham, Ala. 153 119 22 7 3 2 19
Chattanooga, Tenn. 53 43 6 3 1 - 6
Knoxville, Tenn. 69 43 20 5 1 - 1
Lexington, Ky. 75 53 19 2 - 1 10
Memphis, Tenn. U U U U U U U
Mobile, Ala. 77 58 12 6 1 - 1
Montgomery, Ala. 46 30 11 - 2 3 1
Nashville, Tenn. 132 80 33 11 4 4 11
W.S. CENTRAL 1,467 941 314 133 53 26 91
Austin, Tex. 64 38 14 4 5 3 4
Baton Rouge, La. 47 31 7 6 3 - 4
Corpus Christi, Tex. 58 40 14 2 1 1 6
Dallas, Tex. 164 106 28 19 3 8 6
El Paso, Tex. 79 53 14 8 4 - 9
Ft. Worth, Tex. 133 99 25 7 1 1 7
Houston, Tex. 420 245 101 52 18 4 30
Little Rock, Ark. 63 32 22 5 1 3 2
New Orleans, La. 51 28 15 5 1 2 -
San Antonio, Tex. 220 149 47 10 10 4 10
Shreveport, La. 72 45 15 7 5 - 6
Tulsa, Okla. 96 75 12 8 1 - 7
MOUNTAIN 727 501 142 50 17 17 39
Albuquerque, N.M. 83 60 12 8 2 1 2
Boise, Idaho 43 32 6 3 1 1 1
Colo. Springs, Colo. 50 42 4 - 2 2 2
Denver, Colo. 105 70 16 12 1 6 11
Las Vegas, Nev. 183 113 48 14 5 3 8
Ogden, Utah 17 12 4 - 1 - 1
Phoenix, Ariz. U U U U U U U
Pueblo, Colo. 20 15 3 1 1 - 1
Salt Lake City, Utah 90 62 14 10 2 2 5
Tucson, Ariz. 136 95 35 2 2 2 8
PACIFIC 1,786 1,249 311 143 47 36 119
Berkeley, Calif. 19 11 5 3 - - 1
Fresno, Calif. 64 45 10 5 4 - 5
Glendale, Calif. 27 25 2 - - - 1
Honolulu, Hawaii 105 76 16 10 1 2 9
Long Beach, Calif. 66 48 13 4 1 - 6
Los Angeles, Calif. 526 383 73 48 12 10 27
Pasadena, Calif. 9 8 1 - - - 1
Portland, Oreg. 122 88 22 7 3 2 -
Sacramento, Calif. 155 107 29 13 5 1 24
San Diego, Calif. 136 90 28 10 5 3 14
San Francisco, Calif. 81 52 15 11 2 1 11
San Jose, Calif. 180 120 42 10 3 5 14
Santa Cruz, Calif. 25 18 5 2 - - 3
Seattle, Wash. 113 66 27 13 5 2 -
Spokane, Wash. 63 42 14 3 2 2 1
Tacoma, Wash. 95 70 9 4 4 8 2
TOTAL 11,359**** 7,682 2,235 918 293 225 665
---------------------------------------------------------------------------------------------------------------
U: Unavailable -: no reported cases
* Mortality data in this table are voluntarily reported from 122 cities in the United States, most of which have populations
of 100,000 or more. A death is reported by the place of its occurrence and by the week that the death certificate was
filed. Fetal deaths are not included.
** Pneumonia and influenza.
*** Because of changes in reporting methods in these 3 Pennsylvania cities, these numbers are partial counts for the current
week. Complete counts will be available in 4 to 6 weeks.
**** Total includes unknown ages.
===================================================================================================================================
Return to top. Disclaimer All MMWR HTML versions of articles are electronic conversions from ASCII text into HTML. This conversion may have resulted in character translation or format errors in the HTML version. Users should not rely on this HTML document, but are referred to the electronic PDF version and/or the original MMWR paper copy for the official text, figures, and tables. An original paper copy of this issue can be obtained from the Superintendent of Documents, U.S. Government Printing Office (GPO), Washington, DC 20402-9371; telephone: (202) 512-1800. Contact GPO for current prices. **Questions or messages regarding errors in formatting should be addressed to mmwrq@cdc.gov.Page converted: 09/19/98 |
|||||||||
This page last reviewed 5/2/01
|