 |
|
|
|
|
|
|
| ||||||||||
|
|
|
|
|
|
|
||||
| ||||||||||
|
|
|
|
|
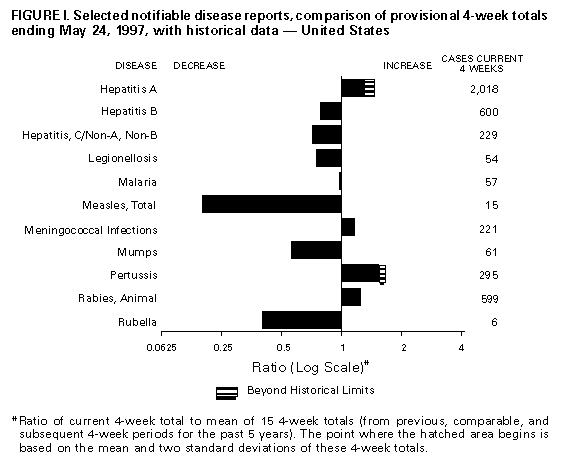
Persons using assistive technology might not be able to fully access information in this file. For assistance, please send e-mail to: mmwrq@cdc.gov. Type 508 Accommodation and the title of the report in the subject line of e-mail. Notifiable Diseases/Deaths in Selected Cities Weekly InformationFigure_I Selected notifiable disease reports, comparison of provisional 4-week totals ending May 24, 1997, with historical data -- United States Table_I Summary -- provisional cases of selected notifiable diseases, United States, cumulative, week ending May 24, 1997 (21st Week) Table_II Provisional cases of selected notifiable diseases, United States, weeks ending May 24, 1997 and May 25, 1996 (21st Week) Table_III Provisional cases of selected notifiable diseases preventable by vaccination, United States, weeks ending May 24, 1997 and May 25, 1996 (21st Week) Table_IV Deaths in 122 U.S. cities, week ending
May 24, 1997 (21st Week)
TABLE I. Summary -- provisional cases of specified notifiable diseases, United
States, cumulative, week ending May 24, 1997 (21st Week)
==================================================================================
                                             Cum. 1997
------------------------------------------------------
Anthrax                                              -
Brucellosis                                         16
Cholera                                              2
Congenital rubella syndrome                          2
Cryptosporidiosis*                                 449
Diphtheria                                           4
Encephalitis:  California*                           4
               eastern equine*                       -
               St. Louis*                            1
               western equine*                       -
Hansen Disease                                      45
Hantavirus pulmonary syndrome*+                      4
Hemolytic uremic syndrome, post-diarrheal*          17
HIV infection, pediatric*&                          92
Plague                                               1
Poliomyelitis, paralytic                             -
Psittacosis                                         15
Rabies, human                                        2
Rocky Mountain spotted fever (RMSF)                 53
Streptococcal disease, invasive Group A            555
Streptococcal toxic-shock syndrome*                 13
Syphilis, congenital@                               62
Tetanus                                             12
Toxic-shock syndrome                                44
Trichinosis                                          3
Typhoid fever                                      103
Yellow fever                                         -
------------------------------------------------------
-: no reported cases
 * Not notifiable in all states
 + Updated weekly from reports to the Division of Viral and Rickettsial
   Diseases, National Center for Infectious Diseases (NCID).
 & Updated monthly to the Division of HIV/AIDS Prevention, National Center
   for HIV, STD, and TB Prevention (NCHSTP), last update April 29, 1997.
 @ Updated quarterly from reports to the Division of STD Prevention,
   NCHSTP.

==================================================================================
Return to top. Table_II Note: To print large tables and graphs users may have to change their printer settings to landscape and use a small font size.
TABLE II. (page 1) Provisional cases of selected notifiable diseases, United States, weeks ending
May 24, 1997, and May 25, 1996 (21st Week)
Escherichia
coli O157:H7
------------------- Hepatitis
AIDS* Chlamydia NETSS** PHLIS*** Gonorrhea C\NA,NB
----------------- -------------------- -------- -------- ------------------- ----------------
Cum. Cum. Cum. Cum. Cum. Cum. Cum. Cum. Cum. Cum.
Reporting Area 1997 1996 1997 1996 1997 1997 1997 1996 1997 1996
------------------------------------------------------------------------------------------------------------------------------
UNITED STATES 20,222 26,546 154,813 164,191 424 177 97,789 121,599 1,174 1,304
NEW ENGLAND 671 942 6,432 7,532 33 16 2,144 3,126 18 41
Maine 25 15 369 U 1 - 22 20 - -
N.H. 8 31 277 293 2 - 50 59 3 2
Vt. 16 9 158 176 2 1 21 25 - 12
Mass. 282 549 2,805 2,665 24 15 893 865 13 24
R.I. 55 61 845 847 1 - 198 214 2 3
Conn. 285 277 1,978 3,551 3 - 960 1,943 - -
MID. ATLANTIC 6,683 7,577 18,485 28,611 32 4 11,041 17,169 134 108
Upstate N.Y. 1,143 794 N N 19 3 2,058 2,744 106 86
N.Y. City 3,308 4,474 9,220 15,210 5 - 4,219 6,660 - 2
N.J. 1,444 1,414 2,856 5,887 8 - 1,640 3,634 - -
Pa. 788 895 6,409 7,514 N 1 3,124 4,131 28 20
E.N. CENTRAL 1,416 2,208 23,932 36,039 71 25 14,372 23,251 237 212
Ohio 270 487 5,455 8,195 22 10 3,499 5,734 7 4
Ind. 302 306 3,316 3,891 13 5 2,307 2,643 5 6
Ill. 509 980 4,540 10,240 16 - 2,225 6,760 20 51
Mich. 259 318 7,672 9,285 20 2 5,073 6,165 205 151
Wis. 76 117 2,949 4,428 N 8 1,268 1,949 - -
W.N. CENTRAL 383 570 8,959 13,242 54 39 4,250 6,656 68 28
Minn. 79 125 U 2,293 29 20 U 1,659 2 -
Iowa 59 43 1,895 1,624 12 8 488 428 16 10
Mo. 150 232 4,436 5,595 5 8 2,994 3,390 32 10
N. Dak. 4 5 339 425 3 2 23 12 2 -
S. Dak. 2 7 473 565 1 - 47 80 - -
Nebr. 35 39 374 810 2 - 115 166 1 4
Kans. 54 119 1,442 1,930 2 1 583 921 15 4
S. ATLANTIC 4,846 6,549 32,725 22,227 51 13 32,207 38,350 107 71
Del. 69 142 - - 1 1 443 588 - -
Md. 576 847 2,857 2,519 2 1 5,266 5,176 6 1
D.C. 282 431 N N - - 1,319 62 - -
Va. 421 359 4,297 4,790 N 5 3,220 3,892 8 7
W. Va. 27 50 1,387 849 N - 398 276 5 6
N.C. 281 280 6,743 U 14 6 6,322 7,785 23 19
S.C. 270 344 4,751 U 1 - 4,236 4,581 18 14
Ga. 683 868 3,482 4,735 15 - 4,551 8,850 U -
Fla. 2,237 3,228 9,208 9,287 18 - 6,452 7,140 47 24
E.S. CENTRAL 609 870 12,948 12,146 34 7 12,814 12,675 150 252
Ky. 60 152 2,674 2,833 10 - 1,628 1,685 7 12
Tenn. 285 310 5,013 5,179 18 7 4,211 4,449 88 207
Ala. 151 276 3,071 3,525 3 - 4,350 5,386 5 1
Miss. 113 132 2,190 609 3 - 2,625 1,155 50 32
W.S. CENTRAL 2,040 2,638 19,688 8,623 24 4 13,129 8,156 126 148
Ark. 83 121 474 656 2 1 986 1,639 - 3
La. 385 649 3,194 2,744 3 3 3,029 2,932 79 67
Okla. 116 100 2,983 2,790 1 - 1,866 1,757 4 43
Tex. 1,456 1,768 13,037 2,433 18 - 7,248 1,828 43 35
MOUNTAIN 601 785 9,689 6,332 44 25 2,886 3,143 147 269
Mont. 16 10 311 513 3 - 14 13 5 9
Idaho 18 10 590 642 10 1 44 36 20 67
Wyo. 11 2 211 295 3 - 24 13 57 85
Colo. 156 245 1,733 8 16 8 751 712 18 25
N. Mex. 58 45 1,421 1,595 4 3 534 358 27 34
Ariz. 158 233 3,694 1,469 N 10 1,142 1,536 15 28
Utah 41 85 674 624 5 - 88 122 2 11
Nev. 143 155 1,055 1,186 3 3 289 353 3 10
PACIFIC 2,973 4,407 21,955 29,439 81 41 4,946 9,073 187 175
Wash. 241 309 3,716 4,094 17 4 799 941 10 26
Oreg. 128 223 1,410 2,250 26 15 217 201 4 3
Calif. 2,570 3,784 15,675 22,004 35 19 3,582 7,534 109 63
Alaska 12 11 551 374 3 - 181 188 - 2
Hawaii 22 80 603 717 N 3 167 209 64 81
Guam 2 3 31 176 N - 3 29 - 5
P.R. 520 423 N N 21 U 248 121 43 13
V.I. 29 9 N N N U - - - -
Amer. Samoa - - - - N U - - - -
C.N.M.I. - - N N N U 11 11 2 -
------------------------------------------------------------------------------------------------------------------------------
N: Not notifiable U: Unavailable -: no reported cases C.N.M.I.: Commonwealth of North Mariana Islands
* Updated monthly to the Division of HIV/AIDS Prevention, National Center for HIV, STD, and TB Prevention, last update April 29, 1997.
** National Electronic Telecommunications System for Surveillance.
*** Public Health Laboratory Information System.
=======================================================================================================================================================
TABLE II. (page 2) Provisional cases of selected notifiable diseases, United States, weeks ending
May 24, 1997, and May 25, 1996 (21st Week)
Lyme Syphilis Rabies,
Legionellosis Disease Malaria (Primary & Secondary) Tuberculosis Animal
---------------- ---------------- ---------------- --------------------- ----------------- -------
Cum. Cum. Cum. Cum. Cum. Cum. Cum. Cum. Cum. Cum. Cum.
Reporting Area 1997 1996 1997 1996 1997 1996 1997 1996 1997 1996 1997
-------------------------------------------------------------------------------------------------------------------------------------------
UNITED STATES 324 295 1,039 1,584 455 456 3,219 4,709 5,450 6,908 2,820
NEW ENGLAND 24 15 222 173 14 14 62 74 135 206 429
Maine 1 1 3 2 1 3 - - 2 8 92
N.H. 4 - 5 3 1 1 - 1 1 4 19
Vt. 3 2 3 - 1 2 - - 2 - 69
Mass. 8 6 51 16 9 5 35 31 84 58 86
R.I. 4 6 34 21 2 3 - - 13 20 8
Conn. 4 N 126 131 - - 27 42 33 116 155
MID. ATLANTIC 54 66 636 1,234 110 136 149 209 1,203 1,182 616
Upstate N.Y. 11 14 95 591 22 28 14 24 158 128 452
N.Y. City - 4 6 64 55 73 33 68 641 613 -
N.J. 7 7 139 144 24 26 61 72 241 267 59
Pa. 36 41 396 435 9 9 41 45 163 174 105
E.N. CENTRAL 119 107 20 16 30 59 282 786 636 741 50
Ohio 68 38 16 9 4 6 99 309 136 109 39
Ind. 15 27 4 5 3 4 67 108 57 76 5
Ill. - 14 - 2 5 29 24 212 296 407 2
Mich. 31 18 - - 15 11 45 71 102 116 3
Wis. 5 10 U U 3 9 47 86 45 33 1
W.N. CENTRAL 30 18 11 42 13 11 53 185 188 197 164
Minn. 1 1 9 1 5 3 U 22 48 48 16
Iowa 7 2 - 5 5 1 3 13 20 23 66
Mo. 6 4 - 17 2 5 33 134 81 76 8
N. Dak. 2 - - - - - - - 4 2 22
S. Dak. 1 2 - - - - - - 2 13 17
Nebr. 9 7 2 - 1 - 1 6 4 13 1
Kans. 4 2 - 19 - 2 16 10 29 22 34
S. ATLANTIC 50 32 99 60 114 73 1,320 1,546 1,160 1,260 1,205
Del. 4 2 - 32 2 2 11 16 7 22 28
Md. 16 5 73 6 33 21 340 252 118 101 212
D.C. 2 1 5 1 6 3 41 8 35 54 2
Va. 8 10 - - 22 8 116 199 111 118 253
W. Va. - 1 - 3 - 1 1 2 21 23 31
N.C. 5 3 7 12 6 8 291 440 132 158 374
S.C. 2 3 1 2 7 3 168 186 125 141 57
Ga. - - 1 - 12 8 229 286 215 262 112
Fla. 13 7 12 4 26 19 123 157 396 381 136
E.S. CENTRAL 10 18 25 22 13 13 755 1,146 444 534 107
Ky. - 2 2 6 2 3 68 60 79 96 11
Tenn. 5 8 10 6 4 5 322 379 120 169 69
Ala. 1 1 2 1 4 2 195 236 170 180 27
Miss. 4 7 11 9 3 3 170 471 75 89 -
W.S. CENTRAL 4 2 4 7 5 11 443 479 140 760 117
Ark. - - - 4 1 - 29 120 80 73 19
La. 1 - 1 - 4 1 163 223 - 3 1
Okla. - 2 2 2 - - 51 62 60 62 50
Tex. 3 - 1 1 - 10 200 74 U 622 47
MOUNTAIN 18 17 2 - 29 26 65 58 211 224 37
Mont. 1 1 - - 2 2 - - 2 7 6
Idaho 2 - - - - - - 1 4 4 -
Wyo. 1 2 1 - 1 2 - 1 2 3 12
Colo. 3 6 - - 14 13 2 17 44 41 -
N. Mex. 1 - - - 4 1 - - 8 34 3
Ariz. 5 4 1 - 4 3 54 35 97 91 15
Utah 4 1 - - 1 3 3 - 10 10 -
Nev. 1 3 - - 3 2 6 4 44 34 1
PACIFIC 15 20 20 30 127 113 90 226 1,333 1,804 95
Wash. 4 1 - 1 8 7 6 2 82 107 -
Oreg. - - 8 9 8 8 3 4 58 72 1
Calif. 10 19 12 19 107 93 79 219 1,090 1,522 81
Alaska - - - - 2 1 1 - 36 39 13
Hawaii 1 - - 1 2 4 1 1 67 64 -
Guam - - - - - - - 3 5 45 -
P.R. - - - - 3 - 88 52 88 58 25
V.I. - - - - - - - - - - -
Amer. Samoa - - - - - - - - - - -
C.N.M.I. - - - - - - 4 1 - - -
-------------------------------------------------------------------------------------------------------------------------------------------
N: Not notifiable U: Unavailable -: no reported cases
=======================================================================================================================================================
Return to top. Table_III Note: To print large tables and graphs users may have to change their printer settings to landscape and use a small font size.
TABLE III. (page 1) Provisional cases of selected notifiable diseases preventable by vaccination, United
States, weeks ending May 24, 1997, and May 25, 1996 (21st Week)
Hepatitis (Viral), by type Measles (Rubeola)
H. influenzae, --------------------------------------- ------------------------------------------------------------
invasive A B Indigenous Imported** Total
---------------- ----------------- ----------------- --------------- --------------- ---------------
Cum. Cum. Cum. Cum. Cum. Cum. Cum. Cum. Cum. Cum.
Reporting Area 1997* 1996 1997 1996 1997 1996 1997 1997 1997 1997 1997 1996
-----------------------------------------------------------------------------------------------------------------------------------------------------
UNITED STATES 460 503 10,740 10,668 3,282 3,644 1 31 - 14 45 168
NEW ENGLAND 26 11 233 130 72 86 - - - - - 6
Maine 3 - 35 10 5 2 - - - - - -
N.H. 2 6 16 4 5 6 U - U - - -
Vt. - - 6 3 1 5 - - - - - 1
Mass. 18 5 101 64 42 21 - - - - - 4
R.I. 2 - 22 4 8 5 - - - - - -
Conn. 1 - 53 45 11 47 - - - - - 1
MID. ATLANTIC 53 99 779 712 443 602 - 7 - 4 11 12
Upstate N.Y. 4 24 101 152 89 135 - 1 - 3 4 4
N.Y. City 17 23 274 250 144 232 - 4 - 1 5 7
N.J. 23 30 146 152 104 120 - 1 - - 1 -
Pa. 9 22 258 158 106 115 - 1 - - 1 1
E.N. CENTRAL 64 87 1,152 1,024 364 454 - 4 - 2 6 12
Ohio 41 49 173 408 39 51 - - - - - 2
Ind. 5 3 124 137 35 61 - - - - - -
Ill. 11 25 228 236 78 132 - 4 - 1 5 2
Mich. 6 5 564 148 198 171 - - - 1 1 2
Wis. 1 5 63 95 14 39 - - - - - 6
W.N. CENTRAL 20 17 779 820 207 184 - 9 - 1 10 15
Minn. 12 10 69 37 18 13 - - - 1 1 14
Iowa 2 2 104 171 29 21 - - - - - -
Mo. 2 3 408 401 136 118 - 1 - - 1 1
N. Dak. - - 7 22 1 - U - U - - -
S. Dak. 2 1 12 35 - - - 8 - - 8 -
Nebr. 1 1 56 97 9 14 - - - - - -
Kans. 1 - 123 57 14 18 - - - - - -
S. ATLANTIC 104 92 649 386 470 456 1 1 - 2 3 4
Del. - 1 11 5 2 2 - - - - - 1
Md. 38 31 118 84 72 70 - - - 1 1 -
D.C. 2 4 13 15 18 15 - - - 1 1 -
Va. 6 4 73 61 45 62 - - - - - 2
W. Va. 3 4 5 10 6 11 - - - - - -
N.C. 14 14 90 49 93 129 - - - - - -
S.C. 4 3 54 29 42 38 - - - - - -
Ga. 17 26 117 15 47 7 - - - - - -
Fla. 20 5 168 118 145 122 1 1 - - 1 1
E.S. CENTRAL 32 17 313 713 290 342 - - - - - -
Ky. 5 4 29 14 14 35 - - - - - -
Tenn. 19 7 203 509 179 207 - - - - - -
Ala. 8 5 46 94 29 22 - - - - - -
Miss. - 1 35 96 68 U U - U - - -
W.S. CENTRAL 23 19 2,293 1,721 412 321 - 3 - 1 4 2
Ark. 1 - 121 214 22 35 - - - - - -
La. 3 1 84 53 45 46 - - - - - -
Okla. 14 17 705 772 11 19 - - - - - -
Tex. 5 1 1,383 682 334 221 - 3 - 1 4 2
MOUNTAIN 42 27 1,675 1,665 376 454 - 2 - - 2 15
Mont. - - 46 53 5 4 - - - - - -
Idaho 1 1 72 122 13 54 - - - - - 1
Wyo. - - 18 18 20 14 - - - - - -
Colo. 6 5 191 157 77 55 - - - - - 4
N. Mex. 3 7 119 208 133 150 - - - - - -
Ariz. 13 9 817 571 73 102 - 2 - - 2 3
Utah 3 5 307 388 38 52 - - - - - 3
Nev. 16 - 105 148 17 23 U - U - - 4
PACIFIC 96 134 2,867 3,497 648 745 - 5 - 4 9 102
Wash. 1 1 220 220 27 46 - - - - - 30
Oreg. 19 19 160 499 50 51 - - - - - 4
Calif. 70 110 2,413 2,711 553 645 U 2 U 4 6 3
Alaska 1 2 16 28 12 1 - - - - - 63
Hawaii 5 2 58 39 6 2 - 3 - - 3 2
Guam - - - 3 1 - U - U - - -
P.R. - - 152 24 531 82 - - - - - 2
V.I. - - - - - - U - U - - -
Amer. Samoa - - - - - - U - U - - -
C.N.M.I. 4 10 1 1 19 5 U 1 U - 1 -
-----------------------------------------------------------------------------------------------------------------------------------------------------
N: Not notifiable U: Unavailable -: no reported cases
* Of 95 cases among children aged <5 years, serotype was reported for 46 and of those, 18 were type b.
** For imported measles, cases include only those resulting from importation from other countries.
=======================================================================================================================================================
TABLE III. (page 2) Provisional cases of selected notifiable diseases preventable by vaccination, United
States, weeks ending May 24, 1997, and May 25, 1996 (21st Week)
Meningococcal
Disease Mumps Pertussis Rubella
----------------- -------------------------- --------------------------- ---------------------------
Cum. Cum. Cum. Cum. Cum. Cum. Cum. Cum.
Reporting Area 1997 1996 1997 1997 1996 1997 1997 1996 1997 1997 1996
------------------------------------------------------------------------------------------------------------------------------------------
UNITED STATES 1,645 1,533 5 264 285 30 2,004 1,337 1 21 85
NEW ENGLAND 99 57 - 7 - 1 448 236 - - 11
Maine 9 8 - - - - 6 10 - - -
N.H. 9 1 U - - U 57 16 U - -
Vt. 2 3 - - - - 159 7 - - 2
Mass. 54 20 - 2 - 1 209 200 - - 7
R.I. 7 5 - 4 - - 12 - - - -
Conn. 18 20 - 1 - - 5 3 - - 2
MID. ATLANTIC 140 149 - 24 39 - 140 92 - 1 5
Upstate N.Y. 37 38 - 4 9 - 52 49 - - 3
N.Y. City 24 26 - - 11 - 19 14 - 1 1
N.J. 31 34 - - 2 - 5 4 - - 1
Pa. 48 51 - 20 17 - 64 25 - - -
E.N. CENTRAL 223 233 2 29 74 1 154 199 - 2 3
Ohio 94 78 - 12 26 1 63 66 - - -
Ind. 25 32 - 4 5 - 22 12 - - -
Ill. 67 71 - 7 14 - 23 53 - - 1
Mich. 19 26 2 6 28 - 26 11 - - 2
Wis. 18 26 - - 1 - 20 57 - 2 -
W.N. CENTRAL 120 119 1 9 4 2 108 58 - - -
Minn. 12 14 - 3 1 2 67 38 - - -
Iowa 25 25 1 4 - - 15 2 - - -
Mo. 62 49 - - 1 - 16 11 - - -
N. Dak. 1 2 U - 2 U 2 - U - -
S. Dak. 4 3 - - - - 1 1 - - -
Nebr. 5 12 - 2 - - 2 2 - - -
Kans. 11 14 - - - - 5 4 - - -
S. ATLANTIC 299 236 - 39 33 4 182 120 - 2 12
Del. 4 2 - - - - - 11 - - -
Md. 31 26 - 4 15 1 68 52 - - -
D.C. 1 3 - - - - 2 - - - 1
Va. 27 28 - 4 3 - 19 5 - 1 -
W. Va. 10 10 - - - - 3 2 - - -
N.C. 49 36 - 6 - - 35 24 - - -
S.C. 39 33 - 9 5 - 8 1 - 1 1
Ga. 58 72 - 4 2 1 7 7 - - -
Fla. 80 26 - 12 8 2 40 18 - - 10
E.S. CENTRAL 128 118 - 15 11 1 37 127 - - -
Ky. 32 17 - 2 - - 2 110 - - -
Tenn. 48 35 - 4 1 - 16 11 - - -
Ala. 32 34 - 5 3 1 11 3 - - -
Miss. 16 32 U 4 7 U 8 3 U - N
W.S. CENTRAL 168 175 1 29 23 - 31 42 1 4 7
Ark. 23 24 - - - - 5 2 - - -
La. 29 35 - 7 9 - 7 4 - - 1
Okla. 21 14 - - - - 5 4 - - -
Tex. 95 102 1 22 14 - 14 32 1 4 6
MOUNTAIN 101 90 - 34 13 19 617 153 - 2 5
Mont. 7 3 - - - - 5 5 - - -
Idaho 7 12 - 2 - 12 462 56 - - 2
Wyo. - - - 1 - 1 4 - - - -
Colo. 29 15 - 3 1 3 107 26 - - 1
N. Mex. 17 18 N N N 2 24 27 - - -
Ariz. 23 25 - 22 1 1 10 11 - 2 1
Utah 12 9 - 4 2 - 3 5 - - -
Nev. 6 8 U 2 9 U 2 23 U - 1
PACIFIC 367 356 1 78 88 2 287 310 - 10 42
Wash. 48 48 1 10 8 2 154 136 - - 7
Oreg. 79 67 - 1 - - 15 28 - - 1
Calif. 237 235 U 56 65 U 111 135 U 5 32
Alaska 1 4 - 2 2 - 1 1 - - -
Hawaii 2 2 - 9 13 - 6 10 - 5 2
Guam - 1 U 1 4 U - - U - -
P.R. 8 2 - 4 1 - - - - - -
V.I. - - U - - U - - U - -
Amer. Samoa - - U - - U - - U - -
C.N.M.I. - - U 1 - U - - U - -
------------------------------------------------------------------------------------------------------------------------------------------
N: Not notifiable U: Unavailable -: no reported cases
=======================================================================================================================================================
Return to top. Table_IV Note: To print large tables and graphs users may have to change their printer settings to landscape and use a small font size.
TABLE IV. Deaths in 122 U.S. cities,* week ending
May 24, 1997 (21st Week)
===================================================================================================================================
All Causes, By Age (Years)
------------------------------------------------------------------------ P&I**
Reporting Area All Ages >=65 45-64 25-44 1-24 <1 Total
---------------------------------------------------------------------------------------------------------------
NEW ENGLAND 515 366 95 37 10 7 35
Boston, Mass. 125 82 25 8 8 2 7
Bridgeport, Conn. 31 25 1 4 - 1 1
Cambridge, Mass. 13 10 1 2 - - 1
Fall River, Mass. 21 15 5 1 - - 3
Hartford, Conn. 22 18 3 1 - - -
Lowell, Mass. 23 17 2 4 - - -
Lynn, Mass. 19 16 3 - - - -
New Bedford, Mass. 19 17 1 1 - - -
New Haven, Conn. 46 31 7 6 1 1 2
Providence, R.I. 42 23 15 3 1 - 3
Somerville, Mass. 10 6 4 - - - -
Springfield, Mass. 43 37 5 - - 1 3
Waterbury, Conn. 58 38 15 4 - 1 5
Worcester, Mass. 43 31 8 3 - 1 10
MID. ATLANTIC 2,339 1,585 473 192 45 44 123
Albany, N.Y. 44 28 11 3 2 - 4
Allentown, Pa. 14 9 5 - - - 1
Buffalo, N.Y. 54 36 10 4 1 3 1
Camden, N.J. 37 22 10 3 1 1 5
Elizabeth, N.J. 20 13 3 3 1 - -
Erie, Pa. 41 32 7 2 - - 3
Jersey City, N.J. 41 28 8 3 1 1 2
New York City, N.Y. 1,172 782 246 108 19 17 47
Newark, N.J. 45 24 7 7 5 2 -
Paterson, N.J. 25 17 6 - 2 - -
Philadelphia, Pa. 400 272 76 35 9 8 25
Pittsburgh, Pa.*** 76 50 13 6 1 6 5
Reading, Pa. 9 8 1 - - - -
Rochester, N.Y. 135 92 29 11 2 1 10
Schenectady, N.Y. 27 20 5 2 - - 3
Scranton, Pa. 27 20 4 - 1 2 1
Syracuse, N.Y. 101 83 15 2 - 1 14
Trenton, N.J. 32 20 7 3 - 2 1
Utica, N.Y. 14 9 5 - - - -
Yonkers, N.Y. 25 20 5 - - - 1
E.N. CENTRAL 2,129 1,437 384 173 59 74 116
Akron, Ohio 55 40 12 1 1 1 -
Canton, Ohio 40 31 6 2 - 1 4
Chicago, Ill. 462 281 79 56 19 26 34
Cincinnati, Ohio 95 69 15 4 2 5 2
Cleveland, Ohio 159 105 30 9 8 7 -
Columbus, Ohio 206 141 37 17 6 5 14
Dayton, Ohio 134 100 25 5 2 2 4
Detroit, Mich. 194 111 46 20 8 8 5
Evansville, Ind. 60 43 11 6 - - 1
Fort Wayne, Ind. 47 30 12 4 - 1 2
Gary, Ind. 7 4 3 - - - -
Grand Rapids, Mich. 55 47 6 - 2 - 11
Indianapolis, Ind. 202 129 40 21 6 6 14
Lansing, Mich. U U U U U U U
Milwaukee, Wis. 126 95 13 14 1 3 11
Peoria, Ill. 48 36 4 5 1 2 5
Rockford, Ill. 42 29 10 2 1 - 2
South Bend, Ind. 45 32 8 2 - 3 2
Toledo, Ohio 87 62 17 3 2 3 4
Youngstown, Ohio 65 52 10 2 - 1 1
W.N. CENTRAL 845 610 148 52 16 13 41
Des Moines, Iowa 113 82 20 8 2 1 6
Duluth, Minn. 29 21 5 2 - 1 1
Kansas City, Kans. 44 30 7 2 3 2 2
Kansas City, Mo. 115 75 22 7 4 1 7
Lincoln, Nebr. 30 27 1 1 1 - 4
Minneapolis, Minn. 200 144 44 8 1 3 9
Omaha, Nebr. 90 68 14 4 1 3 3
St. Louis, Mo. 114 81 16 12 3 2 3
St. Paul, Minn. 51 40 7 3 1 - 6
Wichita, Kans. 59 42 12 5 - - -
S. ATLANTIC 1,229 812 264 111 27 15 74
Atlanta, Ga. 168 107 40 15 5 1 12
Baltimore, Md. 144 102 24 15 2 1 8
Charlotte, N.C. 60 45 7 6 - 2 4
Jacksonville, Fla. 146 92 34 15 4 1 7
Miami, Fla. 94 52 26 12 3 1 -
Norfolk, Va. 73 43 18 7 4 1 5
Richmond, Va. 87 56 21 7 3 - 9
Savannah, Ga. 48 37 8 2 1 - 8
St. Petersburg, Fla. 56 42 8 5 - 1 4
Tampa, Fla. 191 135 40 10 3 3 12
Washington, D.C. 151 90 38 17 2 4 5
Wilmington, Del. 11 11 - - - - -
E.S. CENTRAL 842 580 173 60 16 13 43
Birmingham, Ala. 180 131 34 10 3 2 6
Chattanooga, Tenn. 45 34 7 2 1 1 1
Knoxville, Tenn. 97 70 21 3 2 1 5
Lexington, Ky. 71 52 14 4 - 1 12
Memphis, Tenn. 153 96 34 15 4 4 14
Mobile, Ala. 125 82 29 9 2 3 -
Montgomery, Ala. 35 25 5 4 1 - -
Nashville, Tenn. 136 90 29 13 3 1 5
W.S. CENTRAL 1,343 890 238 123 48 44 85
Austin, Tex. 66 39 15 6 3 3 1
Baton Rouge, La. 25 14 5 3 2 1 -
Corpus Christi, Tex. 44 33 4 3 3 1 5
Dallas, Tex. 172 117 35 11 6 3 6
El Paso, Tex. 71 50 11 3 5 2 3
Ft. Worth, Tex. 103 72 20 5 2 4 7
Houston, Tex. 256 164 44 30 10 8 25
Little Rock, Ark. 68 42 16 5 1 4 5
New Orleans, La. 151 97 22 22 5 5 -
San Antonio, Tex. 192 132 33 19 2 6 15
Shreveport, La. 61 41 11 5 4 - 7
Tulsa, Okla. 134 89 22 11 5 7 11
MOUNTAIN 885 593 166 70 27 29 48
Albuquerque, N.M. 107 65 31 7 2 2 6
Boise, Idaho 41 32 5 2 - 2 3
Colo. Springs, Colo. 42 23 11 5 3 - 1
Denver, Colo. 84 57 16 4 3 4 8
Las Vegas, Nev. 172 120 29 14 5 4 7
Ogden, Utah 27 18 7 - 1 1 1
Phoenix, Ariz. 150 97 24 15 5 9 10
Pueblo, Colo. 26 18 6 2 - - -
Salt Lake City, Utah 103 67 21 8 5 2 6
Tucson, Ariz. 133 96 16 13 3 5 6
PACIFIC 1,256 882 219 105 20 29 106
Berkeley, Calif. 11 7 3 1 - - 1
Fresno, Calif. 103 59 20 15 4 5 3
Glendale, Calif. U U U U U U U
Honolulu, Hawaii 74 60 7 7 - - 9
Long Beach, Calif. 87 58 20 7 2 - 17
Los Angeles, Calif. U U U U U U U
Pasadena, Calif. U U U U U U U
Portland, Oreg. 114 81 22 6 1 4 3
Sacramento, Calif. 128 97 15 7 3 6 10
San Diego, Calif. 107 70 15 16 - 6 12
San Francisco, Calif. 147 97 28 18 2 1 17
San Jose, Calif. 185 140 33 10 2 - 18
Santa Cruz, Calif. 36 32 3 1 - - 6
Seattle, Wash. 111 74 26 7 3 1 3
Spokane, Wash. 73 53 11 6 2 1 5
Tacoma, Wash. 80 54 16 4 1 5 2
TOTAL 11,383**** 7,755 2,160 923 268 268 671
---------------------------------------------------------------------------------------------------------------
U: Unavailable -: no reported cases
* Mortality data in this table are voluntarily reported from 122 cities in the United States, most of which have populations
of 100,000 or more. A death is reported by the place of its occurrence and by the week that the death certificate was
filed. Fetal deaths are not included.
** Pneumonia and influenza.
*** Because of changes in reporting methods in these 3 Pennsylvania cities, these numbers are partial counts for the current
week. Complete counts will be available in 4 to 6 weeks.
**** Total includes unknown ages.
===================================================================================================================================
Return to top. Disclaimer All MMWR HTML versions of articles are electronic conversions from ASCII text into HTML. This conversion may have resulted in character translation or format errors in the HTML version. Users should not rely on this HTML document, but are referred to the electronic PDF version and/or the original MMWR paper copy for the official text, figures, and tables. An original paper copy of this issue can be obtained from the Superintendent of Documents, U.S. Government Printing Office (GPO), Washington, DC 20402-9371; telephone: (202) 512-1800. Contact GPO for current prices. **Questions or messages regarding errors in formatting should be addressed to mmwrq@cdc.gov.Page converted: 09/19/98 |
|||||||||
This page last reviewed 5/2/01
|