 |
|
|
|
|
|
|
| ||||||||||
|
|
|
|
|
|
|
||||
| ||||||||||
|
|
|
|
|
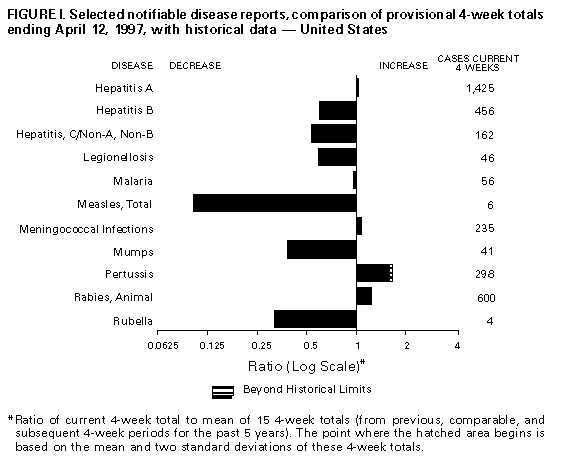
Persons using assistive technology might not be able to fully access information in this file. For assistance, please send e-mail to: mmwrq@cdc.gov. Type 508 Accommodation and the title of the report in the subject line of e-mail. Notifiable Diseases/Deaths in Selected Cities Weekly InformationFigure_I Selected notifiable disease reports, comparison of provisional 4-week totals ending April 12, 1997, with historical data -- United States Table_I Summary -- provisional cases of selected notifiable diseases, United States, cumulative, week ending April 12, 1997 (15th Week) Table_II Provisional cases of selected notifiable diseases, United States, weeks ending April 12, 1997 and April 13, 1996 (15th Week) Table_III Provisional cases of selected notifiable diseases preventable by vaccination, United States, weeks ending April 12, 1997 and April 13, 1996 (15th Week) Table_IV Deaths in 122 U.S. cities, week ending
April 12, 1997 (15th Week)
TABLE I. Summary -- provisional cases of specified notifiable diseases, United
States, cumulative, week ending April 12, 1997 (15th Week)
==================================================================================
                                             Cum. 1997
------------------------------------------------------
Anthrax                                              -
Brucellosis                                         11
Cholera                                              1
Congenital rubella syndrome                          2
Cryptosporidiosis*                                 307
Diphtheria                                           2
Encephalitis:  California*                           4
               eastern equine*                       -
               St. Louis*                            -
               western equine*                       -
Hansen Disease                                      33
Hantavirus pulmonary syndrome*+                      1
Hemolytic uremic syndrome, post-diarrheal*          10
HIV infection, pediatric*&                          53
Plague                                               -
Poliomyelitis, paralytic                             -
Psittacosis                                         14
Rabies, human                                        1
Rocky Mountain spotted fever (RMSF)                 27
Streptococcal disease, invasive Group A            309
Streptococcal toxic-shock syndrome*                  7
Syphilis, congenital@                               27
Tetanus                                             10
Toxic-shock syndrome                                29
Trichinosis                                          3
Typhoid fever                                       76
Yellow fever                                         -
------------------------------------------------------
-: no reported cases
 * Not notifiable in all states
 + Updated weekly from reports to the Division of Viral and Rickettsial
   Diseases, National Center for Infectious Diseases (NCID).
 & Updated monthly to the Division of HIV/AIDS Prevention, National Center
   for HIV, STD, and TB Prevention (NCHSTP), last update March 25, 1997.
 @ Updated quarterly from reports to the Division of STD Prevention,
   NCHSTP.

==================================================================================
Return to top. Table_II Note: To print large tables and graphs users may have to change their printer settings to landscape and use a small font size.
TABLE II. (page 1) Provisional cases of selected notifiable diseases, United States, weeks ending
April 12, 1997, and April 13, 1996 (15th Week)
Escherichia
coli O157:H7
------------------- Hepatitis
AIDS* Chlamydia NETSS** PHLIS*** Gonorrhea C\NA,NB
----------------- -------------------- -------- -------- ------------------- ----------------
Cum. Cum. Cum. Cum. Cum. Cum. Cum. Cum. Cum. Cum.
Reporting Area 1997 1996 1997 1996 1997 1997 1997 1996 1997 1996
------------------------------------------------------------------------------------------------------------------------------
UNITED STATES 15,582 18,023 99,089 110,715 267 119 65,737 84,860 774 834
NEW ENGLAND 465 746 4,622 5,355 20 10 1,725 2,189 11 22
Maine 18 10 284 - 1 - 14 13 - -
N.H. 4 23 145 192 - - 38 36 2 2
Vt. 10 7 120 142 1 1 15 17 - 10
Mass. 220 485 2,087 1,888 15 9 686 629 7 7
R.I. 43 38 610 620 1 - 155 161 2 3
Conn. 170 183 1,376 2,513 2 - 817 1,333 - -
MID. ATLANTIC 5,146 4,649 6,146 14,998 17 4 4,226 7,496 76 67
Upstate N.Y. 833 541 N N 9 3 942 22 57 58
N.Y. City 2,649 2,449 - 6,617 5 - - 3,777 - 1
N.J. 1,098 1,015 1,614 2,671 3 - 1,011 661 - -
Pa. 566 644 4,532 5,710 N 1 2,273 3,036 19 8
E.N. CENTRAL 1,088 1,493 17,237 25,918 50 18 10,716 17,276 166 145
Ohio 216 356 4,042 5,963 17 9 2,629 4,364 5 4
Ind. 286 264 2,541 2,454 11 2 1,748 1,835 4 4
Ill. 372 527 3,207 7,687 10 - 1,644 5,053 15 28
Mich. 158 254 5,425 6,590 12 2 3,766 4,618 142 109
Wis. 56 92 2,022 3,224 N 5 929 1,406 - -
W.N. CENTRAL 313 402 5,940 9,433 37 27 2,613 3,763 32 18
Minn. 55 84 - 1,369 23 17 U - - -
Iowa 52 31 1,424 943 8 4 364 274 15 7
Mo. 135 169 3,064 4,370 1 3 1,765 2,572 8 7
N. Dak. 4 1 81 300 3 2 5 9 2 -
S. Dak. 2 5 318 373 - - 36 60 - -
Nebr. 28 32 262 690 1 - 90 134 - 2
Kans. 37 80 791 1,388 1 1 353 714 7 2
S. ATLANTIC 3,895 4,940 22,718 15,619 37 5 23,778 29,910 69 50
Del. 51 93 - - 1 1 299 416 - -
Md. 425 643 1,936 1,710 2 1 3,739 3,877 4 -
D.C. 182 242 N N - - 1,268 1,269 - -
Va. 323 230 3,247 3,525 N - 2,538 2,920 4 3
W. Va. 21 25 - - N - 206 99 1 4
N.C. 217 196 4,963 U 7 3 4,545 5,367 17 14
S.C. 213 226 3,535 U - - 3,106 3,316 14 11
Ga. 528 681 2,402 3,697 13 - 3,378 7,191 U -
Fla. 1,935 2,604 6,635 6,687 14 - 4,699 5,455 29 18
E.S. CENTRAL 473 540 9,101 8,166 23 7 9,174 8,752 106 155
Ky. 48 88 1,833 2,018 6 - 1,160 1,150 6 9
Tenn. 203 200 3,421 3,472 13 7 2,958 3,016 55 145
Ala. 127 157 2,148 2,534 2 - 2,987 3,905 5 1
Miss. 95 95 1,699 142 2 - 2,069 681 40 -
W.S. CENTRAL 1,459 1,732 10,817 6,912 3 1 7,554 6,584 68 84
Ark. 59 95 372 423 2 - 710 1,153 2 1
La. 219 492 1,798 1,951 1 1 1,781 2,299 47 33
Okla. 86 52 2,200 2,105 - - 1,440 1,304 3 26
Tex. 1,095 1,093 6,447 2,433 - - 3,623 1,828 16 24
MOUNTAIN 441 570 6,063 3,537 29 19 2,040 2,216 105 180
Mont. 12 5 254 386 2 - 13 10 3 8
Idaho 8 7 449 479 3 - 33 27 14 38
Wyo. 9 2 133 197 1 - 17 10 41 54
Colo. 114 150 100 7 13 8 431 563 19 18
N. Mex. 34 25 1,136 1,120 4 3 390 280 15 27
Ariz. 122 191 2,749 76 N 6 878 1,006 8 23
Utah 30 62 432 460 3 - 49 88 2 7
Nev. 112 128 810 812 3 2 229 232 3 5
PACIFIC 2,302 2,951 16,445 20,777 51 26 3,911 6,674 141 113
Wash. 176 217 2,653 2,810 8 4 612 712 7 24
Oreg. 97 173 894 1,533 14 10 120 143 3 3
Calif. 2,002 2,521 12,059 15,671 26 10 2,910 5,509 86 43
Alaska 12 3 393 228 3 - 143 159 - 2
Hawaii 15 37 446 535 N 2 126 151 45 41
Guam - 3 - 99 N - - 22 - 1
P.R. 420 417 N N 13 U 264 60 24 13
V.I. 17 3 N N N U - - - -
Amer. Samoa - - - - N U - - - -
C.N.M.I. - - N N N U 10 11 2 -
------------------------------------------------------------------------------------------------------------------------------
N: Not notifiable U: Unavailable -: no reported cases C.N.M.I.: Commonwealth of North Mariana Islands
* Updated monthly to the Division of HIV/AIDS Prevention, National Center for HIV, STD, and TB Prevention, last update March 25, 1997.
** National Electronic Telecommunications System for Surveillance.
*** Public Health Laboratory Information System.
=======================================================================================================================================================
TABLE II. (page 2) Provisional cases of selected notifiable diseases, United States, weeks ending
April 12, 1997, and April 13, 1996 (15th Week)
Lyme Syphilis Rabies,
Legionellosis Disease Malaria (Primary & Secondary) Tuberculosis Animal
---------------- ---------------- ---------------- --------------------- ----------------- -------
Cum. Cum. Cum. Cum. Cum. Cum. Cum. Cum. Cum. Cum. Cum.
Reporting Area 1997 1996 1997 1996 1997 1996 1997 1996 1997 1996 1997
-------------------------------------------------------------------------------------------------------------------------------------------
UNITED STATES 234 215 643 1,239 316 280 2,173 3,464 3,603 4,408 1,814
NEW ENGLAND 19 6 69 98 6 8 43 54 89 109 289
Maine 1 1 2 - - 2 - - - 7 68
N.H. 3 - 4 2 - 1 - 1 1 3 11
Vt. 3 - 2 - 1 1 - - - - 45
Mass. 7 3 34 10 4 3 19 22 48 40 56
R.I. 1 2 27 21 1 1 - - 7 17 3
Conn. 4 N - 65 - - 24 31 33 42 106
MID. ATLANTIC 38 47 458 1,014 63 73 69 89 740 720 385
Upstate N.Y. 8 9 47 374 10 15 12 12 84 87 271
N.Y. City - 1 2 227 34 34 - 45 410 368 -
N.J. 4 7 107 85 14 19 33 - 159 160 34
Pa. 26 30 302 328 5 5 24 32 87 105 80
E.N. CENTRAL 89 82 14 7 25 34 209 568 442 538 16
Ohio 50 30 11 5 3 5 71 225 107 83 12
Ind. 10 21 3 2 3 2 49 76 39 46 2
Ill. - 10 - - 5 13 19 153 202 332 1
Mich. 27 15 - - 12 8 35 50 66 61 1
Wis. 2 6 U U 2 6 35 64 28 16 -
W.N. CENTRAL 16 13 9 26 8 4 40 165 122 126 110
Minn. - - 7 1 4 1 - 36 34 33 13
Iowa 2 1 - 3 2 1 3 6 15 13 46
Mo. 4 3 - 7 2 1 26 108 46 51 6
N. Dak. 1 - - - - - - - 2 1 14
S. Dak. 1 2 - - - - - - 2 9 17
Nebr. 5 6 2 - - - - 6 4 5 -
Kans. 3 1 - 15 - 1 11 9 19 14 14
S. ATLANTIC 36 26 60 58 86 48 909 1,143 747 632 832
Del. 3 1 - 18 2 2 8 12 7 12 12
Md. 14 5 42 27 24 15 208 177 68 67 150
D.C. 1 1 4 - 5 2 35 46 22 27 1
Va. 3 9 - - 18 6 96 139 86 43 169
W. Va. - 1 - 3 - - - 1 15 19 22
N.C. 5 3 2 6 5 6 230 293 98 99 264
S.C. 2 1 1 1 4 2 111 139 87 90 42
Ga. - - 1 - 10 7 145 250 120 155 81
Fla. 8 5 10 3 18 8 76 86 244 120 91
E.S. CENTRAL 7 15 18 14 7 6 541 852 244 348 75
Ky. - 3 1 5 1 2 51 47 55 64 8
Tenn. 3 7 4 3 2 3 222 283 34 96 51
Ala. 1 1 2 - 1 1 134 164 103 119 16
Miss. 3 4 11 6 3 - 134 358 52 69 -
W.S. CENTRAL - 1 3 4 4 10 265 378 86 497 38
Ark. - - - 3 1 - 23 82 59 43 10
La. - - 1 - 3 - 119 173 - - -
Okla. - 1 1 1 - - 37 49 27 46 28
Tex. - - 1 - - 10 86 74 - 408 -
MOUNTAIN 16 10 - - 18 18 41 43 119 145 11
Mont. 1 - - - 2 1 - - 2 - 2
Idaho 1 - - - - - - 1 2 3 -
Wyo. 1 - - - 1 2 - 1 1 1 -
Colo. 4 5 - - 9 10 - 14 25 24 -
N. Mex. - - - - 2 1 - - 8 21 1
Ariz. 4 2 - - 1 1 34 24 49 59 7
Utah 4 - - - - 2 1 - 4 10 -
Nev. 1 3 - - 3 1 6 3 28 27 1
PACIFIC 13 15 12 18 99 79 56 172 1,014 1,293 58
Wash. 2 1 - - 2 2 5 1 51 70 -
Oreg. - - 5 5 7 7 3 3 38 52 1
Calif. 10 14 7 12 88 67 47 167 843 1,100 49
Alaska - - - - 2 - - - 30 24 8
Hawaii 1 - - 1 - 3 1 1 52 47 -
Guam - - - - - - - 2 - 32 -
P.R. - - - - 2 - 82 37 - 47 16
V.I. - - - - - - - - - - -
Amer. Samoa - - - - - - - - - - -
C.N.M.I. - - - - - - 2 1 - - -
-------------------------------------------------------------------------------------------------------------------------------------------
N: Not notifiable U: Unavailable -: no reported cases
=======================================================================================================================================================
Return to top. Table_III Note: To print large tables and graphs users may have to change their printer settings to landscape and use a small font size.
TABLE III. (page 1) Provisional cases of selected notifiable diseases preventable by vaccination, United
States, weeks ending April 12, 1997, and April 13, 1996 (15th Week)
Hepatitis (Viral), by type Measles (Rubeola)
H. influenzae, --------------------------------------- ------------------------------------------------------------
invasive A B Indigenous Imported** Total
---------------- ----------------- ----------------- --------------- --------------- ---------------
Cum. Cum. Cum. Cum. Cum. Cum. Cum. Cum. Cum. Cum.
Reporting Area 1997* 1996 1997 1996 1997 1996 1997 1997 1997 1997 1997 1996
-----------------------------------------------------------------------------------------------------------------------------------------------------
UNITED STATES 318 353 7,119 7,655 2,153 2,508 2 17 1 8 25 84
NEW ENGLAND 11 9 142 83 44 54 - - - - - 6
Maine 2 - 17 9 3 2 - - - - - -
N.H. 1 7 9 3 5 3 - - - - - -
Vt. - - 4 1 1 2 - - - - - 1
Mass. 7 2 58 41 27 12 - - - - - 4
R.I. 1 - 11 3 6 4 - - - - - -
Conn. - - 43 26 2 31 - - - - - 1
MID. ATLANTIC 34 54 466 561 310 415 - 6 - 3 9 5
Upstate N.Y. 2 5 45 100 56 80 - 1 - 3 4 2
N.Y. City 12 9 171 264 103 191 - 4 - - 4 3
N.J. 13 21 102 114 75 88 - - - - - -
Pa. 7 19 148 83 76 56 - 1 - - 1 -
E.N. CENTRAL 44 66 615 706 244 320 1 4 1 2 6 4
Ohio 25 38 137 292 28 39 - - - - - 2
Ind. 4 2 89 106 25 36 - - - - - -
Ill. 9 18 121 154 41 97 1 4 1 1 5 -
Mich. 5 3 229 96 147 119 - - - 1 1 -
Wis. 1 5 39 58 3 29 - - - - - 2
W.N. CENTRAL 10 14 515 568 107 125 1 4 - - 4 3
Minn. 2 7 35 22 5 3 - - - - - 2
Iowa 3 3 78 136 36 18 - - - - - -
Mo. 1 3 269 274 47 81 1 4 - - 4 1
N. Dak. - - 5 9 1 - - - - - - -
S. Dak. 2 1 6 27 - - - - - - - -
Nebr. 1 - 35 57 6 7 - - - - - -
Kans. 1 - 87 43 12 16 - - - - - -
S. ATLANTIC 86 69 453 266 305 378 - - - - - 2
Del. - 1 10 5 1 1 - - - - - 1
Md. 26 21 103 56 50 88 - - - - - -
D.C. 2 - 11 7 18 5 - - - - - -
Va. 5 3 52 44 32 43 - - - - - -
W. Va. 1 2 5 6 6 9 - - - - - -
N.C. 12 13 62 33 63 103 - - - - - -
S.C. 4 3 35 25 28 28 - - - - - -
Ga. 16 23 40 2 14 3 - - - - - -
Fla. 20 3 135 88 93 98 - - - - - 1
E.S. CENTRAL 20 11 225 554 214 199 - - - - - -
Ky. 1 3 21 9 10 24 - - - - - -
Tenn. 14 3 138 413 130 158 - - - - - -
Ala. 5 4 35 75 23 17 - - - - - -
Miss. - 1 31 57 51 U - - - - - -
W.S. CENTRAL 17 10 1,202 1,204 163 212 - - - - - 1
Ark. 1 - 90 149 17 27 - - - - - -
La. - - 61 20 36 13 - - - - - -
Okla. 13 10 508 549 8 16 - - - - - -
Tex. 3 - 543 486 102 156 - - - - - 1
MOUNTAIN 35 20 1,232 1,170 260 303 - - - - - 5
Mont. - - 35 39 2 2 - - - - - -
Idaho - 1 54 106 9 29 - - - - - -
Wyo. - - 14 8 12 7 - - - - - -
Colo. 2 4 144 115 54 43 - - - - - 1
N. Mex. 2 7 77 160 82 116 - - - - - -
Ariz. 12 5 561 363 55 52 - - - - - -
Utah 3 2 250 286 31 38 - - - - - -
Nev. 16 1 97 93 15 16 - - - - - 4
PACIFIC 61 100 2,269 2,543 506 502 - 3 - 3 6 58
Wash. 1 1 154 144 16 27 - - - - - 4
Oreg. 14 12 118 376 39 39 - - - - - -
Calif. 43 85 1,940 1,976 439 433 - - - 3 3 -
Alaska 1 - 13 23 8 1 - - - - - 53
Hawaii 2 2 44 24 4 2 - 3 - - 3 1
Guam - - - 2 - - U - U - - -
P.R. - - 134 20 434 49 - - - - - 1
V.I. - - - - - - U - U - - -
Amer. Samoa - - - - - - U - U - - -
C.N.M.I. 4 10 1 1 16 5 U 1 U - 1 -
-----------------------------------------------------------------------------------------------------------------------------------------------------
N: Not notifiable U: Unavailable -: no reported cases
* Of 66 cases among children aged <5 years, serotype was reported for 31 and of those, 13 were type b.
** For imported measles, cases include only those resulting from importation from other countries.
=======================================================================================================================================================
TABLE III. (page 2) Provisional cases of selected notifiable diseases preventable by vaccination, United
States, weeks ending April 12, 1997, and April 13, 1996 (15th Week)
Meningococcal
Disease Mumps Pertussis Rubella
----------------- -------------------------- --------------------------- ---------------------------
Cum. Cum. Cum. Cum. Cum. Cum. Cum. Cum.
Reporting Area 1997 1996 1997 1997 1996 1997 1997 1996 1997 1997 1996
------------------------------------------------------------------------------------------------------------------------------------------
UNITED STATES 1,202 1,143 16 166 170 59 1,262 770 1 9 54
NEW ENGLAND 77 47 - 6 - 8 326 181 - - 7
Maine 9 6 - - - - 6 8 - - -
N.H. 6 1 - - - 1 41 17 - - -
Vt. 2 1 - - - 5 126 6 - - 1
Mass. 44 18 - 1 - 2 138 147 - - 4
R.I. 4 5 - 4 - - 11 - - - -
Conn. 12 16 - 1 - - 4 3 - - 2
MID. ATLANTIC 101 106 2 16 22 6 90 74 - 2 4
Upstate N.Y. 24 23 - 3 6 - 42 40 - 1 2
N.Y. City 17 19 - - 4 - 6 13 - 1 1
N.J. 25 24 - - 2 - - 3 - - 1
Pa. 35 40 2 13 10 6 42 18 - - -
E.N. CENTRAL 147 159 1 23 48 2 122 153 - 2 3
Ohio 63 50 1 8 17 1 54 51 - - -
Ind. 15 15 - 4 5 - 11 9 - - -
Ill. 45 56 - 7 9 - 16 47 - - 1
Mich. 11 17 - 4 17 1 23 9 - - 2
Wis. 13 21 - - - - 18 37 - 2 -
W.N. CENTRAL 86 94 1 8 2 4 80 33 - - -
Minn. 2 9 - 3 - - 45 22 - - -
Iowa 22 16 - 3 - 2 14 2 - - -
Mo. 44 43 - - - 2 12 4 - - -
N. Dak. - 2 - - 2 - 1 - - - -
S. Dak. 3 3 - - - - 1 1 - - -
Nebr. 5 9 1 2 - - 2 1 - - -
Kans. 10 12 - - - - 5 3 - - -
S. ATLANTIC 223 168 3 24 19 10 139 63 1 2 10
Del. 4 2 - - - - - 7 - - -
Md. 25 20 2 4 9 4 53 29 - - -
D.C. 1 4 - - - - 2 - - - -
Va. 17 16 1 2 3 - 17 3 1 1 -
W. Va. 4 6 - - - - 3 2 - - -
N.C. 39 29 - 5 - 3 30 8 - - -
S.C. 34 25 - 1 3 3 6 - - 1 -
Ga. 38 56 - 2 1 - 2 2 - - -
Fla. 61 10 - 10 3 - 26 12 - - 10
E.S. CENTRAL 96 96 - 12 7 - 28 32 - - -
Ky. 20 13 - - - - 1 23 - - -
Tenn. 37 28 - 4 1 - 13 6 - - -
Ala. 25 30 - 4 3 - 7 1 - - -
Miss. 14 25 - 4 3 - 7 2 - - N
W.S. CENTRAL 114 127 4 20 7 2 19 11 - - -
Ark. 22 16 - - - - 3 2 - - -
La. 21 25 - 5 7 1 7 2 - - -
Okla. 13 9 - - - 1 1 1 - - -
Tex. 58 77 4 15 - - 8 6 - - -
MOUNTAIN 74 72 1 8 11 14 263 108 - - 1
Mont. 4 1 - - - - 3 4 - - -
Idaho 5 8 - 2 - 8 164 33 - - -
Wyo. - 3 - - - - 3 - - - -
Colo. 20 11 - 2 - 6 70 21 - - -
N. Mex. 13 14 N N N - 12 22 - - -
Ariz. 16 20 - - 1 - 9 5 - - 1
Utah 10 8 1 2 1 - 1 2 - - -
Nev. 6 7 - 2 9 - 1 21 - - -
PACIFIC 284 274 4 49 54 13 195 115 - 3 29
Wash. 28 31 - 3 5 - 98 42 - - 1
Oreg. 61 51 - - - 1 7 21 - - -
Calif. 194 186 4 36 39 12 85 44 - 1 26
Alaska - 4 - 1 2 - 1 - - - -
Hawaii 1 2 - 9 8 - 4 8 - 2 2
Guam - 1 U - 3 U - - U - -
P.R. 2 2 - - 1 - - - - - -
V.I. - - U - - U - - U - -
Amer. Samoa - - U - - U - - U - -
C.N.M.I. - - U - - U - - U - -
------------------------------------------------------------------------------------------------------------------------------------------
N: Not notifiable U: Unavailable -: no reported cases
=======================================================================================================================================================
Return to top. Table_IV Note: To print large tables and graphs users may have to change their printer settings to landscape and use a small font size.
TABLE IV. Deaths in 122 U.S. cities,* week ending
April 12, 1997 (15th Week)
===================================================================================================================================
All Causes, By Age (Years)
------------------------------------------------------------------------ P&I**
Reporting Area All Ages >=65 45-64 25-44 1-24 <1 Total
---------------------------------------------------------------------------------------------------------------
NEW ENGLAND 587 436 93 38 15 5 59
Boston, Mass. 162 113 31 10 6 2 24
Bridgeport, Conn. 38 26 5 5 1 1 3
Cambridge, Mass. 24 19 2 2 1 - 4
Fall River, Mass. 42 38 3 1 - - 2
Hartford, Conn. U U U U U U U
Lowell, Mass. 26 18 5 2 1 - -
Lynn, Mass. 18 14 4 - - - 1
New Bedford, Mass. 29 23 5 1 - - 2
New Haven, Conn. 47 31 13 2 - 1 1
Providence, R.I. 59 41 10 4 3 1 6
Somerville, Mass. 1 1 - - - - -
Springfield, Mass. 51 38 5 7 1 - 5
Waterbury, Conn. 22 17 1 3 1 - 3
Worcester, Mass. 68 57 9 1 1 - 8
MID. ATLANTIC 2,321 1,615 404 208 48 45 129
Albany, N.Y. 38 26 7 3 1 1 1
Allentown, Pa. 18 14 2 2 - - 1
Buffalo, N.Y. U U U U U U U
Camden, N.J. 32 21 2 4 2 3 2
Elizabeth, N.J. 17 10 1 3 - 3 -
Erie, Pa. 43 32 7 4 - - 5
Jersey City, N.J. 45 28 10 6 - 1 2
New York City, N.Y. 1,234 853 220 114 24 23 52
Newark, N.J. 68 40 14 13 1 - 4
Paterson, N.J. 32 18 7 5 2 - -
Philadelphia, Pa. 410 268 90 30 13 8 23
Pittsburgh, Pa.*** 53 44 4 5 - - 5
Reading, Pa. 7 7 - - - - -
Rochester, N.Y. 133 105 13 7 4 4 14
Schenectady, N.Y. 24 19 2 3 - - 2
Scranton, Pa. 31 27 4 - - - -
Syracuse, N.Y. 84 63 15 4 1 1 12
Trenton, N.J. 35 26 5 3 - 1 4
Utica, N.Y. 17 14 1 2 - - 2
Yonkers, N.Y. U U U U U U U
E.N. CENTRAL 2,101 1,476 387 135 49 53 124
Akron, Ohio 61 45 12 1 2 1 -
Canton, Ohio 40 36 2 1 1 - 4
Chicago, Ill. 419 270 91 39 10 9 40
Cincinnati, Ohio U U U U U U U
Cleveland, Ohio 141 113 15 4 5 4 1
Columbus, Ohio 172 115 33 11 6 7 6
Dayton, Ohio 136 113 17 4 1 1 9
Detroit, Mich. 224 132 55 22 9 5 6
Evansville, Ind. 57 49 7 1 - - 5
Fort Wayne, Ind. 66 47 10 7 1 1 5
Gary, Ind. U U U U U U U
Grand Rapids, Mich. 72 48 13 4 1 6 7
Indianapolis, Ind. 238 153 50 18 7 10 15
Lansing, Mich. 24 18 5 - 1 - -
Milwaukee, Wis. 107 78 21 3 2 3 8
Peoria, Ill. 38 25 9 1 1 2 1
Rockford, Ill. 50 39 8 3 - - 3
South Bend, Ind. 64 46 11 5 1 1 4
Toledo, Ohio 109 81 19 7 1 1 7
Youngstown, Ohio 83 68 9 4 - 2 3
W.N. CENTRAL 908 665 141 53 15 22 62
Des Moines, Iowa 115 91 14 5 1 4 15
Duluth, Minn. 29 19 8 - 1 1 3
Kansas City, Kans. 47 31 10 5 1 - 1
Kansas City, Mo. 120 76 18 10 1 3 10
Lincoln, Nebr. 31 25 5 1 - - 3
Minneapolis, Minn. 197 146 30 10 5 6 17
Omaha, Nebr. 94 73 12 5 1 3 7
St. Louis, Mo. 125 87 21 10 4 3 -
St. Paul, Minn. 63 48 11 3 - 1 5
Wichita, Kans. 87 69 12 4 1 1 1
S. ATLANTIC 1,275 810 267 129 46 20 86
Atlanta, Ga. 114 72 21 12 3 6 7
Baltimore, Md. 227 136 57 27 7 - 25
Charlotte, N.C. 46 25 11 5 4 1 8
Jacksonville, Fla. 131 97 24 6 2 1 4
Miami, Fla. 104 60 24 18 1 1 3
Norfolk, Va. 51 37 7 2 2 3 2
Richmond, Va. 68 36 20 6 6 - -
Savannah, Ga. 46 33 5 6 2 - 3
St. Petersburg, Fla. 51 38 7 2 2 2 2
Tampa, Fla. 190 135 25 19 8 2 27
Washington, D.C. 229 131 61 24 8 4 5
Wilmington, Del. 18 10 5 2 1 - -
E.S. CENTRAL 683 455 139 52 15 21 49
Birmingham, Ala. U U U U U U U
Chattanooga, Tenn. 66 45 12 5 3 - 6
Knoxville, Tenn. 108 79 18 8 1 2 16
Lexington, Ky. 91 60 17 6 3 5 3
Memphis, Tenn. 160 99 36 15 4 6 13
Mobile, Ala. 56 36 14 6 - - 2
Montgomery, Ala. 70 51 11 5 1 2 5
Nashville, Tenn. 132 85 31 7 3 6 4
W.S. CENTRAL 1,462 999 254 132 42 35 85
Austin, Tex. 64 45 12 2 1 4 6
Baton Rouge, La. 41 28 9 2 1 1 -
Corpus Christi, Tex. 74 57 8 3 3 3 5
Dallas, Tex. 217 143 41 22 9 2 11
El Paso, Tex. 85 67 8 7 2 1 8
Ft. Worth, Tex. U U U U U U U
Houston, Tex. 399 250 86 43 10 10 21
Little Rock, Ark. 80 50 15 9 4 2 6
New Orleans, La. 83 53 12 13 4 1 -
San Antonio, Tex. 217 152 37 16 3 9 13
Shreveport, La. 74 50 14 6 3 1 8
Tulsa, Okla. 128 104 12 9 2 1 7
MOUNTAIN 870 613 148 65 23 21 66
Albuquerque, N.M. 89 55 22 10 1 1 2
Boise, Idaho 24 13 5 3 2 1 2
Colo. Springs, Colo. 53 44 4 1 3 1 2
Denver, Colo. 119 86 18 8 5 2 11
Las Vegas, Nev. 169 115 33 13 3 5 9
Ogden, Utah 28 21 3 2 1 1 1
Phoenix, Ariz. 115 80 23 7 1 4 9
Pueblo, Colo. 27 20 4 1 1 1 2
Salt Lake City, Utah 93 61 17 11 3 1 12
Tucson, Ariz. 153 118 19 9 3 4 16
PACIFIC 1,237 911 199 84 20 23 112
Berkeley, Calif. 15 14 1 - - - 1
Fresno, Calif. 79 57 13 6 3 - 6
Glendale, Calif. U U U U U U U
Honolulu, Hawaii 102 74 20 6 - 2 5
Long Beach, Calif. 80 57 14 6 2 1 9
Los Angeles, Calif. U U U U U U U
Pasadena, Calif. U U U U U U U
Portland, Oreg. 163 129 21 8 4 1 9
Sacramento, Calif. U U U U U U U
San Diego, Calif. 115 81 17 10 3 4 8
San Francisco, Calif. 137 102 22 12 1 - 23
San Jose, Calif. 198 146 28 13 5 6 25
Santa Cruz, Calif. 33 27 4 1 - 1 5
Seattle, Wash. 163 114 32 12 2 3 10
Spokane, Wash. 48 32 12 2 - 2 3
Tacoma, Wash. 104 78 15 8 - 3 8
TOTAL 11,444**** 7,980 2,032 896 273 245 772
---------------------------------------------------------------------------------------------------------------
U: Unavailable -: no reported cases
* Mortality data in this table are voluntarily reported from 122 cities in the United States, most of which have populations
of 100,000 or more. A death is reported by the place of its occurrence and by the week that the death certificate was
filed. Fetal deaths are not included.
** Pneumonia and influenza.
*** Because of changes in reporting methods in these 3 Pennsylvania cities, these numbers are partial counts for the current
week. Complete counts will be available in 4 to 6 weeks.
**** Total includes unknown ages.
===================================================================================================================================
Return to top. Disclaimer All MMWR HTML versions of articles are electronic conversions from ASCII text into HTML. This conversion may have resulted in character translation or format errors in the HTML version. Users should not rely on this HTML document, but are referred to the electronic PDF version and/or the original MMWR paper copy for the official text, figures, and tables. An original paper copy of this issue can be obtained from the Superintendent of Documents, U.S. Government Printing Office (GPO), Washington, DC 20402-9371; telephone: (202) 512-1800. Contact GPO for current prices. **Questions or messages regarding errors in formatting should be addressed to mmwrq@cdc.gov.Page converted: 09/19/98 |
|||||||||
This page last reviewed 5/2/01
|