 |
|
|
|
|
|
|
| ||||||||||
|
|
|
|
|
|
|
||||
| ||||||||||
|
|
|
|
|
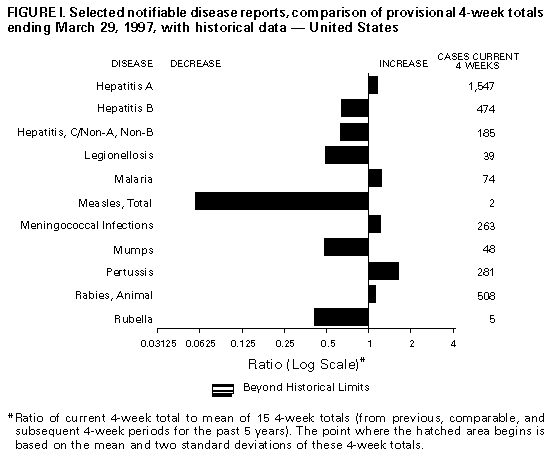
Persons using assistive technology might not be able to fully access information in this file. For assistance, please send e-mail to: mmwrq@cdc.gov. Type 508 Accommodation and the title of the report in the subject line of e-mail. Notifiable Diseases/Deaths in Selected Cities Weekly InformationFigure_I Selected notifiable disease reports, comparison of provisional 4-week totals ending March 29, 1997, with historical data -- United States Table_I Summary -- provisional cases of selected notifiable diseases, United States, cumulative, week ending March 29, 1997 (13th Week) Table_II Provisional cases of selected notifiable diseases, United States, weeks ending March 29, 1997 and March 30, 1996 (13th Week) Table_III Provisional cases of selected notifiable diseases preventable by vaccination, United States, weeks ending March 29, 1997 and March 30, 1996 (13th Week) Table_IV Deaths in 122 U.S. cities, week ending
March 29, 1997 (13th Week)
TABLE I. Summary -- provisional cases of specified notifiable diseases, United
States, cumulative, week ending March 29, 1997 (13th Week)
==================================================================================
                                             Cum. 1997
------------------------------------------------------
Anthrax                                              -
Brucellosis                                         10
Cholera                                              1
Congenital rubella syndrome                          2
Cryptosporidiosis*                                 254
Diphtheria                                           -
Encephalitis:  California*                           4
               eastern equine*                       -
               St. Louis*                            -
               western equine*                       -
Hansen Disease                                      27
Hantavirus pulmonary syndrome*+                      1
Hemolytic uremic syndrome, post-diarrheal*           9
HIV infection, pediatric*&                          36
Plague                                               -
Poliomyelitis, paralytic                             -
Psittacosis                                         10
Rabies, human                                        1
Rocky Mountain spotted fever (RMSF)                 18
Streptococcal disease, invasive Group A            282
Streptococcal toxic-shock syndrome*                  5
Syphilis, congenital@                                -
Tetanus                                              7
Toxic-shock syndrome                                23
Trichinosis                                          2
Typhoid fever                                       69
Yellow fever                                         -
------------------------------------------------------
-: no reported cases
 * Not notifiable in all states
 + Updated weekly from reports to the Division of Viral and Rickettsial
   Diseases, National Center for Infectious Diseases (NCID).
 & Updated monthly to the Division of HIV/AIDS Prevention, National Center
   for HIV, STD, and TB Prevention (NCHSTP), last update February 25, 1997.
 @ Updated quarterly from reports to the Division of STD Prevention,
   NCHSTP.

==================================================================================
Return to top. Table_II Note: To print large tables and graphs users may have to change their printer settings to landscape and use a small font size.
TABLE II. (page 1) Provisional cases of selected notifiable diseases, United States, weeks ending
March 29, 1997, and March 30, 1996 (13th Week)
Escherichia
coli O157:H7
------------------- Hepatitis
AIDS* Chlamydia NETSS** PHLIS*** Gonorrhea C\NA,NB
----------------- -------------------- -------- -------- ------------------- ----------------
Cum. Cum. Cum. Cum. Cum. Cum. Cum. Cum. Cum. Cum.
Reporting Area 1997 1996 1997 1996 1997 1997 1997 1996 1997 1996
------------------------------------------------------------------------------------------------------------------------------
UNITED STATES 10,182 16,657 82,771 95,380 238 100 56,242 75,402 949 736
NEW ENGLAND 262 648 3,521 4,617 18 10 1,342 1,853 8 18
Maine 16 10 236 U 1 - 12 11 - -
N.H. 2 23 139 154 - - 37 34 2 2
Vt. 10 7 101 126 1 1 15 16 - 9
Mass. 125 387 1,666 1,654 14 9 603 566 6 5
R.I. 29 38 535 556 1 - 135 140 - 2
Conn. 80 183 844 2,127 1 - 540 1,086 - -
MID. ATLANTIC 3,529 4,439 5,014 13,001 17 3 3,197 7,130 59 55
Upstate N.Y. 537 539 N N 10 3 411 6 41 48
N.Y. City 1,788 2,448 U 5,189 4 - U 3,207 - 1
N.J. 770 924 1,144 2,777 3 - 812 1,190 - -
Pa. 434 528 3,870 5,035 N - 1,974 2,727 18 6
E.N. CENTRAL 597 1,391 13,763 22,558 42 14 8,739 14,870 146 125
Ohio 130 300 3,346 5,350 17 9 2,242 3,940 5 4
Ind. 88 264 2,028 2,103 7 1 1,409 1,603 2 4
Ill. 252 525 2,748 6,546 9 - 1,439 4,307 8 23
Mich. 89 224 4,321 5,771 9 2 3,005 3,777 131 94
Wis. 38 78 1,320 2,788 N 2 644 1,243 - -
W.N. CENTRAL 207 401 5,214 8,279 34 24 2,300 3,217 29 19
Minn. 39 83 U 1,369 20 16 U - - -
Iowa 47 31 1,239 641 8 2 313 201 14 5
Mo. 81 169 2,559 3,921 1 3 1,510 2,217 5 10
N. Dak. 2 1 81 274 3 2 5 9 2 -
S. Dak. 2 5 279 300 - - 30 45 - -
Nebr. 21 32 250 595 1 - 88 121 - 2
Kans. 15 80 806 1,179 1 1 354 624 8 2
S. ATLANTIC 2,493 4,526 19,556 13,262 34 5 20,833 26,488 61 38
Del. 38 92 U U 1 1 266 357 - -
Md. 304 438 1,682 1,384 2 1 3,217 3,312 4 -
D.C. 130 229 N N - - 1,173 1,124 - -
Va. 243 223 2,929 3,073 N - 2,369 2,388 4 3
W. Va. 17 24 U U N - 162 99 1 4
N.C. 153 196 4,424 U 5 3 4,042 4,944 17 8
S.C. 158 226 3,142 U - - 2,761 2,923 12 7
Ga. 370 680 2,070 3,139 13 - 2,924 6,642 U -
Fla. 1,080 2,418 5,309 5,666 13 - 3,919 4,699 23 16
E.S. CENTRAL 315 539 7,780 7,068 20 4 7,907 7,583 75 142
Ky. 32 87 1,584 1,817 6 - 993 1,027 5 7
Tenn. 136 200 2,872 2,975 12 4 2,497 2,633 35 134
Ala. 87 157 1,835 2,200 - - 2,607 3,435 4 1
Miss. 60 95 1,489 76 2 - 1,810 488 31 -
W.S. CENTRAL 931 1,464 10,111 4,705 3 1 7,025 6,033 60 79
Ark. 40 70 288 343 2 - 615 976 2 1
La. 152 428 1,527 U 1 1 1,542 2,042 42 33
Okla. 46 52 1,849 1,929 - - 1,245 1,187 2 26
Tex. 693 914 6,447 2,433 - - 3,623 1,828 14 19
MOUNTAIN 294 463 4,897 3,057 26 17 1,711 2,033 87 159
Mont. 8 4 137 303 - - 10 6 3 8
Idaho 4 7 370 390 1 - 25 20 14 38
Wyo. 5 2 110 173 - - 14 10 27 41
Colo. 82 150 101 7 13 8 381 502 20 16
N. Mex. 25 25 1,017 989 4 1 348 235 14 25
Ariz. 73 134 2,293 73 N 6 744 990 5 21
Utah 17 62 308 403 2 - 36 72 1 6
Nev. 80 79 561 719 6 2 153 198 3 4
PACIFIC 1,554 2,786 12,915 18,833 44 20 3,188 6,195 424 101
Wash. 92 216 2,268 2,467 8 - 537 631 6 23
Oreg. 74 152 700 1,335 13 10 98 108 3 3
Calif. 1,370 2,379 9,262 14,384 20 8 2,325 5,186 372 36
Alaska 10 3 324 171 3 - 125 144 - 2
Hawaii 8 36 361 476 N 2 103 126 43 37
Guam - 3 - 90 N - - 22 - -
P.R. 264 416 N N 9 U 225 60 19 12
V.I. 11 3 N N N U - - - -
Amer. Samoa - - - - N U - - - -
C.N.M.I. - - N N N U 8 11 2 -
------------------------------------------------------------------------------------------------------------------------------
N: Not notifiable U: Unavailable -: no reported cases C.N.M.I.: Commonwealth of North Mariana Islands
* Updated monthly to the Division of HIV/AIDS Prevention, National Center for HIV, STD, and TB Prevention, last update February 25, 1997.
** National Electronic Telecommunications System for Surveillance.
*** Public Health Laboratory Information System.
=======================================================================================================================================================
TABLE II. (page 2) Provisional cases of selected notifiable diseases, United States, weeks ending
March 29, 1997, and March 30, 1996 (13th Week)
Lyme Syphilis Rabies,
Legionellosis Disease Malaria (Primary & Secondary) Tuberculosis Animal
---------------- ---------------- ---------------- --------------------- ----------------- -------
Cum. Cum. Cum. Cum. Cum. Cum. Cum. Cum. Cum. Cum. Cum.
Reporting Area 1997 1996 1997 1996 1997 1996 1997 1996 1997 1996 1997
-------------------------------------------------------------------------------------------------------------------------------------------
UNITED STATES 195 178 534 1,065 289 238 1,872 3,117 2,790 3,593 1,421
NEW ENGLAND 15 4 52 69 5 7 34 51 73 87 218
Maine 1 1 1 - - 2 - - - 3 44
N.H. 3 - 2 2 - 1 - 1 2 3 7
Vt. 2 - 2 - - 1 - - - - 36
Mass. 5 1 28 9 4 3 17 21 41 29 48
R.I. 1 2 19 19 1 - - - 5 14 3
Conn. 3 N - 39 - - 17 29 25 38 80
MID. ATLANTIC 37 36 387 894 59 64 60 106 608 589 307
Upstate N.Y. 11 7 39 289 11 12 6 12 66 71 214
N.Y. City - 1 2 221 29 30 U 34 332 295 -
N.J. 4 5 82 76 14 18 33 34 130 131 26
Pa. 22 23 264 308 5 4 21 26 80 92 67
E.N. CENTRAL 71 67 12 5 19 27 166 487 383 461 4
Ohio 42 27 11 3 1 4 65 203 92 71 2
Ind. 7 14 1 2 2 1 39 66 19 40 1
Ill. - 7 - - 5 10 17 124 196 284 1
Mich. 22 14 - - 11 8 22 38 56 53 -
Wis. - 5 U U - 4 23 56 20 13 -
W.N. CENTRAL 13 12 2 19 6 3 50 150 97 99 83
Minn. - - - 1 3 - U 35 30 28 12
Iowa 1 - - 3 1 1 15 4 10 11 40
Mo. 4 4 - 6 2 1 22 96 37 33 6
N. Dak. 1 - - - - - - - 2 1 11
S. Dak. 1 2 - - - - - - 2 9 3
Nebr. 5 6 2 - - - - 6 - 5 -
Kans. 1 - - 9 - 1 13 9 16 12 11
S. ATLANTIC 27 21 54 46 77 41 781 1,008 505 545 679
Del. 2 1 - 15 2 2 7 11 - 9 2
Md. 13 3 41 21 23 12 172 150 48 59 121
D.C. 1 1 4 - 5 2 31 36 19 17 1
Va. 1 6 - - 13 6 86 122 40 43 141
W. Va. - 1 - 3 - - - 1 11 18 15
N.C. 3 3 2 4 4 5 201 258 63 71 227
S.C. 1 1 1 1 3 1 103 129 71 74 25
Ga. - - 1 - 9 5 119 224 97 134 69
Fla. 6 5 5 2 18 8 62 77 156 120 78
E.S. CENTRAL 7 14 14 13 7 4 467 781 201 292 59
Ky. - 3 1 4 1 2 37 42 39 48 8
Tenn. 3 6 2 3 2 1 198 252 34 89 39
Ala. 1 1 - - 1 1 114 156 84 95 12
Miss. 3 4 11 6 3 - 118 331 44 60 -
W.S. CENTRAL - 1 2 3 4 8 249 337 51 307 30
Ark. - - - 3 1 - 19 74 29 31 9
La. - - - - 3 - 111 152 - - -
Okla. - 1 1 - - - 33 37 22 37 21
Tex. - - 1 - - 8 86 74 U 239 -
MOUNTAIN 15 9 - - 19 17 33 42 106 125 9
Mont. - - - - 1 1 - - 2 - 1
Idaho 1 - - - - - - 1 1 2 -
Wyo. 1 - - - 1 2 - 1 1 1 -
Colo. 4 5 - - 8 9 - 13 21 24 -
N. Mex. - - - - 2 1 - - 7 15 1
Ariz. 3 1 - - 1 1 28 24 49 54 7
Utah 4 - - - - 2 1 - 4 10 -
Nev. 2 3 - - 6 1 4 3 21 19 -
PACIFIC 10 14 11 16 93 67 32 155 766 1,088 32
Wash. 2 1 - - 1 1 5 1 42 58 -
Oreg. - - 3 4 6 5 1 2 29 45 1
Calif. 7 13 8 11 86 58 25 151 624 924 29
Alaska - - - - - - - - 25 20 2
Hawaii 1 - - 1 - 3 1 1 46 41 -
Guam - - - - - - - 2 - 28 -
P.R. - - - - 1 - 76 37 - 47 14
V.I. - - - - - - - - - - -
Amer. Samoa - - - - - - - - - - -
C.N.M.I. - - - - - - 2 1 - - -
-------------------------------------------------------------------------------------------------------------------------------------------
N: Not notifiable U: Unavailable -: no reported cases
=======================================================================================================================================================
Return to top. Table_III Note: To print large tables and graphs users may have to change their printer settings to landscape and use a small font size.
TABLE III. (page 1) Provisional cases of selected notifiable diseases preventable by vaccination, United
States, weeks ending March 29, 1997, and March 30, 1996 (13th Week)
Hepatitis (Viral), by type Measles (Rubeola)
H. influenzae, --------------------------------------- ------------------------------------------------------------
invasive A B Indigenous Imported** Total
---------------- ----------------- ----------------- --------------- --------------- ---------------
Cum. Cum. Cum. Cum. Cum. Cum. Cum. Cum. Cum. Cum.
Reporting Area 1997* 1996 1997 1996 1997 1996 1997 1997 1997 1997 1997 1996
-----------------------------------------------------------------------------------------------------------------------------------------------------
UNITED STATES 291 300 5,941 6,607 1,756 2,110 - 8 - 4 12 67
NEW ENGLAND 8 8 113 65 36 43 - - - - - 6
Maine 2 - 10 8 3 2 - - - - - -
N.H. 1 6 8 3 2 2 - - - - - -
Vt. - - 4 1 1 2 - - - - - 1
Mass. 4 2 49 29 24 10 - - - - - 4
R.I. 1 - 9 2 4 2 - - - - - -
Conn. - - 33 22 2 25 U - U - - 1
MID. ATLANTIC 30 42 379 470 272 348 - 1 - 1 2 3
Upstate N.Y. 1 4 33 78 55 67 - 1 - 1 2 1
N.Y. City 12 7 144 221 94 163 - - - - - 2
N.J. 11 16 82 99 62 67 - - - - - -
Pa. 6 15 120 72 61 51 - - - - - -
E.N. CENTRAL 37 56 534 613 208 269 - 3 - 1 4 3
Ohio 22 32 143 248 27 28 - - - - - 2
Ind. 4 2 62 97 15 31 - - - - - -
Ill. 7 17 105 137 31 75 - 3 - - 3 -
Mich. 4 2 194 84 133 106 - - - 1 1 -
Wis. - 3 30 47 2 29 U - U - - 1
W.N. CENTRAL 8 8 437 497 80 105 - 1 - - 1 -
Minn. 2 1 27 12 3 2 - - - - - -
Iowa 2 3 66 122 33 12 - - - - - -
Mo. 1 4 229 244 32 70 - 1 - - 1 -
N. Dak. - - 4 5 - - U - U - - -
S. Dak. 2 - 5 26 - - - - - - - -
Nebr. - - 36 51 3 7 - - - - - -
Kans. 1 - 70 37 9 14 - - - - - -
S. ATLANTIC 71 56 394 216 249 334 - - - - - 2
Del. - 1 8 5 1 1 - - - - - 1
Md. 24 19 93 49 44 80 - - - - - -
D.C. 2 - 11 6 17 5 - - - - - -
Va. 2 3 39 37 16 38 - - - - - -
W. Va. 1 - 5 5 6 8 - - - - - -
N.C. 7 10 55 26 58 103 - - - - - -
S.C. 4 3 27 19 17 24 - - - - - -
Ga. 15 18 38 - 13 1 - - - - - -
Fla. 16 2 118 69 77 74 - - - - - 1
E.S. CENTRAL 14 10 142 506 179 161 - - - - - -
Ky. 1 3 20 6 5 22 - - - - - -
Tenn. 10 2 69 375 104 125 - - - - - -
Ala. 3 4 30 72 17 14 U - U - - -
Miss. - 1 23 53 53 U U - U - - -
W.S. CENTRAL 12 9 1,033 1,041 120 162 - - - - - 1
Ark. 1 - 64 134 16 23 - - - - - -
La. - - 52 16 23 12 - - - - - -
Okla. 8 9 442 490 6 14 - - - - - -
Tex. 3 - 475 401 75 113 - - - - - 1
MOUNTAIN 33 20 1,085 985 236 256 - - - - - 4
Mont. - - 32 18 1 2 - - - - - -
Idaho - 1 46 101 9 26 - - - - - -
Wyo. - - 11 6 10 5 U - U - - -
Colo. 2 4 126 101 50 35 - - - - - -
N. Mex. 2 7 68 137 74 95 - - - - - -
Ariz. 12 5 467 300 44 44 - - - - - -
Utah 3 2 229 241 30 34 - - - - - -
Nev. 14 1 106 81 18 15 U - U - - 4
PACIFIC 78 91 1,824 2,214 376 432 - 3 - 2 5 48
Wash. - 1 138 128 14 21 - - - - - 4
Oreg. 13 11 107 334 36 34 - - - - - -
Calif. 62 77 1,529 1,712 315 374 - - - 2 2 1
Alaska 1 - 11 19 7 1 - - - - - 42
Hawaii 2 2 39 21 4 2 - 3 - - 3 1
Guam - - - 2 - - U - U - - -
P.R. - - 100 20 233 42 - - - - - 1
V.I. - - - - - - U - U - - -
Amer. Samoa - - - - - - U - U - - -
C.N.M.I. 4 10 1 1 14 5 U 1 U - 1 -
-----------------------------------------------------------------------------------------------------------------------------------------------------
N: Not notifiable U: Unavailable -: no reported cases
* Of 60 cases among children aged <5 years, serotype was reported for 26 and of those, 11 were type b.
** For imported measles, cases include only those resulting from importation from other countries.
=======================================================================================================================================================
TABLE III. (page 2) Provisional cases of selected notifiable diseases preventable by vaccination, United
States, weeks ending March 29, 1997, and March 30, 1996 (13th Week)
Meningococcal
Disease Mumps Pertussis Rubella
----------------- -------------------------- --------------------------- ---------------------------
Cum. Cum. Cum. Cum. Cum. Cum. Cum. Cum.
Reporting Area 1997 1996 1997 1997 1996 1997 1997 1996 1997 1997 1996
------------------------------------------------------------------------------------------------------------------------------------------
UNITED STATES 1,034 1,002 6 125 152 113 1,091 704 - 8 39
NEW ENGLAND 58 38 - 5 - 11 284 174 - - 6
Maine 8 6 - - - - 6 5 - - -
N.H. 5 1 - - - 4 39 14 - - -
Vt. 2 1 - - - 4 107 6 - - -
Mass. 35 13 - - - 1 120 146 - - 4
R.I. 2 5 - 4 - 2 11 - - - -
Conn. 6 12 U 1 - U 1 3 U - 2
MID. ATLANTIC 84 95 1 12 21 11 62 67 - 2 4
Upstate N.Y. 23 20 - 1 6 - 26 37 - 1 2
N.Y. City 15 17 - - 4 - 5 12 - 1 1
N.J. 21 22 - - 2 - - 3 - - 1
Pa. 25 36 1 11 9 11 31 15 - - -
E.N. CENTRAL 123 142 2 16 42 1 105 140 - 2 1
Ohio 56 48 - 3 16 - 47 46 - - -
Ind. 14 11 - 3 5 1 9 9 - - -
Ill. 36 51 1 6 9 - 17 45 - - 1
Mich. 9 11 1 4 12 - 20 9 - - -
Wis. 8 21 U - - U 12 31 U 2 -
W.N. CENTRAL 79 87 - 5 2 5 60 9 - - -
Minn. 2 3 - 3 - 4 35 1 - - -
Iowa 21 13 - 2 - - 12 2 - - -
Mo. 38 45 - - - 1 9 4 - - -
N. Dak. - 2 U - 2 U 1 - U - -
S. Dak. 3 3 - - - - 1 - - - -
Nebr. 5 9 - - - - 2 1 - - -
Kans. 10 12 - - - - - 1 - - -
S. ATLANTIC 203 146 1 21 16 18 116 46 - 1 -
Del. 3 2 - - - - - 7 - - -
Md. 24 17 - 2 8 1 47 26 - - -
D.C. 1 2 - - - - 2 - - - -
Va. 11 15 - 1 3 - 14 - - - -
W. Va. 2 4 - - - - 3 - - - -
N.C. 39 25 - 5 - 5 20 - - - -
S.C. 32 23 - 1 3 - 3 - - 1 -
Ga. 34 49 - 2 1 - 3 2 - - -
Fla. 57 9 1 10 1 12 24 11 - - -
E.S. CENTRAL 79 85 - 10 7 1 24 31 - - -
Ky. 19 11 - - - - 1 23 - - -
Tenn. 29 24 - 3 1 1 10 5 - - -
Ala. 23 26 U 4 3 U 7 1 U - -
Miss. 8 24 U 3 3 U 6 2 U - N
W.S. CENTRAL 109 103 1 15 6 2 14 8 - - -
Ark. 20 12 - - - - 3 2 - - -
La. 20 19 - 4 6 2 5 2 - - -
Okla. 11 7 - - - - - 1 - - -
Tex. 58 65 1 11 - - 6 3 - - -
MOUNTAIN 66 64 1 5 10 51 230 91 - - -
Mont. 4 1 - - - - 3 4 - - -
Idaho 5 8 1 2 - 41 146 32 - - -
Wyo. - 3 U - - U 3 - U - -
Colo. 16 8 - 2 - 7 58 12 - - -
N. Mex. 12 12 N N N 1 10 19 - - -
Ariz. 16 18 - - 1 1 9 3 - - -
Utah 9 7 - 1 - 1 1 1 - - -
Nev. 4 7 U - 9 U - 20 U - -
PACIFIC 233 242 - 36 48 13 196 138 - 3 28
Wash. 26 31 - 3 5 13 75 34 - - 1
Oreg. 56 41 - - - - 6 18 - - -
Calif. 150 164 - 27 36 - 110 81 - 1 25
Alaska - 4 - 1 1 - 1 - - - -
Hawaii 1 2 - 5 6 - 4 5 - 2 2
Guam - 1 U - 2 U - - U - -
P.R. 2 2 - - 1 - - - - - -
V.I. - - U - - U - - U - -
Amer. Samoa - - U - - U - - U - -
C.N.M.I. - - U - - U - - U - -
------------------------------------------------------------------------------------------------------------------------------------------
N: Not notifiable U: Unavailable -: no reported cases
=======================================================================================================================================================
Return to top. Table_IV Note: To print large tables and graphs users may have to change their printer settings to landscape and use a small font size.
TABLE IV. Deaths in 122 U.S. cities,* week ending
March 29, 1997 (13th Week)
===================================================================================================================================
All Causes, By Age (Years)
------------------------------------------------------------------------ P&I**
Reporting Area All Ages >=65 45-64 25-44 1-24 <1 Total
---------------------------------------------------------------------------------------------------------------
NEW ENGLAND 550 409 84 37 11 9 37
Boston, Mass. 170 108 32 16 10 4 12
Bridgeport, Conn. 39 31 4 4 - - 4
Cambridge, Mass. 17 14 2 1 - - 2
Fall River, Mass. 35 30 5 - - - -
Hartford, Conn. 41 30 6 4 - 1 3
Lowell, Mass. 23 20 3 - - - 1
Lynn, Mass. 13 11 1 1 - - 1
New Bedford, Mass. 36 31 5 - - - -
New Haven, Conn. 31 25 4 - 1 1 2
Providence, R.I. U U U U U U U
Somerville, Mass. 3 2 1 - - - -
Springfield, Mass. 46 33 4 6 - 3 3
Waterbury, Conn. 32 26 5 1 - - 2
Worcester, Mass. 64 48 12 4 - - 7
MID. ATLANTIC 2,250 1,562 421 196 43 28 138
Albany, N.Y. 46 34 7 2 2 1 1
Allentown, Pa. 18 14 2 1 1 - -
Buffalo, N.Y. 81 60 13 7 - 1 -
Camden, N.J. 36 22 10 3 1 - 2
Elizabeth, N.J. 14 7 3 4 - - -
Erie, Pa. 43 35 6 - 1 1 5
Jersey City, N.J. 26 18 4 4 - - -
New York City, N.Y. 1,264 864 244 121 22 13 60
Newark, N.J. 65 31 13 11 2 8 6
Paterson, N.J. U U U U U U U
Philadelphia, Pa. 229 145 53 26 5 - 15
Pittsburgh, Pa.*** 73 54 16 2 1 - 3
Reading, Pa. 10 7 2 1 - - -
Rochester, N.Y. 145 118 15 6 2 4 19
Schenectady, N.Y. 27 20 4 2 1 - 3
Scranton, Pa. 36 28 7 - 1 - 3
Syracuse, N.Y. 92 74 14 3 1 - 11
Trenton, N.J. 29 15 8 3 3 - 5
Utica, N.Y. 16 16 - - - - 5
Yonkers, N.Y. U U U U U U U
E.N. CENTRAL 1,932 1,359 339 136 56 42 115
Akron, Ohio 61 46 10 3 - 2 -
Canton, Ohio 37 30 4 1 1 1 3
Chicago, Ill. 358 230 80 30 12 6 23
Cincinnati, Ohio 110 84 20 1 2 3 12
Cleveland, Ohio 119 67 32 11 3 6 4
Columbus, Ohio 171 130 19 13 3 6 14
Dayton, Ohio 139 106 20 6 4 3 8
Detroit, Mich. 208 122 43 28 12 3 2
Evansville, Ind. 29 21 7 1 - - -
Fort Wayne, Ind. 66 43 12 7 2 2 2
Gary, Ind. U U U U U U U
Grand Rapids, Mich. 71 55 8 3 2 3 13
Indianapolis, Ind. 150 110 22 9 6 3 -
Lansing, Mich. 29 17 9 1 1 1 6
Milwaukee, Wis. 113 85 12 13 2 1 8
Peoria, Ill. 41 39 2 - - - 4
Rockford, Ill. 53 33 14 5 1 - 7
South Bend, Ind. 28 22 2 2 1 1 4
Toledo, Ohio 101 83 14 2 2 - 4
Youngstown, Ohio 48 36 9 - 2 1 1
W.N. CENTRAL 698 482 125 45 23 9 48
Des Moines, Iowa 20 16 3 1 - - 1
Duluth, Minn. 22 19 1 2 - - 1
Kansas City, Kans. 19 12 6 - 1 - -
Kansas City, Mo. 114 66 20 8 6 - 6
Lincoln, Nebr. 43 35 6 1 1 - 5
Minneapolis, Minn. 131 94 23 9 2 3 9
Omaha, Nebr. 124 86 24 7 3 4 11
St. Louis, Mo. 98 64 20 8 4 2 6
St. Paul, Minn. 56 41 9 5 1 - 5
Wichita, Kans. 71 49 13 4 5 - 4
S. ATLANTIC 1,226 799 246 112 30 34 72
Atlanta, Ga. 127 78 31 13 3 2 2
Baltimore, Md. 158 100 37 15 4 2 16
Charlotte, N.C. 77 54 14 6 2 1 13
Jacksonville, Fla. 117 81 18 13 2 - 5
Miami, Fla. 102 56 32 9 4 1 -
Norfolk, Va. 51 36 4 4 4 3 5
Richmond, Va. 89 69 10 5 2 2 4
Savannah, Ga. 51 35 8 4 2 2 4
St. Petersburg, Fla. 76 55 13 5 - 3 2
Tampa, Fla. 149 109 20 14 2 3 12
Washington, D.C. 208 111 53 24 5 15 9
Wilmington, Del. 21 15 6 - - - -
E.S. CENTRAL 774 504 176 64 18 12 66
Birmingham, Ala. 1 - - - 1 - -
Chattanooga, Tenn. 52 38 11 1 1 1 8
Knoxville, Tenn. 90 61 20 7 2 - 13
Lexington, Ky. 65 36 17 8 2 2 7
Memphis, Tenn. 236 155 55 20 3 3 27
Mobile, Ala. 115 72 23 13 3 4 2
Montgomery, Ala. 50 36 12 1 1 - 4
Nashville, Tenn. 165 106 38 14 5 2 5
W.S. CENTRAL 1,485 984 287 124 56 32 74
Austin, Tex. 69 41 15 8 2 3 1
Baton Rouge, La. 26 17 5 3 1 - -
Corpus Christi, Tex. 57 43 7 3 2 2 4
Dallas, Tex. 202 99 63 24 12 4 3
El Paso, Tex. 62 46 11 3 2 - 4
Ft. Worth, Tex. 143 96 27 7 7 6 8
Houston, Tex. 380 244 70 45 15 4 21
Little Rock, Ark. 95 80 8 3 1 3 4
New Orleans, La. 116 77 24 6 5 4 -
San Antonio, Tex. 215 151 38 17 4 5 20
Shreveport, La. 66 53 9 1 3 - 6
Tulsa, Okla. 54 37 10 4 2 1 3
MOUNTAIN 1,014 748 139 73 28 23 100
Albuquerque, N.M. 89 66 10 9 3 1 4
Boise, Idaho 49 45 3 - - 1 4
Colo. Springs, Colo. 73 57 10 6 - - 5
Denver, Colo. 101 73 12 10 1 5 11
Las Vegas, Nev. 179 122 36 14 5 2 22
Ogden, Utah 25 21 1 1 1 1 3
Phoenix, Ariz. 178 115 31 13 10 6 9
Pueblo, Colo. 29 24 5 - - - 1
Salt Lake City, Utah 120 83 13 13 5 6 16
Tucson, Ariz. 171 142 18 7 3 1 25
PACIFIC 1,764 1,286 284 132 34 26 175
Berkeley, Calif. 17 13 1 3 - - 2
Fresno, Calif. 92 62 19 6 2 3 12
Glendale, Calif. 29 21 4 4 - - 2
Honolulu, Hawaii 31 24 4 1 1 1 3
Long Beach, Calif. 75 56 12 3 3 1 10
Los Angeles, Calif. 527 392 89 35 7 4 36
Pasadena, Calif. 38 24 9 3 1 1 6
Portland, Oreg. 153 108 26 14 4 1 9
Sacramento, Calif. U U U U U U U
San Diego, Calif. 144 100 21 15 4 4 17
San Francisco, Calif. 115 84 20 10 1 - 24
San Jose, Calif. 199 132 41 13 5 6 24
Santa Cruz, Calif. 46 36 3 5 1 1 6
Seattle, Wash. 148 105 18 17 5 3 6
Spokane, Wash. 63 53 8 2 - - 10
Tacoma, Wash. 87 76 9 1 - 1 8
TOTAL 11,693**** 8,133 2,101 919 299 215 825
---------------------------------------------------------------------------------------------------------------
U: Unavailable -: no reported cases
* Mortality data in this table are voluntarily reported from 122 cities in the United States, most of which have populations
of 100,000 or more. A death is reported by the place of its occurrence and by the week that the death certificate was
filed. Fetal deaths are not included.
** Pneumonia and influenza.
*** Because of changes in reporting methods in these 3 Pennsylvania cities, these numbers are partial counts for the current
week. Complete counts will be available in 4 to 6 weeks.
**** Total includes unknown ages.
===================================================================================================================================
Return to top. Disclaimer All MMWR HTML versions of articles are electronic conversions from ASCII text into HTML. This conversion may have resulted in character translation or format errors in the HTML version. Users should not rely on this HTML document, but are referred to the electronic PDF version and/or the original MMWR paper copy for the official text, figures, and tables. An original paper copy of this issue can be obtained from the Superintendent of Documents, U.S. Government Printing Office (GPO), Washington, DC 20402-9371; telephone: (202) 512-1800. Contact GPO for current prices. **Questions or messages regarding errors in formatting should be addressed to mmwrq@cdc.gov.Page converted: 09/19/98 |
|||||||||
This page last reviewed 5/2/01
|