 |
|
|
|
|
|
|
| ||||||||||
|
|
|
|
|
|
|
||||
| ||||||||||
|
|
|
|
|
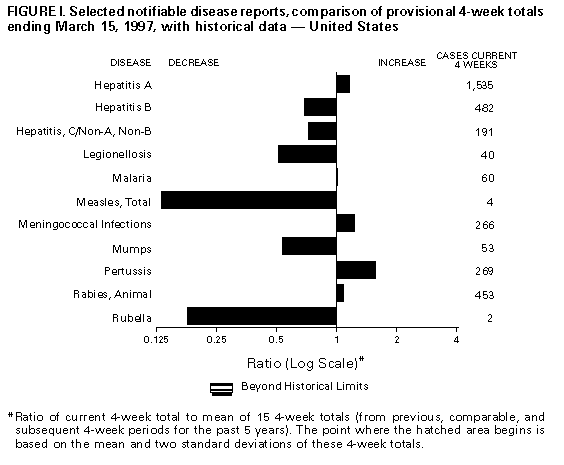
Persons using assistive technology might not be able to fully access information in this file. For assistance, please send e-mail to: mmwrq@cdc.gov. Type 508 Accommodation and the title of the report in the subject line of e-mail. Notifiable Diseases/Deaths in Selected Cities Weekly InformationFigure_I Selected notifiable disease reports, comparison of provisional 4-week totals ending March 15, 1997, with historical data -- United States Table_I Summary -- provisional cases of selected notifiable diseases, United States, cumulative, week ending March 15, 1997 (11th Week) Table_II Provisional cases of selected notifiable diseases, United States, weeks ending March 15, 1997 and March 16, 1996 (11th Week) Table_III Provisional cases of selected notifiable diseases preventable by vaccination, United States, weeks ending March 15, 1997 and March 16, 1996 (11th Week) Table_IV Deaths in 122 U.S. cities, week ending
March 15, 1997 (11th Week)
TABLE I. Summary -- provisional cases of specified notifiable diseases, United
States, cumulative, week ending March 15, 1997 (11th Week)
==================================================================================
                                             Cum. 1997
------------------------------------------------------
Anthrax                                              -
Brucellosis                                          5
Cholera                                              0
Congenital rubella syndrome                          1
Cryptosporidiosis*                                 204
Diphtheria                                           -
Encephalitis:  California*                           1
               eastern equine*                       -
               St. Louis*                            -
               western equine*                       -
Hansen Disease                                      22
Hantavirus pulmonary syndrome*+                      1
Hemolytic uremic syndrome, post-diarrheal*           9
HIV infection, pediatric*&                          19
Plague                                               -
Poliomyelitis, paralytic                             -
Psittacosis                                          7
Rabies, human                                        1
Rocky Mountain spotted fever (RMSF)                 16
Streptococcal disease, invasive Group A            150
Streptococcal toxic-shock syndrome*                  5
Syphilis, congenital@                                -
Tetanus                                              6
Toxic-shock syndrome                                19
Trichinosis                                          2
Typhoid fever                                       56
Yellow fever                                         -
------------------------------------------------------
-: no reported cases
 * Not notifiable in all states
 + Updated weekly from reports to the Division of Viral and Rickettsial
   Diseases, National Center for Infectious Diseases (NCID).
 & Updated monthly to the Division of HIV/AIDS Prevention, National Center
   for HIV, STD, and TB Prevention (NCHSTP), last update January 28, 1997.
 @ Updated quarterly from reports to the Division of STD Prevention,
   NCHSTP.

==================================================================================
Return to top. Table_II Note: To print large tables and graphs users may have to change their printer settings to landscape and use a small font size.
TABLE II. (page 1) Provisional cases of selected notifiable diseases, United States, weeks ending
March 15, 1997, and March 16, 1996 (11th Week)
Escherichia
coli O157:H7
------------------- Hepatitis
AIDS* Chlamydia NETSS** PHLIS*** Gonorrhea C\NA,NB
----------------- -------------------- -------- -------- ------------------- ----------------
Cum. Cum. Cum. Cum. Cum. Cum. Cum. Cum. Cum. Cum.
Reporting Area 1997 1996 1997 1996 1997 1997 1997 1996 1997 1996
------------------------------------------------------------------------------------------------------------------------------
UNITED STATES 5,109 11,907 61,612 78,876 194 73 42,814 65,491 587 585
NEW ENGLAND 134 613 3,054 3,899 16 7 1,207 1,613 2 15
Maine 13 8 49 - 1 - 3 10 - -
N.H. 1 14 102 119 - - 33 26 1 2
Vt. 7 5 80 104 1 1 13 16 - 7
Mass. 62 386 1,536 1,373 12 6 500 529 1 5
R.I. 19 17 443 491 1 - 118 127 - 1
Conn. 32 183 844 1,812 1 - 540 905 - -
MID. ATLANTIC 1,921 3,033 4,064 9,948 12 3 2,594 5,902 51 40
Upstate N.Y. 113 390 N N 6 3 319 5 35 35
N.Y. City 1,039 1,628 - 4,121 4 - - 2,608 - 1
N.J. 468 646 945 1,558 2 - 687 959 - -
Pa. 301 369 3,119 4,269 N - 1,588 2,330 16 4
E.N. CENTRAL 242 906 11,475 19,311 29 11 7,584 12,893 122 92
Ohio 57 249 2,697 4,474 14 7 1,869 3,467 5 2
Ind. 25 90 1,674 1,790 6 - 1,201 1,404 1 2
Ill. 115 321 2,370 5,642 - - 1,243 3,649 - 19
Mich. 29 191 3,414 4,994 9 2 2,627 3,295 116 69
Wis. 16 55 1,320 2,411 N 2 644 1,078 - -
W.N. CENTRAL 127 248 4,230 6,930 29 15 1,963 2,808 28 15
Minn. 17 57 - 999 16 10 U - - -
Iowa 38 22 1,040 549 7 2 263 183 13 3
Mo. 54 90 2,036 3,356 1 - 1,316 1,943 3 9
N. Dak. 2 - 81 219 3 2 5 8 2 -
S. Dak. - 3 216 219 - - 28 34 - -
Nebr. 15 22 212 571 1 - 79 107 - 2
Kans. 1 54 645 1,017 1 1 272 533 10 1
S. ATLANTIC 1,239 2,883 15,159 10,927 33 5 17,177 23,535 51 28
Del. 20 72 - - 1 1 228 331 - -
Md. 166 196 1,318 1,149 2 1 2,686 2,902 4 -
D.C. 55 127 N N - - 938 966 - -
Va. 130 127 2,456 2,288 N - 1,988 2,279 4 1
W. Va. 14 19 - - N - 114 99 1 4
N.C. 59 35 3,656 U 4 3 3,255 4,382 16 8
S.C. 104 91 2,142 U - - 2,504 2,619 12 4
Ga. 183 447 1,455 2,597 13 - 2,348 5,811 U -
Fla. 508 1,769 4,132 4,893 13 - 3,116 4,146 14 11
E.S. CENTRAL 134 391 5,316 5,814 17 4 5,231 6,447 65 109
Ky. 23 67 1,365 1,493 5 - 835 884 3 5
Tenn. 59 167 2,434 2,512 10 4 2,164 2,266 29 103
Ala. 37 91 1,250 1,748 - - 1,907 2,846 4 1
Miss. 15 66 267 61 2 - 325 451 29 -
W.S. CENTRAL 420 1,037 2,844 4,323 3 1 2,711 5,459 48 54
Ark. 18 69 228 313 2 - 440 906 2 1
La. 64 289 1,326 - 1 1 1,326 1,739 33 13
Okla. 32 26 1,290 1,577 - - 945 986 - 25
Tex. 306 653 - 2,433 - - - 1,828 13 15
MOUNTAIN 122 325 4,008 2,593 22 16 1,457 1,739 70 147
Mont. 7 3 137 - - - 10 4 3 6
Idaho 2 4 318 314 1 - 23 16 13 34
Wyo. 1 - 100 149 - - 12 9 23 41
Colo. 24 86 101 6 13 7 359 423 13 13
N. Mex. 5 20 877 808 4 1 317 198 10 24
Ariz. 30 94 1,704 375 N 6 564 866 5 19
Utah 10 39 292 338 1 - 36 57 1 6
Nev. 43 79 479 603 3 2 136 166 2 4
PACIFIC 770 2,471 11,462 15,131 33 9 2,890 5,095 150 85
Wash. 45 140 1,907 2,112 4 - 459 539 5 17
Oreg. 30 133 530 1,112 8 7 77 78 3 2
Calif. 682 2,173 8,460 11,415 18 2 2,156 4,277 106 32
Alaska 10 3 269 89 3 - 115 91 - 2
Hawaii 3 22 296 403 N - 83 110 36 32
Guam - 3 - 81 N - - 20 - -
P.R. 144 416 N N 4 U 175 28 8 12
V.I. 4 1 N N N U - - - -
Amer. Samoa - - - - N U - - - -
C.N.M.I. - - N N N U 7 11 2 -
------------------------------------------------------------------------------------------------------------------------------
N: Not notifiable U: Unavailable -: no reported cases C.N.M.I.: Commonwealth of North Mariana Islands
* Updated monthly to the Division of HIV/AIDS Prevention, National Center for HIV, STD, and TB Prevention, last update January 28, 1997.
** National Electronic Telecommunications System for Surveillance.
*** Public Health Laboratory Information System.
=======================================================================================================================================================
TABLE II. (page 2) Provisional cases of selected notifiable diseases, United States, weeks ending
March 15, 1997, and March 16, 1996 (11th Week)
Lyme Syphilis Rabies,
Legionellosis Disease Malaria (Primary & Secondary) Tuberculosis Animal
---------------- ---------------- ---------------- --------------------- ----------------- -------
Cum. Cum. Cum. Cum. Cum. Cum. Cum. Cum. Cum. Cum. Cum.
Reporting Area 1997 1996 1997 1996 1997 1996 1997 1996 1997 1996 1997
-------------------------------------------------------------------------------------------------------------------------------------------
UNITED STATES 170 140 445 868 231 200 1,422 2,574 2,278 2,851 1,120
NEW ENGLAND 13 4 41 65 5 4 32 41 68 77 174
Maine 1 1 - - - 1 - - - 3 36
N.H. 3 - 2 1 - - - 1 2 2 6
Vt. 2 - 1 - - 1 - - - - 25
Mass. 4 1 23 7 4 2 15 17 36 28 37
R.I. - 2 15 18 1 - - - 5 11 1
Conn. 3 N - 39 - - 17 23 25 33 69
MID. ATLANTIC 29 33 337 734 52 56 22 79 435 440 241
Upstate N.Y. 7 7 25 190 9 11 4 7 43 51 175
N.Y. City - 1 2 209 27 26 - 31 229 217 -
N.J. 3 5 66 66 13 16 2 18 94 102 17
Pa. 19 20 244 269 3 3 16 23 69 70 49
E.N. CENTRAL 67 53 8 4 11 24 145 415 348 400 2
Ohio 39 18 7 2 1 4 53 166 87 65 1
Ind. 7 12 1 2 1 1 31 57 21 31 1
Ill. - 5 - - - 8 16 103 187 255 -
Mich. 21 14 - - 9 7 22 38 33 39 -
Wis. - 4 U U - 4 23 51 20 10 -
W.N. CENTRAL 10 8 1 13 4 3 34 126 76 81 72
Minn. - - - - 1 - - 33 24 22 10
Iowa - - - 1 1 1 10 4 10 10 37
Mo. 4 3 - 4 2 1 14 79 30 31 7
N. Dak. 1 - - - - - - - 2 1 9
S. Dak. 1 1 - - - - - - 2 6 3
Nebr. 4 4 1 - - - - 5 - - -
Kans. - - - 8 - 1 10 5 8 11 6
S. ATLANTIC 23 12 35 34 65 31 659 825 376 428 520
Del. 2 1 - 6 2 2 4 10 - 9 2
Md. 13 2 23 19 18 11 142 122 33 48 99
D.C. 1 1 4 - 4 1 30 34 16 14 1
Va. 1 2 - - 13 5 61 100 16 25 92
W. Va. - 1 - 2 - - - 1 9 17 12
N.C. 3 3 2 4 3 4 166 215 54 40 174
S.C. 1 1 1 1 3 1 96 95 58 61 21
Ga. - - 1 - 9 2 107 189 76 101 57
Fla. 2 1 4 2 13 5 53 59 114 113 62
E.S. CENTRAL 6 10 14 6 6 3 322 651 148 253 54
Ky. - 3 1 3 1 1 30 37 26 41 8
Tenn. 2 4 2 3 1 1 171 201 9 75 37
Ala. 1 - - - 1 1 85 136 79 86 9
Miss. 3 3 11 - 3 - 36 277 34 51 -
W.S. CENTRAL - 1 1 1 3 8 151 289 36 193 22
Ark. - - - 1 1 - 16 71 23 20 6
La. - - - - 2 - 106 115 - - -
Okla. - 1 - - - - 29 29 13 30 16
Tex. - - 1 - - 8 - 74 - 143 -
MOUNTAIN 13 8 - - 14 15 29 31 81 101 5
Mont. - - - - 1 - - - 2 - 1
Idaho - - - - - - - 1 - 2 -
Wyo. 1 - - - 1 2 - 1 1 - -
Colo. 4 4 - - 7 8 - 11 18 24 -
N. Mex. - - - - 2 1 - - 4 7 1
Ariz. 3 1 - - - 1 24 15 37 53 3
Utah 4 - - - - 2 1 - 1 - -
Nev. 1 3 - - 3 1 4 3 18 15 -
PACIFIC 9 11 8 11 71 56 28 117 710 878 30
Wash. 1 - - - - - 3 - 38 44 -
Oreg. - - 2 4 5 4 1 1 24 38 1
Calif. 7 11 6 6 66 49 23 115 587 747 27
Alaska - - - - - - - - 20 17 2
Hawaii 1 - - 1 - 3 1 1 41 32 -
Guam - - - - - - - 2 - 26 -
P.R. - - - - 1 - 58 28 - - 10
V.I. - - - - - - - - - - -
Amer. Samoa - - - - - - - - - - -
C.N.M.I. - - - - - - 1 1 - - -
-------------------------------------------------------------------------------------------------------------------------------------------
N: Not notifiable U: Unavailable -: no reported cases
=======================================================================================================================================================
Return to top. Table_III Note: To print large tables and graphs users may have to change their printer settings to landscape and use a small font size.
TABLE III. (page 1) Provisional cases of selected notifiable diseases preventable by vaccination, United
States, weeks ending March 15, 1997, and March 16, 1996 (11th Week)
Hepatitis (Viral), by type Measles (Rubeola)
H. influenzae, --------------------------------------- ------------------------------------------------------------
invasive A B Indigenous Imported** Total
---------------- ----------------- ----------------- --------------- --------------- ---------------
Cum. Cum. Cum. Cum. Cum. Cum. Cum. Cum. Cum. Cum.
Reporting Area 1997* 1996 1997 1996 1997 1996 1997 1997 1997 1997 1997 1996
-----------------------------------------------------------------------------------------------------------------------------------------------------
UNITED STATES 255 258 4,831 5,494 1,410 1,730 2 7 - 4 11 46
NEW ENGLAND 8 7 81 54 22 32 - - - - - 6
Maine 2 - 3 8 3 2 - - - - - -
N.H. 1 5 6 3 2 1 - - - - - -
Vt. - - 4 - 1 2 - - - - - 1
Mass. 4 2 31 22 12 5 - - - - - 4
R.I. 1 - 4 2 2 1 - - - - - -
Conn. - - 33 19 2 21 - - - - - 1
MID. ATLANTIC 27 36 283 388 205 280 - 1 - 1 2 3
Upstate N.Y. 1 3 26 52 33 54 - 1 - 1 2 1
N.Y. City 11 4 116 195 72 133 - - - - - 2
N.J. 11 15 62 78 51 52 - - - - - -
Pa. 4 14 79 63 49 41 - - - - - -
E.N. CENTRAL 28 50 349 518 151 220 2 3 - 1 4 -
Ohio 20 31 106 212 20 25 - - - - - -
Ind. 4 1 53 83 10 21 - - - - - -
Ill. - 14 - 120 - 58 2 3 - - 3 -
Mich. 4 2 160 62 119 89 - - - 1 1 -
Wis. - 2 30 41 2 27 - - - - - -
W.N. CENTRAL 7 8 344 438 75 96 - - - - - -
Minn. 2 1 6 11 2 2 - - - - - -
Iowa 2 3 51 116 32 10 - - - - - -
Mo. 1 4 192 211 28 63 - - - - - -
N. Dak. - - 4 5 - - - - - - - -
S. Dak. 1 - 5 24 - - - - - - - -
Nebr. - - 28 41 3 7 - - - - - -
Kans. 1 - 58 30 10 14 - - - - - -
S. ATLANTIC 67 40 339 173 190 256 - - - - - 2
Del. - - 7 3 1 - - - - - - 1
Md. 21 14 86 41 37 67 - - - - - -
D.C. 2 - 10 6 13 3 - - - - - -
Va. 2 2 39 29 16 29 - - - - - -
W. Va. 1 - 3 5 4 8 - - - - - -
N.C. 7 6 51 25 47 81 - - - - - -
S.C. 4 2 21 16 11 17 - - - - - -
Ga. 15 15 38 - 13 - - - - - - -
Fla. 15 1 84 48 48 51 - - - - - 1
E.S. CENTRAL 11 8 129 414 147 137 - - - - - -
Ky. 1 2 19 6 4 18 - - - - - -
Tenn. 10 2 58 308 86 108 - - - - - -
Ala. - 3 30 60 15 11 - - - - - -
Miss. - 1 22 40 42 U - - - - - -
W.S. CENTRAL 9 8 848 844 103 124 - - - - - -
Ark. 1 - 60 114 15 18 - - - - - -
La. - - 44 14 16 11 - - - - - -
Okla. 7 8 359 415 3 13 - - - - - -
Tex. 1 - 385 301 69 82 - - - - - -
MOUNTAIN 22 19 862 797 191 218 - - - - - 3
Mont. - - 30 16 1 - - - - - - -
Idaho - 1 37 97 9 23 - - - - - -
Wyo. - - 10 6 7 5 - - - - - -
Colo. 2 3 109 78 46 35 - - - - - -
N. Mex. 1 6 62 117 64 86 - - - - - -
Ariz. 9 5 357 225 32 28 - - - - - -
Utah 2 3 190 196 19 29 - - - - - -
Nev. 8 1 67 62 13 12 - - - - - 3
PACIFIC 76 82 1,596 1,868 326 367 - 3 - 2 5 32
Wash. - - 106 110 11 18 - - - - - 4
Oreg. 11 10 97 282 33 32 - - - - - -
Calif. 62 70 1,349 1,442 273 314 - - - 2 2 1
Alaska 1 - 8 13 5 1 - - - - - 26
Hawaii 2 2 36 21 4 2 - 3 - - 3 1
Guam - - - 2 - - U - U - - -
P.R. - - 70 14 122 33 - - - - - -
V.I. - - - - - - U - U - - -
Amer. Samoa - - - - - - U - U - - -
C.N.M.I. 2 10 1 1 11 5 U 1 U - 1 -
-----------------------------------------------------------------------------------------------------------------------------------------------------
N: Not notifiable U: Unavailable -: no reported cases
* Of 51 cases among children aged <5 years, serotype was reported for 20 and of those, 9 were type b.
** For imported measles, cases include only those resulting from importation from other countries.
=======================================================================================================================================================
TABLE III. (page 2) Provisional cases of selected notifiable diseases preventable by vaccination, United
States, weeks ending March 15, 1997, and March 16, 1996 (11th Week)
Meningococcal
Disease Mumps Pertussis Rubella
----------------- -------------------------- --------------------------- ---------------------------
Cum. Cum. Cum. Cum. Cum. Cum. Cum. Cum.
Reporting Area 1997 1996 1997 1997 1996 1997 1997 1996 1997 1997 1996
------------------------------------------------------------------------------------------------------------------------------------------
UNITED STATES 821 858 23 110 125 67 883 491 1 5 34
NEW ENGLAND 50 34 3 5 - 3 239 118 - - 2
Maine 6 6 - - - - 6 3 - - -
N.H. 5 1 - - - - 35 13 - - -
Vt. 2 1 - - - 3 86 6 - - -
Mass. 30 10 - - - - 102 93 - - -
R.I. 1 5 3 4 - - 9 - - - -
Conn. 6 11 - 1 - - 1 3 - - 2
MID. ATLANTIC 64 86 3 10 19 10 49 53 - 2 4
Upstate N.Y. 20 16 - - 5 3 24 29 - 1 2
N.Y. City 12 11 - - 3 - 5 9 - 1 1
N.J. 15 18 - - 2 - - 3 - - 1
Pa. 17 41 3 10 9 7 20 12 - - -
E.N. CENTRAL 70 116 5 14 33 12 97 99 - 2 1
Ohio 44 45 - 3 14 3 45 41 - - -
Ind. 11 10 1 3 5 6 8 6 - - -
Ill. - 35 3 5 8 3 15 19 - - 1
Mich. 7 8 1 3 6 - 17 8 - - -
Wis. 8 18 - - - - 12 25 - 2 -
W.N. CENTRAL 67 78 1 5 2 6 44 8 - - -
Minn. 2 3 1 3 - 6 31 1 - - -
Iowa 17 12 - 2 - - 9 2 - - -
Mo. 32 41 - - - - - 3 - - -
N. Dak. - 1 - - 2 - 1 - - - -
S. Dak. 3 2 - - - - 1 - - - -
Nebr. 4 8 - - - - 2 1 - - -
Kans. 9 11 - - - - - 1 - - -
S. ATLANTIC 175 116 6 19 15 4 77 36 - - -
Del. 3 2 - - - - - 5 - - -
Md. 18 15 1 2 8 - 32 21 - - -
D.C. 1 2 - - - - 2 - - - -
Va. 10 14 - 1 2 - 13 - - - -
W. Va. 1 4 - - - - 3 - - - -
N.C. 36 22 1 5 - 1 13 - - - -
S.C. 32 17 - 1 3 - 3 - - - -
Ga. 29 32 - 2 1 - 3 1 - - -
Fla. 45 8 4 8 1 3 8 9 - - -
E.S. CENTRAL 67 72 1 9 6 - 21 14 - - -
Ky. 14 8 - - - - 1 6 - - -
Tenn. 27 22 - 3 1 - 7 5 - - -
Ala. 19 23 1 3 3 - 7 1 - - -
Miss. 7 19 - 3 2 - 6 2 - - N
W.S. CENTRAL 68 97 3 12 3 - 10 6 - - -
Ark. 16 9 - - - - 3 2 - - -
La. 14 18 2 2 3 - 2 2 - - -
Okla. 8 5 - - - - - 1 - - -
Tex. 30 65 1 10 - - 5 1 - - -
MOUNTAIN 54 56 - 4 6 9 167 56 - - -
Mont. 4 1 - - - 3 3 2 - - -
Idaho 4 7 - 1 - 6 102 8 - - -
Wyo. - 3 - - - - 3 - - - -
Colo. 12 7 - 2 - - 47 10 - - -
N. Mex. 11 12 N N N - 7 15 - - -
Ariz. 12 16 - - 1 - 5 3 - - -
Utah 8 4 - 1 - - - 1 - - -
Nev. 3 6 - - 5 - - 17 - - -
PACIFIC 206 203 1 32 41 23 179 101 1 1 27
Wash. 21 18 - 3 3 16 58 23 - - 1
Oreg. 53 32 - - - 2 6 18 - - -
Calif. 131 148 - 23 31 5 110 55 1 1 24
Alaska - 3 1 1 1 - 1 - - - -
Hawaii 1 2 - 5 6 - 4 5 - - 2
Guam - 1 U - 1 U - - U - -
P.R. 2 - - - 1 - - - - - -
V.I. - - U - - U - - U - -
Amer. Samoa - - U - - U - - U - -
C.N.M.I. - - U - - U - - U - -
------------------------------------------------------------------------------------------------------------------------------------------
N: Not notifiable U: Unavailable -: no reported cases
=======================================================================================================================================================
Return to top. Table_IV Note: To print large tables and graphs users may have to change their printer settings to landscape and use a small font size.
TABLE IV. Deaths in 122 U.S. cities,* week ending
March 15, 1997 (11th Week)
===================================================================================================================================
All Causes, By Age (Years)
------------------------------------------------------------------------ P&I**
Reporting Area All Ages >=65 45-64 25-44 1-24 <1 Total
---------------------------------------------------------------------------------------------------------------
NEW ENGLAND 566 413 89 43 13 8 47
Boston, Mass. 165 108 37 8 8 4 15
Bridgeport, Conn. 50 36 10 4 - - 4
Cambridge, Mass. 25 20 1 4 - - -
Fall River, Mass. 35 27 5 3 - - 2
Hartford, Conn. U U U U U U U
Lowell, Mass. 24 20 3 1 - - 3
Lynn, Mass. 15 11 4 - - - -
New Bedford, Mass. 20 18 2 - - - 4
New Haven, Conn. 32 23 3 5 - 1 4
Providence, R.I. 65 48 5 8 2 2 -
Somerville, Mass. 3 3 - - - - -
Springfield, Mass. 40 25 11 4 - - 3
Waterbury, Conn. 34 29 3 2 - - 3
Worcester, Mass. 58 45 5 4 3 1 9
MID. ATLANTIC 2,284 1,569 453 206 33 23 157
Albany, N.Y. 36 27 7 2 - - 3
Allentown, Pa. 27 22 5 - - - 3
Buffalo, N.Y. U U U U U U U
Camden, N.J. U U U U U U U
Elizabeth, N.J. 21 13 5 2 - 1 -
Erie, Pa.*** 28 25 3 - - - 3
Jersey City, N.J. 46 22 13 8 1 2 1
New York City, N.Y. 1,274 847 277 117 18 15 61
Newark, N.J. 93 43 25 20 5 - 7
Paterson, N.J. U U U U U U U
Philadelphia, Pa. 399 284 74 32 7 2 38
Pittsburgh, Pa.*** 46 41 5 - - - 7
Reading, Pa. 5 4 1 - - - -
Rochester, N.Y. 144 108 19 15 1 1 11
Schenectady, N.Y. U U U U U U U
Scranton, Pa.*** 36 29 6 1 - - 4
Syracuse, N.Y. 71 58 5 6 - 2 9
Trenton, N.J. 36 26 6 3 1 - 8
Utica, N.Y. 22 20 2 - - - 2
Yonkers, N.Y. U U U U U U U
E.N. CENTRAL 2,116 1,486 380 149 51 47 154
Akron, Ohio 48 35 9 - 2 2 -
Canton, Ohio 38 29 5 3 - 1 6
Chicago, Ill. 466 282 101 54 17 9 33
Cincinnati, Ohio 101 75 17 4 1 4 9
Cleveland, Ohio 152 101 39 7 3 2 3
Columbus, Ohio 205 151 29 11 6 8 26
Dayton, Ohio 135 99 25 3 5 3 15
Detroit, Mich. 204 117 42 29 10 6 6
Evansville, Ind. 36 30 5 1 - - 3
Fort Wayne, Ind. 55 47 4 4 - - 5
Gary, Ind. U U U U U U U
Grand Rapids, Mich. 68 52 12 4 - - 6
Indianapolis, Ind. 160 111 32 12 3 2 9
Lansing, Mich. 37 30 5 1 1 - -
Milwaukee, Wis. 133 107 18 2 1 5 12
Peoria, Ill. 39 34 2 3 - - 1
Rockford, Ill. 39 30 6 - 1 2 4
South Bend, Ind. 44 35 3 4 1 1 2
Toledo, Ohio 95 77 16 1 - 1 13
Youngstown, Ohio 61 44 10 6 - 1 1
W.N. CENTRAL 698 485 110 50 13 18 48
Des Moines, Iowa U U U U U U U
Duluth, Minn. 37 29 6 1 1 - 6
Kansas City, Kans. 24 13 5 6 - - -
Kansas City, Mo. 102 60 10 8 - 2 6
Lincoln, Nebr. 49 40 5 3 1 - 2
Minneapolis, Minn. 188 143 31 9 3 2 17
Omaha, Nebr. 64 45 12 2 2 3 5
St. Louis, Mo. 97 58 16 11 4 8 5
St. Paul, Minn. 73 56 12 2 1 2 4
Wichita, Kans. 64 41 13 8 1 1 3
S. ATLANTIC 1,380 891 280 119 60 29 79
Atlanta, Ga. U U U U U U U
Baltimore, Md. 244 153 50 22 14 5 25
Charlotte, N.C. 85 52 23 6 2 2 7
Jacksonville, Fla. 168 104 41 14 4 5 6
Miami, Fla. 106 64 22 10 7 2 -
Norfolk, Va. 56 44 6 3 1 2 3
Richmond, Va. 94 55 27 10 2 - 7
Savannah, Ga. 48 30 12 1 3 2 3
St. Petersburg, Fla. 76 61 6 4 2 3 7
Tampa, Fla. 183 139 25 12 4 3 15
Washington, D.C. 303 182 68 32 16 5 6
Wilmington, Del. 17 7 - 5 5 - -
E.S. CENTRAL 628 441 116 45 12 14 66
Birmingham, Ala. U U U U U U U
Chattanooga, Tenn. 73 52 14 6 - 1 11
Knoxville, Tenn. 91 65 20 4 1 1 11
Lexington, Ky. 73 52 11 7 2 1 13
Memphis, Tenn. 131 90 26 8 3 4 13
Mobile, Ala. 50 31 13 4 1 1 3
Montgomery, Ala. 64 49 10 4 - 1 7
Nashville, Tenn. 146 102 22 12 5 5 8
W.S. CENTRAL 1,640 1,093 314 146 47 40 118
Austin, Tex. 73 47 12 7 3 4 7
Baton Rouge, La. 48 33 10 4 1 - 1
Corpus Christi, Tex. 65 44 14 5 1 1 5
Dallas, Tex. 208 117 45 25 15 6 4
El Paso, Tex. 104 79 13 8 2 2 11
Ft. Worth, Tex. 116 87 16 10 - 3 11
Houston, Tex. 415 271 79 46 8 11 35
Little Rock, Ark. 79 48 18 7 5 1 7
New Orleans, La. 104 66 16 13 6 3 -
San Antonio, Tex. 247 174 50 14 3 6 14
Shreveport, La. 59 40 13 3 1 2 5
Tulsa, Okla. 122 87 28 4 2 1 18
MOUNTAIN 995 723 163 54 27 28 104
Albuquerque, N.M. 97 73 13 5 2 4 5
Boise, Idaho 47 36 5 2 2 2 6
Colo. Springs, Colo. 58 46 6 3 1 2 6
Denver, Colo. 111 77 20 7 5 2 13
Las Vegas, Nev. 193 138 36 9 7 3 16
Ogden, Utah 23 19 1 1 1 1 1
Phoenix, Ariz. 158 107 34 10 - 7 17
Pueblo, Colo. 36 27 4 2 2 1 6
Salt Lake City, Utah 101 71 15 5 6 4 8
Tucson, Ariz. 171 129 29 10 1 2 26
PACIFIC 1,953 1,371 336 157 47 41 169
Berkeley, Calif. 23 19 3 - - 1 1
Fresno, Calif. 98 63 19 8 2 6 7
Glendale, Calif. 31 24 5 2 - - 3
Honolulu, Hawaii 107 82 15 7 1 2 6
Long Beach, Calif. 87 61 17 6 2 1 11
Los Angeles, Calif. 543 374 99 45 16 9 35
Pasadena, Calif. 34 23 8 1 1 1 4
Portland, Oreg. 152 117 21 9 5 - 12
Sacramento, Calif. U U U U U U U
San Diego, Calif. 185 121 30 18 8 8 26
San Francisco, Calif. 135 78 33 18 4 2 12
San Jose, Calif. 222 166 37 12 2 5 23
Santa Cruz, Calif. 41 33 5 1 - 1 10
Seattle, Wash. 147 99 24 19 2 3 4
Spokane, Wash. 65 52 8 4 1 - 7
Tacoma, Wash. 83 59 12 7 3 2 8
TOTAL 12,260**** 8,472 2,241 969 303 248 942
---------------------------------------------------------------------------------------------------------------
U: Unavailable -: no reported cases
* Mortality data in this table are voluntarily reported from 122 cities in the United States, most of which have populations
of 100,000 or more. A death is reported by the place of its occurrence and by the week that the death certificate was
filed. Fetal deaths are not included.
** Pneumonia and influenza.
*** Because of changes in reporting methods in these 3 Pennsylvania cities, these numbers are partial counts for the current
week. Complete counts will be available in 4 to 6 weeks.
**** Total includes unknown ages.
===================================================================================================================================
Return to top. Disclaimer All MMWR HTML versions of articles are electronic conversions from ASCII text into HTML. This conversion may have resulted in character translation or format errors in the HTML version. Users should not rely on this HTML document, but are referred to the electronic PDF version and/or the original MMWR paper copy for the official text, figures, and tables. An original paper copy of this issue can be obtained from the Superintendent of Documents, U.S. Government Printing Office (GPO), Washington, DC 20402-9371; telephone: (202) 512-1800. Contact GPO for current prices. **Questions or messages regarding errors in formatting should be addressed to mmwrq@cdc.gov.Page converted: 09/19/98 |
|||||||||
This page last reviewed 5/2/01
|