 |
|
|
|
|
|
|
| ||||||||||
|
|
|
|
|
|
|
||||
| ||||||||||
|
|
|
|
|
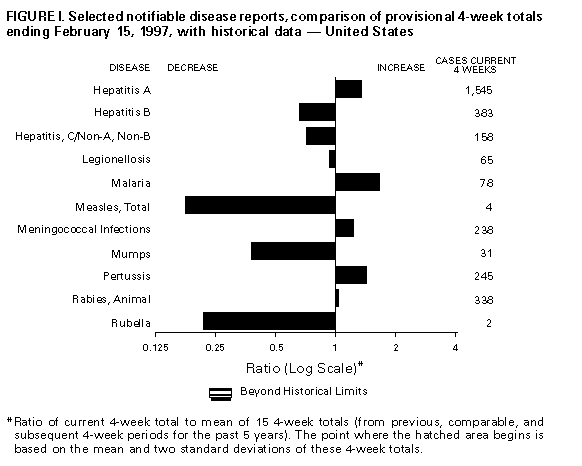
Persons using assistive technology might not be able to fully access information in this file. For assistance, please send e-mail to: mmwrq@cdc.gov. Type 508 Accommodation and the title of the report in the subject line of e-mail. Notifiable Diseases/Deaths in Selected Cities Weekly InformationFigure_I Selected notifiable disease reports, comparison of provisional 4-week totals ending February 15, 1997, with historical data -- United States Table_I Summary -- provisional cases of selected notifiable diseases, United States, cumulative, week ending February 15, 1997 (7th Week) Table_II Provisional cases of selected notifiable diseases, United States, weeks ending February 15, 1997 and February 17, 1996 (7th Week) Table_III Provisional cases of selected notifiable diseases preventable by vaccination, United States, weeks ending February 15, 1997 and February 17, 1996 (7th Week) Table_IV Deaths in 122 U.S. cities, week ending
February 15, 1997 (7th Week)
TABLE I. Summary -- provisional cases of specified notifiable diseases, United
States, cumulative, week ending February 15, 1997 (7th Week)
==================================================================================
                                             Cum. 1997
------------------------------------------------------
Anthrax                                              -
Brucellosis                                          4
Cholera                                              -
Congenital rubella syndrome                          1
Cryptosporidiosis*                                 108
Diphtheria                                           -
Encephalitis:  California*                           -
               eastern equine*                       -
               St. Louis*                            -
               western equine*                       -
Hansen Disease                                      10
Hantavirus pulmonary syndrome*+                      -
Hemolytic uremic syndrome, post-diarrheal*           7
HIV infection, pediatric*&                          19
Plague                                               -
Poliomyelitis, paralytic                             -
Psittacosis                                          2
Rabies, human                                        -
Rocky Mountain spotted fever (RMSF)                  8
Streptococcal disease, invasive Group A             99
Streptococcal toxic-shock syndrome*                  5
Syphilis, congenital@                                -
Tetanus                                              2
Toxic-shock syndrome                                13
Trichinosis                                          2
Typhoid fever                                       27
Yellow fever                                         -
------------------------------------------------------
-: no reported cases
 * Not notifiable in all states
 + Updated weekly from reports to the Division of Viral and Rickettsial
   Diseases, National Center for Infectious Diseases (NCID).
 & Updated monthly to the Division of HIV/AIDS Prevention, National Center
   for HIV, STD, and TB Prevention (NCHSTP), last update January 28, 1997.
 @ Updated quarterly from reports to the Division of STD Prevention,
   NCHSTP.

==================================================================================
Return to top. Table_II Note: To print large tables and graphs users may have to change their printer settings to landscape and use a small font size.
TABLE II. (page 1) Provisional cases of selected notifiable diseases, United States, weeks ending
February 15, 1997, and February 17, 1996 (7th Week)
Escherichia
coli O157:H7
------------------- Hepatitis
AIDS* Chlamydia NETSS** PHLIS*** Gonorrhea C\NA,NB
----------------- -------------------- -------- -------- ------------------- ----------------
Cum. Cum. Cum. Cum. Cum. Cum. Cum. Cum. Cum. Cum.
Reporting Area 1997 1996 1997 1996 1997 1997 1997 1996 1997 1996
------------------------------------------------------------------------------------------------------------------------------
UNITED STATES 5,109 6,331 33,897 43,828 108 42 25,380 41,867 258 343
NEW ENGLAND 134 332 1,805 2,427 10 5 642 1,051 1 8
Maine 13 7 49 - - - 3 3 - -
N.H. 1 14 73 76 - - 29 15 - -
Vt. 7 5 49 59 1 1 8 14 - 4
Mass. 62 246 965 917 8 4 317 381 1 4
R.I. 19 9 290 311 - - 78 73 - -
Conn. 32 51 379 1,064 1 - 207 565 - -
MID. ATLANTIC 1,921 1,439 2,459 2,680 8 - 1,559 3,596 22 15
Upstate N.Y. 113 238 N N 5 - 134 2 13 11
N.Y. City 1,039 709 - 1,932 1 - - 1,650 - 1
N.J. 468 353 707 748 2 - 442 448 - -
Pa. 301 139 1,752 - N - 983 1,496 9 3
E.N. CENTRAL 242 494 5,522 12,140 12 7 4,058 8,506 62 59
Ohio 57 143 1,484 2,700 8 6 1,156 2,054 4 2
Ind. 25 50 563 1,196 1 - 535 986 1 -
Ill. 115 163 1,464 3,454 - - 707 2,518 - 13
Mich. 29 106 1,558 3,281 3 - 1,366 2,221 57 44
Wis. 16 32 453 1,509 N 1 294 727 - -
W.N. CENTRAL 127 214 2,368 3,547 19 9 1,057 1,845 14 8
Minn. 17 56 - 562 10 7 U - - -
Iowa 38 17 605 59 6 - 157 25 6 1
Mo. 54 87 1,143 1,586 1 - 710 1,357 2 5
N. Dak. 2 - 81 90 2 1 5 5 1 -
S. Dak. - 2 127 123 - - 18 19 - -
Nebr. 15 15 60 500 - - 6 91 - 2
Kans. 1 37 352 627 - 1 161 348 5 -
S. ATLANTIC 1,239 1,522 8,989 5,849 10 - 10,680 14,379 27 17
Del. 20 32 - - - - 146 226 - -
Md. 166 70 649 616 - - 1,606 1,874 3 -
D.C. 55 65 N N - - 686 612 - -
Va. 130 94 1,486 1,631 N - 1,242 1,384 1 1
W. Va. 14 19 - - N - 73 45 - 3
N.C. 59 1 2,502 U 2 - 2,240 2,686 8 5
S.C. 104 12 922 U - - 1,500 1,888 9 1
Ga. 183 214 711 1,001 3 - 1,024 3,230 U -
Fla. 508 1,015 2,719 2,601 5 - 2,163 2,434 6 7
E.S. CENTRAL 134 173 3,069 3,627 12 3 3,201 4,215 37 65
Ky. 23 61 807 972 3 - 579 582 1 -
Tenn. 59 57 1,475 1,491 8 3 1,376 1,462 14 65
Ala. 37 35 787 1,135 - - 1,246 1,880 1 -
Miss. 15 20 - 29 1 - - 291 21 -
W.S. CENTRAL 420 579 1,633 3,491 2 1 1,839 4,193 23 39
Ark. 18 44 156 190 2 - 314 592 1 -
La. 64 171 760 - - 1 917 1,173 14 7
Okla. 32 2 717 868 - - 608 600 - 25
Tex. 306 362 - 2,433 - - - 1,828 8 7
MOUNTAIN 122 160 2,462 1,409 18 13 887 1,116 48 92
Mont. 7 2 85 - - - 6 2 3 3
Idaho 2 1 195 190 - - 16 9 9 21
Wyo. 1 - 61 85 - - 6 6 19 27
Colo. 24 84 - - 12 5 216 283 9 10
N. Mex. 5 8 569 506 3 1 138 139 3 19
Ariz. 30 37 1,105 64 N 5 387 521 4 7
Utah 10 22 154 180 1 - 19 45 - 4
Nev. 43 6 293 384 2 2 99 111 1 1
PACIFIC 770 1,418 5,590 8,658 17 2 1,457 2,966 24 40
Wash. 45 65 1,174 1,310 1 - 312 358 1 5
Oreg. 30 92 194 726 3 2 31 32 3 2
Calif. 682 1,251 3,924 6,334 13 - 1,002 2,435 - 13
Alaska 10 3 177 55 - - 71 65 - 1
Hawaii 3 7 121 233 N - 41 76 20 19
Guam - - - 55 N - - 16 - -
P.R. 144 248 N N - U 46 28 - 6
V.I. 4 1 N N N U - - - -
Amer. Samoa - - - - N U - - - -
C.N.M.I. - - N N N U - 7 - -
------------------------------------------------------------------------------------------------------------------------------
N: Not notifiable U: Unavailable -: no reported cases C.N.M.I.: Commonwealth of North Mariana Islands
* Updated monthly to the Division of HIV/AIDS Prevention, National Center for HIV, STD, and TB Prevention, last update January 28, 1997.
** National Electronic Telecommunications System for Surveillance.
*** Public Health Laboratory Information System.
=======================================================================================================================================================
TABLE II. (page 2) Provisional cases of selected notifiable diseases, United States, weeks ending
February 15, 1997, and February 17, 1996 (7th Week)
Lyme Syphilis Rabies,
Legionellosis Disease Malaria (Primary & Secondary) Tuberculosis Animal
---------------- ---------------- ---------------- --------------------- ----------------- -------
Cum. Cum. Cum. Cum. Cum. Cum. Cum. Cum. Cum. Cum. Cum.
Reporting Area 1997 1996 1997 1996 1997 1996 1997 1996 1997 1996 1997
-------------------------------------------------------------------------------------------------------------------------------------------
UNITED STATES 102 100 223 531 135 121 750 1,629 1,052 1,567 593
NEW ENGLAND 6 4 19 43 4 3 17 28 24 32 81
Maine - 1 - - - - - - - 2 17
N.H. - - 1 - - - - - 1 - 2
Vt. 2 - 1 - - 1 - - - - 16
Mass. 3 1 8 - 3 2 8 12 7 7 10
R.I. - 2 9 12 1 - - - 4 7 -
Conn. 1 N - 31 - - 9 16 12 16 36
MID. ATLANTIC 19 18 165 454 22 43 9 36 145 184 140
Upstate N.Y. 6 3 10 65 5 9 - 4 13 22 107
N.Y. City - - 1 154 9 21 - 15 76 66 -
N.J. 2 4 39 47 7 11 1 6 36 47 12
Pa. 11 11 115 188 1 2 8 11 20 49 21
E.N. CENTRAL 43 41 3 2 7 15 83 291 165 252 1
Ohio 29 14 2 1 1 1 29 120 46 46 -
Ind. - 8 1 1 1 1 13 37 13 16 1
Ill. - 3 - - - 6 14 79 103 170 -
Mich. 14 13 - - 5 5 14 23 - 17 -
Wis. - 3 U U - 2 13 32 3 3 -
W.N. CENTRAL 1 5 - 6 1 2 28 67 37 29 45
Minn. - - - - - - - 4 16 6 5
Iowa - - - 1 1 1 10 4 4 5 26
Mo. 1 2 - 1 - 1 14 51 9 9 6
N. Dak. - - - - - - - - 1 - 7
S. Dak. - - - - - - - - 1 5 -
Nebr. - 3 - - - - - 3 - - -
Kans. - - - 4 - - 4 5 6 4 1
S. ATLANTIC 17 10 21 17 43 21 291 479 148 171 287
Del. 1 1 - 3 1 2 3 9 - 7 2
Md. 9 1 16 11 13 7 - 65 16 19 57
D.C. 1 1 3 - 3 1 15 14 6 7 1
Va. - 2 - - 8 5 40 58 16 1 53
W. Va. - 1 - 2 - - - 1 6 10 5
N.C. 3 3 1 1 1 2 96 122 26 24 90
S.C. - 1 - - 3 - 51 62 27 41 12
Ga. - - 1 - 7 2 51 118 31 32 28
Fla. 3 - - - 7 2 35 30 20 30 39
E.S. CENTRAL 4 7 10 5 5 - 186 427 59 140 13
Ky. - 3 1 2 1 - 18 32 14 26 6
Tenn. 1 2 2 3 1 - 109 114 9 28 -
Ala. 1 - - - 1 - 59 89 36 57 7
Miss. 2 2 7 - 2 - - 192 - 29 -
W.S. CENTRAL - - - - - 1 102 209 17 88 14
Ark. - - - - - - 11 47 11 10 3
La. - - - - - - 71 69 - - -
Okla. - - - - - - 20 19 6 15 11
Tex. - - - - - 1 - 74 - 63 -
MOUNTAIN 8 7 - - 9 6 21 24 26 70 2
Mont. - - - - 1 - - - - - 1
Idaho - - - - - - - - - 1 -
Wyo. - - - - 1 - - - 1 - -
Colo. 3 4 - - 6 4 - 8 9 16 -
N. Mex. - - - - - 1 - - - 5 -
Ariz. 3 1 - - - - 18 14 13 41 1
Utah 2 - - - - 1 - - 1 - -
Nev. - 2 - - 1 - 3 2 2 7 -
PACIFIC 4 8 5 4 44 30 13 68 431 601 10
Wash. 1 - - - - - - - 14 31 -
Oreg. - - 1 2 2 4 1 1 1 24 -
Calif. 3 8 4 2 42 25 12 66 378 517 10
Alaska - - - - - - - - 13 13 -
Hawaii - - - - - 1 - 1 25 16 -
Guam - - - - - - - 2 - - -
P.R. - - - - 1 - 18 15 - - 2
V.I. - - - - - - - - - - -
Amer. Samoa - - - - - - - - - - -
C.N.M.I. - - - - - - - - - - -
-------------------------------------------------------------------------------------------------------------------------------------------
N: Not notifiable U: Unavailable -: no reported cases
=======================================================================================================================================================
Return to top. Table_III Note: To print large tables and graphs users may have to change their printer settings to landscape and use a small font size.
TABLE III. (page 1) Provisional cases of selected notifiable diseases preventable by vaccination, United
States, weeks ending February 15, 1997, and February 17, 1996 (7th Week)
Hepatitis (Viral), by type Measles (Rubeola)
H. influenzae, --------------------------------------- ------------------------------------------------------------
invasive A B Indigenous Imported** Total
---------------- ----------------- ----------------- --------------- --------------- ---------------
Cum. Cum. Cum. Cum. Cum. Cum. Cum. Cum. Cum. Cum.
Reporting Area 1997* 1996 1997 1996 1997 1996 1997 1997 1997 1997 1997 1996
-----------------------------------------------------------------------------------------------------------------------------------------------------
UNITED STATES 143 166 2,734 3,259 739 1,007 - 3 1 3 6 11
NEW ENGLAND 6 4 47 26 13 18 - - - - - 4
Maine 2 - 2 4 1 - - - - - - -
N.H. 1 4 3 2 1 - - - - - - -
Vt. - - 3 - - 1 - - - - - 1
Mass. 2 - 16 10 8 1 - - - - - 3
R.I. 1 - 2 2 1 1 - - - - - -
Conn. - - 21 8 2 15 - - - - - -
MID. ATLANTIC 15 24 168 247 100 175 - - - - - 2
Upstate N.Y. 1 3 11 29 15 21 - - - - - 1
N.Y. City 5 4 62 124 40 90 - - - - - 1
N.J. 7 10 59 47 28 34 - - - - - -
Pa. 2 7 36 47 17 30 - - - - - -
E.N. CENTRAL 15 31 170 343 75 123 - - - 1 1 -
Ohio 15 18 76 143 13 16 - - - - - -
Ind. - - 23 41 5 3 U - U - - -
Ill. - 12 - 86 - 41 - - - - - -
Mich. - - 68 42 57 48 U - U 1 1 -
Wis. - 1 3 31 - 15 - - - - - -
W.N. CENTRAL 4 6 181 255 44 65 - - - - - -
Minn. 2 - 1 - - - - - - - - -
Iowa 1 3 30 64 23 7 - - - - - -
Mo. 1 3 96 129 13 44 - - - - - -
N. Dak. - - - 2 - - - - - - - -
S. Dak. - - 5 9 - - - - - - - -
Nebr. - - 11 24 1 5 - - - - - -
Kans. - - 38 27 7 9 - - - - - -
S. ATLANTIC 41 30 221 93 89 146 - - - - - -
Del. - - 6 1 1 - - - - - - -
Md. 10 10 65 25 25 43 - - - - - -
D.C. 2 - 4 3 6 1 - - - - - -
Va. 2 2 21 11 10 17 - - - - - -
W. Va. - - 1 3 2 3 - - - - - -
N.C. 6 5 30 19 16 55 - - - - - -
S.C. 3 1 11 9 7 6 - - - - - -
Ga. 3 12 28 - - - - - - - - -
Fla. 15 - 55 22 22 21 - - - - - -
E.S. CENTRAL 8 4 82 232 89 91 - - - - - -
Ky. 1 - 7 4 1 6 - - - - - -
Tenn. 7 2 38 189 57 80 - - - - - -
Ala. - 2 18 9 5 5 - - - - - -
Miss. - - 19 30 26 U U - U - - -
W.S. CENTRAL 5 7 345 461 28 46 - - - - - -
Ark. - - 41 71 6 6 - - - - - -
La. - - 6 6 3 5 - - - - - -
Okla. 4 7 192 253 - 7 - - - - - -
Tex. 1 - 106 131 19 28 - - - - - -
MOUNTAIN 7 10 547 474 113 138 - - - - - 3
Mont. - - 18 9 - - - - - - - -
Idaho - 1 28 65 2 15 - - - - - -
Wyo. - - 3 4 6 3 - - - - - -
Colo. 1 1 74 37 29 20 - - - - - -
N. Mex. 1 4 33 84 37 56 - - - - - -
Ariz. 2 2 229 128 24 14 - - - - - -
Utah 1 1 137 106 12 24 - - - - - -
Nev. 2 1 25 41 3 6 - - - - - 3
PACIFIC 42 50 973 1,128 188 205 - 3 1 2 5 2
Wash. - - 48 46 4 8 - - - - - 1
Oreg. 6 5 63 176 23 21 - - - - - -
Calif. 34 43 847 879 154 174 - - 1 2 2 -
Alaska - - 4 11 4 1 - - - - - -
Hawaii 2 2 11 16 3 1 U 3 U - 3 1
Guam - - - 2 - - U - U - - -
P.R. - - 4 11 9 18 U - U - - -
V.I. - - - - - - U - U - - -
Amer. Samoa - - - - - - U - U - - -
C.N.M.I. - 10 - 1 - 3 U - U - - -
-----------------------------------------------------------------------------------------------------------------------------------------------------
N: Not notifiable U: Unavailable -: no reported cases
* Of 24 cases among children aged <5 years, serotype was reported for 6 and of those, 4 were type b.
** For imported measles, cases include only those resulting from importation from other countries.
=======================================================================================================================================================
TABLE III. (page 2) Provisional cases of selected notifiable diseases preventable by vaccination, United
States, weeks ending February 15, 1997, and February 17, 1996 (7th Week)
Meningococcal
Disease Mumps Pertussis Rubella
----------------- -------------------------- --------------------------- ---------------------------
Cum. Cum. Cum. Cum. Cum. Cum. Cum. Cum.
Reporting Area 1997 1996 1997 1997 1996 1997 1997 1996 1997 1997 1996
------------------------------------------------------------------------------------------------------------------------------------------
UNITED STATES 442 562 8 40 73 50 477 252 - 1 15
NEW ENGLAND 31 24 1 1 - 9 137 66 - - -
Maine 3 5 - - - - 4 2 - - -
N.H. 3 1 - - - - 23 4 - - -
Vt. - 1 - - - 4 59 6 - - -
Mass. 19 4 - - - - 46 54 - - -
R.I. 2 5 1 1 - 5 5 - - - -
Conn. 4 8 - - - - - - - - -
MID. ATLANTIC 24 47 2 4 11 4 20 29 - 1 1
Upstate N.Y. 4 4 - - 2 - 11 19 - - -
N.Y. City 4 9 - - 2 - 2 6 - 1 -
N.J. 6 12 - - 2 - - 2 - - 1
Pa. 10 22 2 4 5 4 7 2 - - -
E.N. CENTRAL 40 73 1 7 17 4 44 53 - - -
Ohio 31 29 1 3 10 4 34 24 - - -
Ind. 6 6 U 2 1 U - 2 U - -
Ill. - 23 - 1 1 - 3 3 - - -
Mich. 3 4 U 1 5 U 7 5 U - -
Wis. - 11 - - - - - 19 - - -
W.N. CENTRAL 35 52 - 2 2 9 21 5 - - -
Minn. 2 - - - - 7 10 1 - - -
Iowa 10 9 - 2 - 2 8 - - - -
Mo. 12 29 - - - - - 3 - - -
N. Dak. - 1 - - 2 - 1 - - - -
S. Dak. 3 2 - - - - 1 - - - -
Nebr. 3 4 - - - - 1 1 - - -
Kans. 5 7 - - - - - - - - -
S. ATLANTIC 111 76 3 3 9 10 33 16 - - -
Del. 2 1 - - - - - - - - -
Md. 10 10 - - 4 6 25 13 - - -
D.C. 1 2 - - - - 2 - - - -
Va. 6 5 1 1 2 2 2 - - - -
W. Va. 1 3 - - - 1 1 - - - -
N.C. 20 12 - - - - - - - - -
S.C. 22 15 - - 2 1 2 - - - -
Ga. 22 23 - - 1 - - 1 - - -
Fla. 27 5 2 2 - - 1 2 - - -
E.S. CENTRAL 42 48 - 6 3 1 13 7 - - -
Ky. 6 6 - - - - - 5 - - -
Tenn. 18 12 - 2 - - 3 1 - - -
Ala. 13 16 - 2 3 1 6 1 - - -
Miss. 5 14 U 2 - U 4 - U - N
W.S. CENTRAL 22 69 - 3 3 - 4 3 - - -
Ark. 8 7 - - - - 3 2 - - -
La. 2 15 - - 3 - - 1 - - -
Okla. 4 3 - - - - - - - - -
Tex. 8 44 - 3 - - 1 - - - -
MOUNTAIN 29 40 - 2 3 8 123 27 - - -
Mont. 1 1 - - - - - 2 - - -
Idaho 3 3 - - - 5 81 - - - -
Wyo. - 2 - - - - 3 - - - -
Colo. 2 4 - 1 - 3 29 - - - -
N. Mex. 7 9 N N N - 6 9 - - -
Ariz. 11 13 - - - - 4 3 - - -
Utah 3 3 - 1 - - - - - - -
Nev. 2 5 - - 3 - - 13 - - -
PACIFIC 108 133 1 12 25 5 82 46 - - 14
Wash. 10 7 - 2 2 - 13 5 - - -
Oreg. 33 24 - - - - 3 15 - - -
Calif. 65 98 1 6 17 5 64 24 - - 14
Alaska - 2 - - 1 - 1 - - - -
Hawaii - 2 U 4 5 U 1 2 U - -
Guam - 1 U - 1 U - - U - -
P.R. - - U - - U - - U - -
V.I. - - U - - U - - U - -
Amer. Samoa - - U - - U - - U - -
C.N.M.I. - - U - - U - - U - -
------------------------------------------------------------------------------------------------------------------------------------------
N: Not notifiable U: Unavailable -: no reported cases
=======================================================================================================================================================
Return to top. Table_IV Note: To print large tables and graphs users may have to change their printer settings to landscape and use a small font size.
TABLE IV. Deaths in 122 U.S. cities,* week ending
February 15, 1997 (7th Week)
===================================================================================================================================
All Causes, By Age (Years)
------------------------------------------------------------------------ P&I**
Reporting Area All Ages >=65 45-64 25-44 1-24 <1 Total
---------------------------------------------------------------------------------------------------------------
NEW ENGLAND 646 477 107 37 14 11 45
Boston, Mass. 136 83 30 11 5 7 11
Bridgeport, Conn. 58 48 6 2 1 1 4
Cambridge, Mass. 25 18 4 3 - - 2
Fall River, Mass. 33 27 4 1 1 - -
Hartford, Conn. 54 41 8 5 - - 3
Lowell, Mass. 32 26 5 1 - - 3
Lynn, Mass. 20 16 2 2 - - 1
New Bedford, Mass. 25 23 2 - - - 3
New Haven, Conn. 65 43 14 3 3 2 3
Providence, R.I. 61 47 9 4 1 - -
Somerville, Mass. 7 5 2 - - - -
Springfield, Mass. 33 25 4 2 1 1 4
Waterbury, Conn. 31 25 6 - - - 2
Worcester, Mass. 66 50 11 3 2 - 9
MID. ATLANTIC 2,343 1,679 381 202 49 32 127
Albany, N.Y. 51 38 6 4 - 3 2
Allentown, Pa. 24 18 4 1 1 - 1
Buffalo, N.Y. U U U U U U U
Camden, N.J. 43 31 6 3 2 1 3
Elizabeth, N.J. 20 16 2 2 - - -
Erie, Pa.*** 45 37 7 1 - - 2
Jersey City, N.J. 44 30 6 5 1 2 1
New York City, N.Y. 1,335 940 225 126 28 16 56
Newark, N.J. 59 24 17 13 3 2 4
Paterson, N.J. 25 18 4 2 1 - 1
Philadelphia, Pa. 295 221 47 15 10 2 20
Pittsburgh, Pa.*** 56 37 8 8 1 2 6
Reading, Pa. 10 8 2 - - - 2
Rochester, N.Y. 122 94 15 9 1 3 6
Schenectady, N.Y. 28 22 5 1 - - 2
Scranton, Pa.*** 39 29 5 5 - - 1
Syracuse, N.Y. 92 73 15 2 1 1 13
Trenton, N.J. 45 34 6 5 - - 5
Utica, N.Y. 10 9 1 - - - 2
Yonkers, N.Y. U U U U U U U
E.N. CENTRAL 2,279 1,583 407 161 65 62 164
Akron, Ohio 48 38 5 3 - 2 -
Canton, Ohio 50 44 4 1 - 1 4
Chicago, Ill. 500 313 93 61 19 13 60
Cincinnati, Ohio 136 96 29 6 3 2 15
Cleveland, Ohio 167 116 27 7 2 15 4
Columbus, Ohio 217 143 44 15 7 8 20
Dayton, Ohio 165 128 27 2 6 2 8
Detroit, Mich. 208 126 49 24 6 3 5
Evansville, Ind. 33 27 6 - - - -
Fort Wayne, Ind. 47 35 5 3 3 1 4
Gary, Ind. 21 9 10 1 1 - -
Grand Rapids, Mich. 71 53 13 2 2 1 6
Indianapolis, Ind. 122 82 19 14 3 4 10
Lansing, Mich. 39 27 8 1 2 1 3
Milwaukee, Wis. 127 98 17 8 2 2 6
Peoria, Ill. 34 29 5 - - - 2
Rockford, Ill. 47 36 9 - - 2 1
South Bend, Ind. 54 36 12 4 2 - 5
Toledo, Ohio 108 79 17 4 3 5 8
Youngstown, Ohio 85 68 8 5 4 - 3
W.N. CENTRAL 771 576 96 46 21 17 45
Des Moines, Iowa 39 30 4 3 2 - 4
Duluth, Minn. U U U U U U U
Kansas City, Kans. 39 31 2 5 1 - 1
Kansas City, Mo. 133 88 15 9 4 2 7
Lincoln, Nebr. 34 25 5 1 1 2 2
Minneapolis, Minn. 195 165 19 9 - 2 13
Omaha, Nebr. 92 64 16 6 3 3 10
St. Louis, Mo. 109 80 16 6 5 2 -
St. Paul, Minn. 61 47 7 2 1 4 6
Wichita, Kans. 69 46 12 5 4 2 2
S. ATLANTIC 1,235 783 241 132 38 41 87
Atlanta, Ga. 170 99 41 22 7 1 8
Baltimore, Md. 274 167 48 39 6 14 22
Charlotte, N.C. 41 30 9 2 - - 2
Jacksonville, Fla. 142 92 27 20 1 2 5
Miami, Fla. 106 68 22 12 4 - 1
Norfolk, Va. 57 37 7 6 3 4 8
Richmond, Va. U U U U U U U
Savannah, Ga. 70 46 15 4 5 - 10
St. Petersburg, Fla. 41 32 4 2 2 1 2
Tampa, Fla. 192 140 40 5 6 1 24
Washington, D.C. 130 63 26 19 4 18 5
Wilmington, Del. 12 9 2 1 - - -
E.S. CENTRAL 682 466 136 43 21 16 71
Birmingham, Ala. 16 14 1 - 1 - 1
Chattanooga, Tenn. 70 48 10 6 5 1 5
Knoxville, Tenn. 89 56 24 5 2 2 15
Lexington, Ky. 73 49 14 6 1 3 7
Memphis, Tenn. 198 141 36 12 7 2 19
Mobile, Ala. 46 30 9 3 4 - 2
Montgomery, Ala. 42 30 8 2 - 2 4
Nashville, Tenn. 148 98 34 9 1 6 18
W.S. CENTRAL 1,729 1,174 318 152 40 43 134
Austin, Tex. 96 64 16 11 3 2 5
Baton Rouge, La. 32 20 7 2 - 3 3
Corpus Christi, Tex. 81 62 8 11 - - 12
Dallas, Tex. 224 147 42 26 3 6 9
El Paso, Tex. 86 62 13 5 2 4 6
Ft. Worth, Tex. 159 117 23 13 3 3 17
Houston, Tex. 441 283 97 44 9 8 32
Little Rock, Ark. 86 57 15 8 3 3 6
New Orleans, La. 80 47 18 7 8 - -
San Antonio, Tex. 249 172 49 14 7 7 22
Shreveport, La. 66 47 11 4 - 4 8
Tulsa, Okla. 129 96 19 7 2 3 14
MOUNTAIN 817 593 132 47 26 19 92
Albuquerque, N.M. 124 93 21 5 3 2 12
Boise, Idaho U U U U U U U
Colo. Springs, Colo. 52 36 9 5 - 2 4
Denver, Colo. 118 83 23 5 5 2 13
Las Vegas, Nev. U U U U U U U
Ogden, Utah 33 25 2 3 1 2 3
Phoenix, Ariz. 169 115 34 8 11 1 19
Pueblo, Colo. 23 16 5 - 2 - 4
Salt Lake City, Utah 110 79 15 8 4 4 10
Tucson, Ariz. 188 146 23 13 - 6 27
PACIFIC 1,773 1,296 288 115 42 32 166
Berkeley, Calif. 29 22 5 1 - 1 -
Fresno, Calif. 89 68 11 7 1 2 5
Glendale, Calif. 26 20 6 - - - 3
Honolulu, Hawaii 78 61 13 1 3 - 7
Long Beach, Calif. 66 48 11 4 2 1 9
Los Angeles, Calif. 528 377 82 42 16 11 31
Pasadena, Calif. 34 27 2 - 3 2 3
Portland, Oreg. 145 97 23 15 5 5 12
Sacramento, Calif. U U U U U U U
San Diego, Calif. 168 121 32 12 2 1 31
San Francisco, Calif. 140 111 24 1 2 2 19
San Jose, Calif. 189 130 39 13 4 3 25
Santa Cruz, Calif. U U U U U U U
Seattle, Wash. 123 90 20 8 2 3 3
Spokane, Wash. 72 60 6 4 1 1 11
Tacoma, Wash. 86 64 14 7 1 - 7
TOTAL 12,275**** 8,627 2,106 935 316 273 931
---------------------------------------------------------------------------------------------------------------
U: Unavailable -: no reported cases
* Mortality data in this table are voluntarily reported from 122 cities in the United States, most of which have populations
of 100,000 or more. A death is reported by the place of its occurrence and by the week that the death certificate was
filed. Fetal deaths are not included.
** Pneumonia and influenza.
*** Because of changes in reporting methods in these 3 Pennsylvania cities, these numbers are partial counts for the current
week. Complete counts will be available in 4 to 6 weeks.
**** Total includes unknown ages.
===================================================================================================================================
Return to top. Disclaimer All MMWR HTML versions of articles are electronic conversions from ASCII text into HTML. This conversion may have resulted in character translation or format errors in the HTML version. Users should not rely on this HTML document, but are referred to the electronic PDF version and/or the original MMWR paper copy for the official text, figures, and tables. An original paper copy of this issue can be obtained from the Superintendent of Documents, U.S. Government Printing Office (GPO), Washington, DC 20402-9371; telephone: (202) 512-1800. Contact GPO for current prices. **Questions or messages regarding errors in formatting should be addressed to mmwrq@cdc.gov.Page converted: 09/19/98 |
|||||||||
This page last reviewed 5/2/01
|