 |
|
|
|
|
|
|
| ||||||||||
|
|
|
|
|
|
|
||||
| ||||||||||
|
|
|
|
|
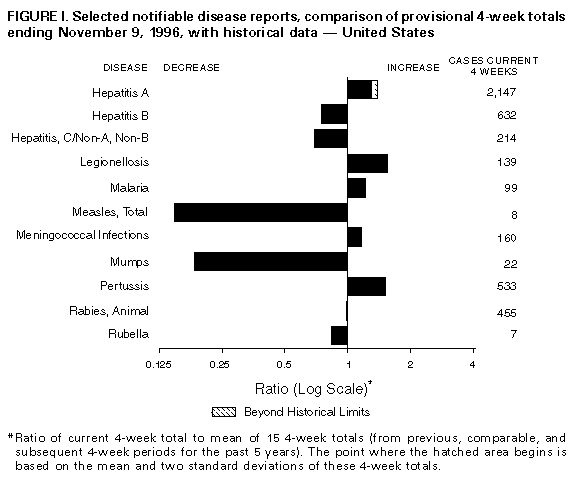
Persons using assistive technology might not be able to fully access information in this file. For assistance, please send e-mail to: mmwrq@cdc.gov. Type 508 Accommodation and the title of the report in the subject line of e-mail. Notifiable Diseases/Deaths in Selected Cities Weekly InformationFigure_I Selected notifiable disease reports, comparison of 4-week totals ending November 9, 1996, with historical data -- United States Table_I Summary -- provisional cases of selected notifiable diseases, United States, cumulative, week ending November 9, 1996 (45th Week) Table_II Provisional cases of selected notifiable diseases, United States, weeks ending November 9, 1996 and November 11, 1995 (45th Week) Table_III Provisional cases of selected notifiable diseases preventable by vaccination, United States, weeks ending November 9, 1996 and November 11, 1995 (45th Week) Table_IV Deaths in 121 U.S. cities, week ending
November 9, 1996 (45th Week)
TABLE I. Summary -- provisional cases of specified notifiable diseases, United
States, cumulative, week ending November 9, 1996 (45th Week)
==================================================================================
                                             Cum. 1996
------------------------------------------------------
Anthrax                                              -
Brucellosis                                         74
Cholera                                              4
Congenital rubella syndrome                          1
Cryptosporidiosis*                               1,953
Diphtheria                                           1
Encephalitis:  California*                         104
               eastern equine*                       2
               St. Louis*                            -
               western equine*                       -
Hansen Disease                                      94
Hantavirus pulmonary syndrome*+                     18
HIV infection, pediatric*&                         216
Plague                                               5
Poliomyelitis, paralytic@                            -
Psittacosis                                         39
Rabies, human                                        1
Rocky Mountain spotted fever (RMSF)                649
Streptococcal toxic-shock syndrome*                 12
Syphilis, congenital**                             225
Tetanus                                             22
Toxic-shock syndrome                               117
Trichinosis                                         17
Typhoid fever                                      306
------------------------------------------------------
 * Not notifiable in all states
 + Updated weekly from reports to the Division of Viral and Rickettsial
   Diseases, National Center for Infectious Diseases (NCID).
 & Updated monthly to the Division of HIV/AIDS Prevention, National Center
   for HIV, STD, and TB Prevention (NCHSTP), last update September 24, 1996.
 @ Three suspected cases of polio with onset in 1996 have been reported to date.
** Updated quarterly from reports to the Division of STD Prevention,
   NCHSTP.
-: no reported cases
==================================================================================
Return to top. Table_II Note: To print large tables and graphs users may have to change their printer settings to landscape and use a small font size.
TABLE II. (page 1) Provisional cases of selected notifiable diseases, United States, weeks ending
November 9, 1996, and November 11, 1995 (45th Week)
Escherichia
coli O157:H7
------------------- Hepatitis
AIDS* Chlamydia NETSS** PHLIS*** Gonorrhea C\NA,NB Legionellosis
----------------- --------- -------- -------- ------------------- ---------------- -----------------
Reporting Area Cum. Cum. Cum. Cum. Cum. Cum. Cum. Cum. Cum. Cum. Cum.
1996 1995 1996 1996 1996 1996 1995 1996 1995 1996 1995
------------------------------------------------------------------------------------------------------------------------------------------
UNITED STATES 51,611 60,074 326,941 2,405 1,322 259,316 338,967 2,860 3,472 850 1,008
NEW ENGLAND 2,065 2,943 14,496 324 78 6,091 6,680 104 110 61 30
Maine 32 82 821 22 - 53 78 - - 2 5
N.H. 66 77 397 38 38 80 98 8 12 3 2
Vt. 18 28 U 34 30 42 55 35 13 4 -
Mass. 997 1,336 6,104 146 10 1,925 2,364 55 78 25 19
R.I. 129 205 1,626 15 - 431 459 6 7 27 4
Conn. 823 1,215 5,548 69 - 3,560 3,626 - - N N
MID. ATLANTIC 14,243 16,428 36,854 208 43 29,649 37,453 268 420 200 176
Upstate N.Y. 1,855 1,973 N 140 16 5,635 8,189 211 216 67 50
N.Y. City 7,855 8,417 15,878 13 - 8,618 14,990 1 1 10 5
N.J. 2,905 3,977 5,753 55 5 4,488 3,468 - 165 13 27
Pa. 1,628 2,061 15,223 N 22 10,908 10,806 56 38 110 94
E.N. CENTRAL 4,076 4,504 70,593 545 359 49,626 68,223 388 296 247 302
Ohio 871 942 15,440 161 97 11,166 20,973 32 13 95 133
Ind. 498 467 8,863 82 48 5,751 7,843 8 12 41 72
Ill. 1,808 1,871 20,796 207 84 15,527 17,921 63 75 9 31
Mich. 685 919 17,705 95 70 13,379 15,760 285 196 81 30
Wis. 214 305 7,789 N 60 3,803 5,726 - - 21 36
W.N. CENTRAL 1,221 1,397 23,672 545 339 10,796 17,324 113 77 54 71
Minn. 226 303 2,702 248 220 U 2,638 4 4 8 6
Iowa 72 94 3,749 117 88 993 1,386 48 13 10 20
Mo. 626 642 10,354 63 - 7,111 9,810 35 18 17 14
N. Dak. 10 5 2 16 15 - 26 - 5 - 3
S. Dak. 10 17 878 22 - 122 193 - 1 2 3
Nebr. 83 93 2,084 49 4 786 970 7 22 12 17
Kans. 194 243 3,903 30 12 1,784 2,301 19 14 5 8
S. ATLANTIC 13,079 15,364 47,084 128 64 83,680 94,539 227 216 133 157
Del. 232 277 1,148 1 2 1,264 1,965 1 - 11 2
Md. 1,961 2,287 6,016 N 8 12,681 11,748 3 7 27 25
D.C. 1,001 896 N - - 3,794 4,145 - - 8 5
Va. 896 1,204 9,962 N 32 8,127 9,388 16 18 21 21
W. Va. 88 94 1 N 3 473 594 9 44 1 4
N.C. 677 898 - 43 12 16,433 20,971 45 51 12 31
S.C. 667 815 - 10 7 9,819 10,731 28 19 6 30
Ga. 1,867 1,999 9,798 30 - 15,396 17,308 U 15 3 14
Fla. 5,690 6,894 20,159 32 - 15,693 17,689 125 62 44 25
E.S. CENTRAL 1,749 1,919 27,334 66 59 30,340 35,153 491 866 41 52
Ky. 309 245 5,852 13 8 3,685 4,105 27 29 6 10
Tenn. 647 763 11,747 29 48 10,390 12,033 355 835 19 24
Ala. 470 520 7,280 13 3 11,725 14,390 5 2 3 6
Miss. 323 391 U 11 - 4,540 4,625 104 U 13 12
W.S. CENTRAL 5,138 5,173 33,101 71 13 25,537 47,283 406 300 19 21
Ark. 207 241 - 13 4 2,772 4,987 14 7 2 6
La. 1,177 902 6,479 6 4 7,149 9,429 187 165 2 3
Okla. 189 236 6,508 12 1 4,241 5,057 69 47 5 4
Tex. 3,565 3,794 20,114 40 4 11,375 27,810 136 81 10 8
MOUNTAIN 1,533 1,887 14,562 202 97 5,978 8,234 504 420 46 104
Mont. 33 20 - 25 - 32 61 18 14 1 4
Idaho 32 41 1,329 36 13 92 123 93 45 - 2
Wyo. 5 17 502 11 9 33 47 165 176 7 12
Colo. 406 572 - 73 40 1,077 2,490 56 61 8 38
N. Mex. 139 148 3,476 11 - 820 929 64 44 2 4
Ariz. 461 550 6,026 N 24 3,022 3,231 68 48 19 9
Utah 144 113 1,396 31 - 260 231 22 11 3 15
Nev. 313 426 1,833 15 11 642 1,122 18 21 6 20
PACIFIC 8,506 10,459 59,245 316 270 17,619 24,078 359 767 49 95
Wash. 538 780 7,969 109 123 1,770 2,405 50 192 6 20
Oreg. 359 399 4,649 86 59 552 700 7 35 1 -
Calif. 7,440 9,013 44,432 117 78 14,606 19,883 120 463 37 70
Alaska 28 62 1,059 4 2 378 593 3 2 1 -
Hawaii 141 205 1,136 N 8 313 497 179 75 4 5
Guam 4 - 168 N - 31 89 1 6 2 1
P.R. 1,792 2,159 N 17 U 342 521 84 196 - -
V.I. 17 30 N N U - - - - - -
Amer. Samoa - - - N U - 29 - - - -
C.N.M.I. 1 - N N U 11 51 - 5 - -
------------------------------------------------------------------------------------------------------------------------------------------
N: Not notifiable U: Unavailable -: no reported cases C.N.M.I.: Commonwealth of North Mariana Islands
* Updated monthly to the Division of HIV/AIDS Prevention, National Center for HIV, STD, and TB Prevention, last update September 24, 1996.
** National Electronic Telecommunications System for Surveillance.
*** Public Health Laboratory Information System.
=======================================================================================================================================================
TABLE II. (page 2) Provisional cases of selected notifiable diseases, United States, weeks ending
November 9, 1996, and November 11, 1995 (45th Week)
Meningococcal Syphilis
Lyme Malaria Disease (Primary & Secondary) Tuberculosis Rabies, Animal
---------------- ---------------- ---------------- --------------------- ----------------- ----------------
Reporting Area Cum. Cum. Cum. Cum. Cum. Cum. Cum. Cum. Cum. Cum. Cum. Cum.
1996 1995 1996 1995 1996 1995 1996 1995 1996 1995 1996 1995
-----------------------------------------------------------------------------------------------------------------------------------------------------
UNITED STATES 12,513 9,758 1,290 1,167 2,750 2,594 9,390 14,285 15,978 18,174 5,932 6,845
NEW ENGLAND 3,714 1,882 62 45 124 130 162 320 381 435 638 1,347
Maine 51 25 7 7 13 10 - 2 37 11 96 46
N.H. 43 22 2 2 7 22 1 1 14 17 51 134
Vt. 15 9 7 1 4 10 - - 1 2 126 164
Mass. 306 132 21 15 52 42 68 60 185 243 96 388
R.I. 464 297 7 4 13 6 3 4 27 43 35 295
Conn. 2,835 1,397 18 16 35 40 90 253 117 119 234 320
MID. ATLANTIC 7,610 6,382 356 327 253 315 409 718 2,777 3,685 1,290 1,757
Upstate N.Y. 3,895 3,252 74 61 78 88 66 76 367 445 954 1,051
N.Y. City 285 400 192 179 33 48 106 326 1,315 2,054 - -
N.J. 1,809 1,596 60 64 58 71 126 139 632 672 120 304
Pa. 1,621 1,134 30 23 84 108 111 177 463 514 216 402
E.N. CENTRAL 71 408 113 146 375 360 1,354 2,469 1,737 1,699 88 96
Ohio 44 25 13 11 139 102 493 803 258 243 12 12
Ind. 24 16 13 17 54 51 174 305 155 159 8 14
Ill. 3 17 35 71 102 93 370 924 904 887 23 15
Mich. - 5 38 26 40 67 166 257 324 330 31 39
Wis. U 345 14 21 40 47 151 180 96 80 14 16
W.N. CENTRAL 184 195 47 24 220 162 315 662 414 501 465 335
Minn. 97 109 21 4 25 26 51 41 92 124 27 27
Iowa 19 13 3 3 46 29 17 43 55 54 215 115
Mo. 27 46 10 8 92 61 204 540 173 194 18 30
N. Dak. 1 - 1 1 4 1 - - 6 4 63 27
S. Dak. - - - 2 10 6 - - 17 22 105 89
Nebr. 5 6 3 3 20 16 11 12 21 20 5 5
Kans. 35 21 9 3 23 23 32 26 50 83 32 42
S. ATLANTIC 647 607 268 233 550 445 3,283 3,592 2,995 3,231 2,446 1,947
Del. 105 45 3 1 2 6 35 15 30 49 68 82
Md. 377 388 75 62 65 36 569 437 262 342 559 388
D.C. 3 3 7 16 10 7 121 97 120 91 10 11
Va. 47 50 47 53 54 59 351 530 234 255 537 395
W. Va. 11 22 5 4 14 8 3 10 50 61 92 108
N.C. 63 65 27 15 68 71 958 996 435 376 619 425
S.C. 6 16 12 1 55 55 351 505 291 279 82 116
Ga. 1 13 26 36 125 97 565 675 547 612 254 255
Fla. 34 5 66 45 157 106 330 327 1,026 1,166 225 167
E.S. CENTRAL 71 66 34 24 205 183 2,117 2,903 1,096 1,251 194 261
Ky. 25 13 7 3 27 42 135 161 203 281 39 26
Tenn. 20 28 14 10 56 72 729 781 334 384 77 91
Ala. 7 9 6 8 74 37 481 562 362 348 75 135
Miss. 19 16 7 3 48 32 772 1,399 197 238 3 9
W.S. CENTRAL 109 104 38 48 301 309 1,217 2,888 1,996 2,653 370 557
Ark. 24 8 - 2 33 31 131 456 168 208 28 46
La. 5 7 6 5 55 48 450 899 175 297 15 42
Okla. 22 45 - 1 35 38 159 164 149 326 29 28
Tex. 58 44 32 40 178 192 477 1,369 1,504 1,822 298 441
MOUNTAIN 7 12 54 56 157 183 120 187 537 578 135 169
Mont. - - 7 3 6 3 - 4 14 10 20 43
Idaho 1 - - 1 22 10 4 - 7 14 - 3
Wyo. 2 3 7 - 3 8 2 1 6 4 27 26
Colo. - - 22 25 36 45 23 98 74 68 41 9
N. Mex. 1 1 2 6 25 33 1 6 72 70 6 6
Ariz. - 1 7 10 38 53 75 43 209 280 30 55
Utah 1 1 5 6 15 15 2 4 51 38 4 15
Nev. 2 6 4 5 12 16 13 31 104 94 7 12
PACIFIC 100 102 318 264 565 507 413 546 4,045 4,141 306 376
Wash. 16 10 20 21 91 80 6 13 206 234 6 15
Oreg. 19 17 19 18 106 92 11 21 137 118 3 3
Calif. 64 75 268 212 355 319 395 510 3,483 3,560 289 351
Alaska - - 3 3 8 12 - 2 59 68 8 7
Hawaii 1 - 8 10 5 4 1 - 160 161 - -
Guam - - - 1 1 2 3 8 35 97 - -
P.R. - - - 1 4 23 114 259 63 162 40 37
V.I. - - - 2 - - - - - - - -
Amer. Samoa - - - - - - - - - 4 - -
C.N.M.I. - - - 1 - - 1 9 - 36 - -
-----------------------------------------------------------------------------------------------------------------------------------------------------
N: Not notifiable U: Unavailable -: no reported cases
=======================================================================================================================================================
Return to top. Table_III Note: To print large tables and graphs users may have to change their printer settings to landscape and use a small font size.
TABLE III. (page 1) Provisional cases of selected notifiable diseases preventable by vaccination, United
States, weeks ending November 9, 1996, and November 11, 1995 (45th Week)
Hepatitis (Viral), by type Measles (Rubeola)
H. influenzae, --------------------------------------- -------------------------------------
invasive A B Indigenous Imported**
---------------- ----------------- ----------------- --------------- ---------------
Reporting Area Cum. Cum. Cum. Cum. Cum. Cum. Cum. Cum.
1996* 1995 1996 1995 1996 1995 1996 1996 1996 1996
------------------------------------------------------------------------------------------------------------------------------
UNITED STATES 843 978 24,465 25,934 8,463 8,573 - 414 - 46
NEW ENGLAND 27 38 356 277 174 201 - 11 - 4
Maine - 3 21 27 2 12 - - - -
N.H. 9 10 22 11 17 20 U - U -
Vt. 1 2 10 5 11 5 - 1 - 1
Mass. 15 12 171 121 59 78 - 9 - 3
R.I. 2 5 20 32 9 8 - - - -
Conn. - 6 112 81 76 78 - 1 - -
MID. ATLANTIC 127 147 1,642 1,659 1,276 1,213 - 23 - 5
Upstate N.Y. 15 37 392 424 296 331 - - - -
N.Y. City 33 34 514 788 515 365 - 9 - 3
N.J. 51 24 311 248 227 326 - 3 - -
Pa. 28 52 425 199 238 191 - 11 - 2
E.N. CENTRAL 144 165 2,076 2,827 861 972 - 6 - 7
Ohio 82 84 678 1,574 112 94 - 2 - 3
Ind. 15 20 315 164 133 199 - - - -
Ill. 32 42 515 583 226 254 - 2 - 1
Mich. 8 17 412 332 327 355 - - - 3
Wis. 7 2 156 174 63 70 - 2 - -
W.N. CENTRAL 41 76 2,256 1,693 448 557 - 20 - 2
Minn. 25 42 115 166 57 54 - 16 - 2
Iowa 6 3 321 73 72 42 - - - -
Mo. 7 24 1,122 1,176 241 378 - 3 - -
N. Dak. - - 117 22 2 4 - - - -
S. Dak. 1 1 42 67 5 2 - - - -
Nebr. 1 3 194 49 42 31 - - - -
Kans. 1 3 345 140 29 46 - 1 - -
S. ATLANTIC 168 190 1,254 1,011 1,299 1,131 - 5 - 9
Del. 2 - 18 9 7 8 - 1 - -
Md. 54 61 218 193 265 224 - - - 2
D.C. 6 - 35 24 30 21 - 1 - -
Va. 9 28 163 185 128 98 - - - 3
W. Va. 10 7 14 23 28 48 - - - -
N.C. 24 26 157 94 277 259 - 3 - 1
S.C. 4 2 47 42 84 49 - - - -
Ga. 37 60 150 53 32 62 U - U 2
Fla. 22 6 452 388 448 362 - - - 1
E.S. CENTRAL 26 10 1,123 1,734 733 738 - 2 - -
Ky. 4 4 41 41 54 61 - - - -
Tenn. 12 - 726 1,436 432 579 - 2 - -
Ala. 9 5 173 78 62 98 - - - -
Miss. 1 1 183 179 185 U U - U -
W.S. CENTRAL 37 57 5,122 3,881 1,137 1,209 - 26 - 2
Ark. - 6 450 517 72 58 - - - -
La. 4 1 167 128 134 203 - - - -
Okla. 29 21 2,139 1,065 59 149 - - - -
Tex. 4 29 2,366 2,171 872 799 - 26 - 2
MOUNTAIN 88 106 3,903 3,667 1,010 740 - 153 - 5
Mont. - - 106 142 14 20 - - - -
Idaho 1 4 215 288 83 87 - 1 - -
Wyo. 35 7 33 100 43 26 - 1 - -
Colo. 14 16 413 459 120 115 - 4 - 3
N. Mex. 10 13 325 720 371 272 - 17 - -
Ariz. 12 26 1,547 1,065 222 105 - 8 - -
Utah 8 11 910 632 82 62 - 117 - 2
Nev. 8 29 354 261 75 53 - 5 - -
PACIFIC 185 189 6,733 9,185 1,525 1,812 - 168 - 12
Wash. 4 9 581 763 91 171 - 51 - -
Oreg. 26 25 754 2,425 84 107 - 10 - -
Calif. 151 150 5,294 5,801 1,322 1,509 - 37 - 5
Alaska 2 1 39 43 16 11 - 63 - -
Hawaii 2 4 65 153 12 14 U 7 U 7
Guam - - 2 7 - 4 U - U -
P.R. 1 3 116 92 369 560 - 7 - -
V.I. - - - 8 - 15 U - U -
Amer. Samoa - - - 6 - - U - U -
C.N.M.I. 10 11 1 24 5 22 U - U -
------------------------------------------------------------------------------------------------------------------------------
N: Not notifiable U: Unavailable -: no reported cases
* Of 201 cases reported among children aged <5 years, serotype was reported for 47 and of those, 16 were type b.
** For imported measles, cases include only those resulting from importation from other countries.
============================================================================================================================================
TABLE III. (page 2) Provisional cases of selected notifiable diseases preventable by vaccination, United
States, weeks ending November 9, 1996, and November 11, 1995 (45th Week)
Measles (Rubeola), cont'd.
--------------------------
Total Mumps Pertussis Rubella
-------------------------- -------------------------- --------------------------- ---------------------------
Reporting Area Cum. Cum. Cum. Cum. Cum. Cum. Cum. Cum.
1996 1995 1996 1996 1995 1996 1996 1995 1996 1996 1995
------------------------------------------------------------------------------------------------------------------------------------------
UNITED STATES 460 291 4 547 744 69 4,751 3,902 1 201 113
NEW ENGLAND 15 10 - 2 11 8 1,019 571 - 27 47
Maine - - - - 4 - 20 42 - - -
N.H. - - U - 1 U 117 45 U - 1
Vt. 2 - - - - 8 131 67 - 2 -
Mass. 12 3 - 2 2 - 692 387 - 21 8
R.I. - 5 - - 1 - 30 4 - - -
Conn. 1 2 - - 3 - 29 26 - 4 38
MID. ATLANTIC 28 12 1 78 110 11 420 361 1 12 14
Upstate N.Y. - 1 1 25 25 11 248 190 1 5 4
N.Y. City 12 5 - 17 16 - 38 49 - 4 8
N.J. 3 6 - 2 17 - 16 18 - 2 2
Pa. 13 - - 34 52 - 118 104 - 1 -
E.N. CENTRAL 13 15 2 93 149 19 533 490 - 3 3
Ohio 5 2 1 41 47 4 242 140 - - -
Ind. - - - 9 9 10 93 55 - - -
Ill. 3 2 - 20 45 1 149 104 - 1 -
Mich. 3 5 1 22 48 4 44 64 - 2 3
Wis. 2 6 - 1 - - 5 127 - - -
W.N. CENTRAL 22 2 - 18 43 11 360 246 - - 1
Minn. 18 - - 6 6 9 288 125 - - -
Iowa - - - 2 10 2 20 11 - - -
Mo. 3 1 - 7 22 - 34 60 - - -
N. Dak. - - - 2 1 - 1 8 - - -
S. Dak. - - - - - - 4 11 - - -
Nebr. - - - - 4 - 9 10 - - -
Kans. 1 1 - 1 - - 4 21 - - 1
S. ATLANTIC 14 19 1 91 109 6 538 316 - 93 10
Del. 1 - - - - - 15 10 - - -
Md. 2 1 1 26 32 2 200 41 - - 1
D.C. 1 - - 1 - 2 4 6 - 2 -
Va. 3 - - 12 21 - 71 19 - 2 -
W. Va. - - - - - - 2 - - - -
N.C. 4 - - 20 16 - 100 110 - 78 1
S.C. - - - 6 11 1 41 26 - 1 -
Ga. 2 4 U 3 8 U 17 24 U - -
Fla. 1 14 - 23 21 1 88 80 - 10 8
E.S. CENTRAL 2 - - 21 11 - 136 268 - 2 1
Ky. - - - - - - 84 25 - - -
Tenn. 2 - - 3 4 - 20 206 - - 1
Ala. - - - 3 4 - 23 35 - 2 -
Miss. - - U 15 3 U 9 2 N N N
W.S. CENTRAL 28 33 - 32 49 - 115 278 - 3 7
Ark. - 2 - 2 7 - 12 36 - - -
La. - 18 - 13 12 - 9 19 - 1 -
Okla. - - - 1 - - 17 31 - - -
Tex. 28 13 - 16 30 - 77 192 - 2 7
MOUNTAIN 158 70 - 21 30 5 388 559 - 6 4
Mont. - - - - 1 - 33 3 - - -
Idaho 1 2 - - 3 1 103 99 - 2 -
Wyo. 1 - - - - - 6 1 - - -
Colo. 7 26 - 3 2 - 98 90 - 2 -
N. Mex. 17 31 N N N 1 61 123 - - -
Ariz. 8 10 - 1 2 - 27 153 - 1 3
Utah 119 - - 2 11 3 22 27 - - 1
Nev. 5 1 - 15 11 - 38 63 - 1 -
PACIFIC 180 130 - 191 232 9 1,242 813 - 55 26
Wash. 51 19 - 19 12 9 552 297 - 2 1
Oreg. 10 1 - - - - 34 55 - 1 -
Calif. 42 108 - 142 198 - 624 412 - 49 20
Alaska 63 - - 3 12 - 4 1 - - -
Hawaii 14 2 U 27 10 U 28 48 U 3 5
Guam - - U 5 4 U 1 2 U - 1
P.R. 7 3 - 1 2 - 1 1 - - -
V.I. - - U - 3 U - - U - -
Amer. Samoa - - U - - U - - U - -
C.N.M.I. - - U - 1 U - - U - -
------------------------------------------------------------------------------------------------------------------------------------------
N: Not notifiable U: Unavailable -: no reported cases
============================================================================================================================================
Return to top. Table_IV Note: To print large tables and graphs users may have to change their printer settings to landscape and use a small font size.
TABLE IV. Deaths in 121 U.S. cities* week ending
November 9, 1996 (45th Week)
===================================================================================================================================
All Causes, By Age (Years)
------------------------------------------------------------------------ P&I**
Reporting Area All Ages >=65 45-64 25-44 1-24 <1 Total
---------------------------------------------------------------------------------------------------------------
NEW ENGLAND 598 445 93 46 10 4 26
Boston, Mass. 146 97 34 12 2 1 3
Bridgeport, Conn. 40 30 7 2 1 - 2
Cambridge, Mass. 16 13 1 2 - - 1
Fall River, Mass. 21 18 2 - 1 - -
Hartford, Conn. 56 37 10 6 2 1 -
Lowell, Mass. 26 23 1 2 - - 3
Lynn, Mass. 18 14 4 - - - 1
New Bedford, Mass. 23 19 1 2 - 1 -
New Haven, Conn. 40 29 8 3 - - -
Providence, R.I. 52 42 7 3 - - 2
Somerville, Mass. 8 6 1 1 - - -
Springfield, Mass. 50 34 9 5 1 1 3
Waterbury, Conn. 30 25 3 1 1 - 2
Worcester, Mass. 72 58 5 7 2 - 9
MID. ATLANTIC 2,192 1,451 420 232 42 47 100
Albany, N.Y. 32 22 4 3 2 1 1
Allentown, Pa. 18 12 6 - - - 1
Buffalo, N.Y. 99 71 22 3 3 - 7
Camden, N.J. 36 16 6 9 2 3 2
Elizabeth, N.J. 16 11 2 2 - 1 2
Erie, Pa.*** 49 38 10 1 - - 1
Jersey City, N.J. 35 14 6 13 - 2 1
New York City, N.Y. 1,202 778 236 138 26 24 36
Newark, N.J. U U U U U U U
Paterson, N.J. 32 20 6 5 1 - 1
Philadelphia, Pa. 299 184 62 41 4 8 15
Pittsburgh, Pa.*** 48 35 7 4 1 1 4
Reading, Pa. 7 7 - - - - 3
Rochester, N.Y. 131 102 21 4 1 3 14
Schenectady, N.Y. 30 24 4 2 - - 1
Scranton, Pa.*** 37 28 7 1 - 1 2
Syracuse, N.Y. 69 54 11 2 2 - 4
Trenton, N.J. 33 21 5 4 - 3 5
Utica, N.Y. 19 14 5 - - - -
Yonkers, N.Y. U U U U U U U
E.N. CENTRAL 2,222 1,527 400 180 62 50 125
Akron, Ohio 38 28 7 3 - - -
Canton, Ohio 34 28 5 1 - - 2
Chicago, Ill. 446 268 83 62 18 13 20
Cincinnati, Ohio 174 125 28 11 4 6 18
Cleveland, Ohio 139 93 26 11 4 4 3
Columbus, Ohio 201 149 27 13 6 6 13
Dayton, Ohio 136 94 29 7 5 1 14
Detroit, Mich. 183 99 46 29 5 4 5
Evansville, Ind. 41 33 6 2 - - 1
Fort Wayne, Ind. 62 47 11 2 2 - 4
Gary, Ind. 14 9 4 1 - - -
Grand Rapids, Mich. 65 46 8 6 4 1 5
Indianapolis, Ind. 186 126 37 12 4 7 10
Madison, Wis. 47 32 7 5 2 1 4
Milwaukee, Wis. 111 91 14 4 1 1 8
Peoria, Ill. 47 38 8 1 - - 4
Rockford, Ill. 67 49 11 2 2 3 4
South Bend, Ind. 57 39 13 3 2 - 3
Toledo, Ohio 101 77 17 4 1 2 6
Youngstown, Ohio 73 56 13 1 2 1 1
W.N. CENTRAL 791 562 130 50 19 18 48
Des Moines, Iowa 79 60 14 3 2 - 4
Duluth, Minn. 40 25 12 3 - - 1
Kansas City, Kans. 28 15 8 5 - - -
Kansas City, Mo. 107 67 17 7 1 3 8
Lincoln, Nebr. 29 25 2 1 1 - 1
Minneapolis, Minn. 175 133 17 13 5 7 7
Omaha, Nebr. 93 61 20 6 5 1 6
St. Louis, Mo. 114 87 13 6 3 5 12
St. Paul, Minn. 65 49 13 2 - 1 8
Wichita, Kans. 61 40 14 4 2 1 1
S. ATLANTIC 1,210 749 262 119 53 26 53
Atlanta, Ga. 131 72 37 12 7 3 4
Baltimore, Md. 163 101 28 25 6 2 10
Charlotte, N.C. 51 36 8 3 2 2 1
Jacksonville, Fla. 141 90 31 13 4 3 14
Miami, Fla. 152 90 35 20 5 2 1
Norfolk, Va. 71 39 12 8 8 4 3
Richmond, Va. 80 54 17 5 3 1 1
Savannah, Ga. 59 40 15 4 - - 3
St. Petersburg, Fla. 43 28 8 2 4 1 -
Tampa, Fla. 167 118 31 8 6 4 12
Washington, D.C. 140 72 37 19 8 4 4
Wilmington, Del. 12 9 3 - - - -
E.S. CENTRAL 801 549 156 62 14 17 47
Birmingham, Ala. 118 74 25 7 5 4 3
Chattanooga, Tenn. 72 56 10 4 - 2 3
Knoxville, Tenn. 79 48 16 9 4 2 8
Lexington, Ky. 64 42 19 2 - 1 6
Memphis, Tenn. 186 122 37 23 3 1 12
Mobile, Ala. 95 74 10 9 - 2 1
Montgomery, Ala. 46 35 7 3 - 1 -
Nashville, Tenn. 141 98 32 5 2 4 14
W.S. CENTRAL 1,576 999 323 159 48 44 83
Austin, Tex. 71 48 13 9 - 1 3
Baton Rouge, La. 43 27 8 4 2 2 -
Corpus Christi, Tex. 49 36 6 2 3 2 4
Dallas, Tex. 182 110 36 20 12 4 2
El Paso, Tex. 69 42 15 8 4 - 1
Ft. Worth, Tex. 139 84 38 8 2 7 3
Houston, Tex. 450 288 98 48 9 7 41
Little Rock, Ark. 76 47 18 7 4 - 4
New Orleans, La. 154 83 25 27 5 11 -
San Antonio, Tex. 203 135 41 18 4 5 18
Shreveport, La. 43 31 6 4 - 2 2
Tulsa, Okla. 97 68 19 4 3 3 5
MOUNTAIN 943 625 182 85 30 21 74
Albuquerque, N.M. 91 66 14 8 3 - 5
Colo. Springs, Colo. 50 30 14 5 - 1 5
Denver, Colo. 125 91 22 10 1 1 8
Las Vegas, Nev. 213 142 42 19 6 4 21
Ogden, Utah 22 16 2 3 1 - -
Phoenix, Ariz. 167 107 33 14 6 7 14
Pueblo, Colo. 22 19 3 - - - 3
Salt Lake City, Utah 110 60 27 12 6 5 9
Tucson, Ariz. 143 94 25 14 7 3 9
PACIFIC 1,480 1,048 258 127 28 18 84
Berkeley, Calif. 13 12 1 - - - 1
Fresno, Calif. 123 82 31 4 3 3 9
Glendale, Calif. 29 21 3 4 1 - 1
Honolulu, Hawaii 66 51 12 1 1 - 6
Long Beach, Calif. 89 68 16 2 1 2 9
Los Angeles, Calif. 587 406 101 65 10 5 27
Pasadena, Calif. U U U U U U U
Portland, Oreg. 112 89 13 6 2 2 6
Sacramento, Calif. U U U U U U U
San Diego, Calif. 125 79 25 14 6 1 9
San Francisco, Calif. U U U U U U U
San Jose, Calif. U U U U U U U
Santa Cruz, Calif. 42 30 6 6 - - 7
Seattle, Wash. 163 119 26 12 2 4 5
Spokane, Wash. 55 34 12 6 2 1 2
Tacoma, Wash. 76 57 12 7 - - 2
TOTAL 11,813**** 7,955 2,224 1,060 306 245 640
---------------------------------------------------------------------------------------------------------------
U: Unavailable -: no reported cases
* Mortality data in this table are voluntarily reported from 121 cities in the United States, most of which have populations
of 100,000 or more. A death is reported by the place of its occurrence and by the week that the death certificate was
filed. Fetal deaths are not included.
** Pneumonia and influenza.
*** Because of changes in reporting methods in these 3 Pennsylvania cities, these numbers are partial counts for the current
week. Complete counts will be available in 4 to 6 weeks.
**** Total includes unknown ages.
===================================================================================================================================
Return to top. Disclaimer All MMWR HTML versions of articles are electronic conversions from ASCII text into HTML. This conversion may have resulted in character translation or format errors in the HTML version. Users should not rely on this HTML document, but are referred to the electronic PDF version and/or the original MMWR paper copy for the official text, figures, and tables. An original paper copy of this issue can be obtained from the Superintendent of Documents, U.S. Government Printing Office (GPO), Washington, DC 20402-9371; telephone: (202) 512-1800. Contact GPO for current prices. **Questions or messages regarding errors in formatting should be addressed to mmwrq@cdc.gov.Page converted: 09/19/98 |
|||||||||
This page last reviewed 5/2/01
|