 |
|
|
|
|
|
|
| ||||||||||
|
|
|
|
|
|
|
||||
| ||||||||||
|
|
|
|
|
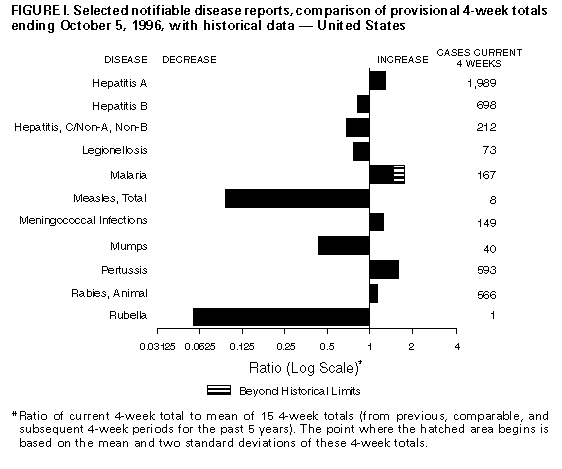
Persons using assistive technology might not be able to fully access information in this file. For assistance, please send e-mail to: mmwrq@cdc.gov. Type 508 Accommodation and the title of the report in the subject line of e-mail. Notifiable Diseases/Deaths in Selected Cities Weekly InformationFigure_I Selected notifiable disease reports, comparison of 4-week totals ending October 5, 1996, with historical data -- United States Table_I Summary -- provisional cases of selected notifiable diseases, United States, cumulative, week ending October 5, 1996 (40th Week) Table_II Provisional cases of selected notifiable diseases, United States, weeks ending October 5, 1996 and October 7, 1995 (40th Week) Table_III Provisional cases of selected notifiable diseases preventable by vaccination, United States, weeks ending October 5, 1996 and October 7, 1995 (40th Week) Table_IV Deaths in 121 U.S. cities, week ending
October 5, 1996 (40th Week)
TABLE I. Summary -- provisional cases of specified notifiable diseases, United
States, cumulative, week ending October 5, 1996 (40th Week)
==================================================================================
                                             Cum. 1996
------------------------------------------------------
Anthrax                                              -
Brucellosis                                         61
Cholera                                              3
Congenital rubella syndrome                          1
Cryptosporidiosis*                               1,680
Diphtheria                                           1
Encephalitis:  California*                          69
               eastern equine*                       1
               St. Louis*                            -
               western equine*                       -
Hansen Disease                                      78
Hantavirus pulmonary syndrome*+                     14
HIV infection, pediatric*&                         216
Plague                                               2
Poliomyelitis, paralytic@                            -
Psittacosis                                         32
Rabies, human                                        1
Rocky Mountain spotted fever (RMSF)                549
Streptococcal toxic-shock syndrome*                 14
Syphilis, congenital**                             225
Tetanus                                             22
Toxic-shock syndrome                               104
Trichinosis                                         14
Typhoid fever                                      274
------------------------------------------------------
 * Not notifiable in all states
 + Updated weekly from reports to the Division of Viral and Rickettsial
   Diseases, National Center for Infectious Diseases (NCID).
 & Updated monthly to the Division of HIV/AIDS Prevention, National Center
   for HIV, STD, and TB Prevention (NCHSTP), last update September 24, 1996.
 @ Three suspected cases of polio with onset in 1996 have been reported to date.
** Updated quarterly from reports to the Division of STD Prevention,
   NCHSTP.
-: no reported cases
==================================================================================
Return to top. Table_II Note: To print large tables and graphs users may have to change their printer settings to landscape and use a small font size.
TABLE II. (page 1) Provisional cases of selected notifiable diseases, United States, weeks ending
October 5, 1996, and October 7, 1995 (40th Week)
Escherichia
coli O157:H7
------------------- Hepatitis
AIDS* Chlamydia NETSS** PHLIS*** Gonorrhea C\NA,NB Legionellosis
----------------- --------- -------- -------- ------------------- ---------------- -----------------
Reporting Area Cum. Cum. Cum. Cum. Cum. Cum. Cum. Cum. Cum. Cum. Cum.
1996 1995 1996 1996 1996 1996 1995 1996 1995 1996 1995
------------------------------------------------------------------------------------------------------------------------------------------
UNITED STATES 51,611 54,405 279,125 2,024 1,116 217,085 302,844 2,577 3,021 665 920
NEW ENGLAND 2,065 2,626 12,712 277 67 5,381 5,865 93 101 37 27
Maine 32 82 695 21 - 47 72 - - 2 5
N.H. 66 75 397 35 31 80 91 8 12 3 1
Vt. 18 28 U 26 26 42 47 31 10 3 -
Mass. 997 1,122 5,168 130 10 1,724 2,066 48 72 20 17
R.I. 129 187 1,482 15 - 395 406 6 7 9 4
Conn. 823 1,132 4,970 50 - 3,093 3,183 - - N N
MID. ATLANTIC 14,243 14,635 33,736 180 39 25,549 34,051 223 356 168 159
Upstate N.Y. 1,855 1,729 N 122 12 4,920 7,383 173 177 57 41
N.Y. City 7,855 7,609 15,878 10 - 8,618 13,607 1 1 6 5
N.J. 2,905 3,553 3,902 48 5 3,929 3,325 - 142 12 23
Pa. 1,628 1,744 13,956 N 22 8,082 9,736 49 36 93 90
E.N. CENTRAL 4,076 4,092 47,633 492 326 32,233 60,652 355 255 176 270
Ohio 871 847 14,112 138 82 10,153 18,831 29 9 80 125
Ind. 498 423 7,933 72 47 5,160 6,915 8 4 38 64
Ill. 1,808 1,726 18,905 199 84 13,712 15,718 52 71 9 25
Mich. 685 817 U 83 65 U 14,033 266 171 34 26
Wis. 214 279 6,683 N 48 3,208 5,155 - - 15 30
W.N. CENTRAL 1,221 1,245 21,363 461 287 9,570 15,555 101 65 36 66
Minn. 226 284 2,702 200 202 U 2,176 1 2 3 6
Iowa 72 71 3,199 104 55 861 1,253 48 12 9 19
Mo. 626 559 9,400 51 - 6,339 8,878 32 18 8 13
N. Dak. 10 4 2 14 14 - 24 - 5 - 3
S. Dak. 10 14 731 20 - 103 169 - 1 2 3
Nebr. 83 84 1,920 43 4 718 931 5 15 11 15
Kans. 194 229 3,409 29 12 1,549 2,124 15 12 3 7
S. ATLANTIC 13,079 14,075 42,154 111 59 73,820 84,266 213 181 110 146
Del. 232 239 1,148 1 1 1,129 1,723 1 - 10 2
Md. 1,961 2,226 5,273 N 8 11,207 10,212 1 7 22 24
D.C. 1,001 828 N - - 3,386 3,594 - - 8 4
Va. 896 1,077 8,765 N 29 6,960 8,371 12 14 15 20
W. Va. 88 84 1 N 2 404 533 9 43 1 4
N.C. 677 816 U 34 12 14,187 18,785 40 46 9 31
S.C. 667 766 - 8 7 8,275 9,333 23 16 5 30
Ga. 1,867 1,791 8,873 30 - 14,199 15,776 U 15 3 14
Fla. 5,690 6,248 18,094 26 - 14,073 15,939 127 40 37 17
E.S. CENTRAL 1,749 1,759 23,140 53 50 24,849 31,251 453 803 38 50
Ky. 309 220 5,117 10 6 3,226 3,702 27 27 4 10
Tenn. 647 709 9,945 22 41 8,899 10,651 331 774 18 24
Ala. 470 483 6,482 10 3 10,337 12,852 4 2 3 6
Miss. 323 347 U 11 - 2,387 4,046 91 U 13 10
W.S. CENTRAL 5,138 4,660 31,586 42 12 23,910 42,558 356 236 18 19
Ark. 207 209 - 12 3 2,620 4,216 7 6 2 6
La. 1,177 780 5,685 6 4 6,170 8,662 161 142 1 3
Okla. 189 206 5,787 10 1 3,745 4,472 69 36 5 4
Tex. 3,565 3,465 20,114 14 4 11,375 25,208 119 52 10 6
MOUNTAIN 1,533 1,710 12,586 169 87 5,391 7,271 452 362 36 93
Mont. 33 17 - 23 - 25 55 14 12 1 4
Idaho 32 38 1,185 30 10 86 112 93 44 - 2
Wyo. 5 12 448 10 9 30 43 142 142 3 10
Colo. 406 523 - 62 35 1,077 2,231 46 55 7 33
N. Mex. 139 137 3,017 10 - 685 818 61 42 2 4
Ariz. 461 540 5,132 N 22 2,713 2,806 56 37 16 9
Utah 144 112 1,183 19 - 232 194 22 11 2 13
Nev. 313 331 1,621 15 11 543 1,012 18 19 5 18
PACIFIC 8,506 9,603 54,215 239 189 16,382 21,375 331 662 46 90
Wash. 538 711 7,110 73 72 1,571 2,113 44 161 5 20
Oreg. 359 347 U 63 37 467 607 6 34 1 -
Calif. 7,440 8,295 41,132 100 70 13,749 17,659 111 425 35 65
Alaska 28 60 897 3 2 321 531 3 1 1 -
Hawaii 141 190 1,031 N 8 274 465 167 41 4 5
Guam 4 - 168 N - 31 87 1 5 2 1
P.R. 1,792 1,904 N 14 U 287 459 79 179 - -
V.I. 17 27 N N U - - - - - -
Amer. Samoa - - - N U - 25 - - - -
C.N.M.I. 1 - N N U 11 50 - 5 - -
------------------------------------------------------------------------------------------------------------------------------------------
N: Not notifiable U: Unavailable -: no reported cases C.N.M.I.: Commonwealth of North Mariana Islands
* Updated monthly to the Division of HIV/AIDS Prevention, National Center for HIV, STD, and TB Prevention, last update September 24, 1996.
** National Electronic Telecommunications System for Surveillance.
*** Public Health Laboratory Information System.
=======================================================================================================================================================
TABLE II. (page 2) Provisional cases of selected notifiable diseases, United States, weeks ending
October 5, 1996, and October 7, 1995 (40th Week)
Meningococcal Syphilis
Lyme Malaria Disease (Primary & Secondary) Tuberculosis Rabies, Animal
---------------- ---------------- ---------------- --------------------- ----------------- ----------------
Reporting Area Cum. Cum. Cum. Cum. Cum. Cum. Cum. Cum. Cum. Cum. Cum. Cum.
1996 1995 1996 1995 1996 1995 1996 1995 1996 1995 1996 1995
-----------------------------------------------------------------------------------------------------------------------------------------------------
UNITED STATES 10,210 8,667 1,132 985 2,474 2,339 8,353 12,760 14,293 15,919 4,446 6,080
NEW ENGLAND 3,340 1,702 41 38 105 109 132 281 338 386 573 1,227
Maine 35 24 7 5 12 8 - 2 21 11 81 46
N.H. 35 20 2 1 3 19 1 1 11 15 49 123
Vt. 15 8 3 1 3 9 - - 1 2 121 144
Mass. 264 112 13 12 41 37 63 48 169 215 92 365
R.I. 427 285 6 4 11 5 1 3 27 38 33 269
Conn. 2,564 1,253 10 15 35 31 67 227 109 105 197 280
MID. ATLANTIC 5,920 5,638 307 275 223 298 335 651 2,571 3,351 336 1,545
Upstate N.Y. 3,182 2,815 67 52 67 80 55 72 322 398 46 911
N.Y. City 229 368 161 151 31 44 106 281 1,284 1,890 - -
N.J. 911 1,501 54 54 54 70 77 129 566 588 107 278
Pa. 1,598 954 25 18 71 104 97 169 399 475 183 356
E.N. CENTRAL 67 375 106 129 340 330 1,086 2,186 1,576 1,503 83 87
Ohio 41 23 13 11 127 93 463 697 227 205 10 10
Ind. 23 16 13 15 54 48 164 248 140 136 7 14
Ill. 3 16 35 67 89 88 330 853 840 793 23 13
Mich. - 5 33 15 38 58 U 228 284 300 30 37
Wis. U 315 12 21 32 43 129 160 85 69 13 13
W.N. CENTRAL 112 156 40 22 200 143 287 614 358 459 428 303
Minn. 39 80 17 4 25 24 51 34 80 110 21 24
Iowa 19 12 2 3 41 26 16 39 50 48 196 107
Mo. 22 41 9 6 84 53 186 504 155 178 17 26
N. Dak. - - 1 1 3 1 - - 6 3 56 24
S. Dak. - - - 2 9 5 - - 15 20 105 81
Nebr. 3 4 3 3 17 14 12 11 13 20 5 5
Kans. 29 19 8 3 21 20 22 26 39 80 28 36
S. ATLANTIC 544 548 239 193 509 383 2,891 3,187 2,704 2,865 2,163 1,665
Del. 78 37 3 1 2 6 33 14 20 46 61 79
Md. 320 363 65 55 64 33 493 364 234 311 489 332
D.C. 3 2 7 15 10 4 113 87 108 85 9 11
Va. 40 47 37 45 47 53 320 487 201 202 469 339
W. Va. 11 22 4 3 11 8 3 9 47 57 78 95
N.C. 60 48 25 15 65 67 814 886 386 335 561 379
S.C. 5 16 10 1 47 49 298 456 272 247 72 105
Ga. 1 10 23 27 117 76 514 591 479 554 233 223
Fla. 26 3 65 31 146 87 303 293 957 1,028 191 102
E.S. CENTRAL 55 59 25 21 150 166 1,956 2,639 996 1,106 171 235
Ky. 14 13 3 2 25 37 113 143 181 233 36 24
Tenn. 18 25 12 8 16 64 631 685 297 339 65 78
Ala. 6 7 3 8 62 34 441 515 332 323 67 124
Miss. 17 14 7 3 47 31 771 1,296 186 211 3 9
W.S. CENTRAL 91 91 38 39 288 279 1,168 2,540 1,759 2,105 293 534
Ark. 21 7 - 2 33 27 121 389 142 181 21 41
La. 2 5 6 5 47 41 425 788 59 208 13 24
Okla. 17 38 - 1 30 30 145 151 134 146 25 28
Tex. 51 41 32 31 178 181 477 1,212 1,424 1,570 U 441
MOUNTAIN 6 7 51 49 142 164 109 175 469 500 128 151
Mont. - - 7 3 4 2 - 4 14 10 20 41
Idaho - - - 1 21 8 4 - 7 12 - 3
Wyo. 2 3 7 - 3 7 2 - 6 3 25 23
Colo. - - 21 22 31 42 23 96 55 59 41 9
N. Mex. 1 1 2 5 22 30 1 6 63 64 6 6
Ariz. - - 6 7 35 47 66 35 186 234 28 43
Utah 1 1 4 6 14 14 2 4 39 31 3 15
Nev. 2 2 4 5 12 14 11 30 99 87 5 11
PACIFIC 75 91 285 219 517 467 389 487 3,522 3,644 271 333
Wash. 13 10 20 18 81 75 5 12 207 209 6 13
Oreg. 12 15 18 14 90 83 11 19 81 101 1 2
Calif. 49 66 237 175 335 295 372 455 3,049 3,130 256 311
Alaska - - 3 2 7 10 - 1 50 60 8 7
Hawaii 1 - 7 10 4 4 1 - 135 144 - -
Guam - - - 1 1 2 3 8 35 85 - -
P.R. - - - 1 4 22 106 221 63 162 37 35
V.I. - - - 2 - - - - - - - -
Amer. Samoa - - - - - - - - - 4 - -
C.N.M.I. - - - 1 - - 1 9 - 31 - -
-----------------------------------------------------------------------------------------------------------------------------------------------------
N: Not notifiable U: Unavailable -: no reported cases
=======================================================================================================================================================
Return to top. Table_III Note: To print large tables and graphs users may have to change their printer settings to landscape and use a small font size.
TABLE III. (page 1) Provisional cases of selected notifiable diseases preventable by vaccination, United
States, weeks ending October 5, 1996, and October 7, 1995 (40th Week)
Hepatitis (Viral), by type Measles (Rubeola)
H. influenzae, --------------------------------------- -------------------------------------
invasive A B Indigenous Imported**
---------------- ----------------- ----------------- --------------- ---------------
Reporting Area Cum. Cum. Cum. Cum. Cum. Cum. Cum. Cum.
1996* 1995 1996 1995 1996 1995 1996 1996 1996 1996
------------------------------------------------------------------------------------------------------------------------------
UNITED STATES 823 875 21,028 22,690 7,413 7,589 4 401 1 44
NEW ENGLAND 23 33 282 230 156 183 - 11 - 4
Maine - 3 16 23 2 7 - - - -
N.H. 8 9 12 10 13 18 - - - -
Vt. 1 2 6 5 10 5 - 1 - 1
Mass. 12 10 152 98 53 70 - 9 - 3
R.I. 2 3 15 26 9 8 - - - -
Conn. - 6 81 68 69 75 - 1 - -
MID. ATLANTIC 144 129 1,430 1,382 1,163 1,073 - 23 - 5
Upstate N.Y. 42 35 332 346 264 291 - - - -
N.Y. City 30 32 461 659 480 329 - 9 - 3
N.J. 46 16 263 198 199 289 - 3 - -
Pa. 26 46 374 179 220 164 - 11 - 2
E.N. CENTRAL 133 148 1,737 2,571 763 867 - 5 - 7
Ohio 79 74 616 1,450 101 87 - 2 - 3
Ind. 10 19 255 144 128 177 - - - -
Ill. 32 37 391 522 183 226 - 2 - 1
Mich. 7 16 339 291 298 317 - - - 3
Wis. 5 2 136 164 53 60 - 1 - -
W.N. CENTRAL 42 67 1,875 1,509 356 487 - 20 - 2
Minn. 25 38 106 146 41 44 - 16 - 2
Iowa 6 3 295 65 79 39 - - - -
Mo. 7 19 878 1,079 170 335 - 3 - -
N. Dak. - - 100 22 2 4 - - - -
S. Dak. 1 1 41 49 5 2 - - - -
Nebr. 1 3 173 38 33 25 - - - -
Kans. 2 3 282 110 26 38 - 1 - -
S. ATLANTIC 174 172 1,063 860 1,157 968 - 6 - 9
Del. 2 - 15 9 7 7 - 1 - -
Md. 51 56 177 168 237 200 - 2 - 2
D.C. 5 - 30 21 28 15 - - - -
Va. 8 23 134 161 111 91 - - - 3
W. Va. 7 7 13 19 21 41 - - - -
N.C. 22 25 130 89 265 224 - 3 - 1
S.C. 4 2 44 40 71 39 - - - -
Ga. 56 54 123 51 30 62 - - - 2
Fla. 19 5 397 302 387 289 - - - 1
E.S. CENTRAL 22 9 1,045 1,523 641 677 - 2 - -
Ky. 4 3 36 41 52 60 - - - -
Tenn. 9 - 688 1,263 364 532 - 2 - -
Ala. 8 5 147 69 50 85 - - - -
Miss. 1 1 174 150 175 U - - - -
W.S. CENTRAL 32 54 4,415 3,331 981 1,048 - 26 - 2
Ark. - 5 390 438 61 51 - - - -
La. 3 1 130 100 100 155 - - - -
Okla. 26 20 1,836 835 59 134 - - - -
Tex. 3 28 2,059 1,958 761 708 - 26 - 2
MOUNTAIN 80 95 3,396 3,198 878 651 - 152 - 5
Mont. - - 95 102 12 19 - - - -
Idaho 1 3 173 254 75 74 - 1 - -
Wyo. 35 5 28 89 36 18 - 1 - -
Colo. 11 14 363 410 113 95 - 4 - 3
N. Mex. 9 12 310 678 305 249 - 16 - -
Ariz. 9 24 1,341 889 199 97 - 8 - -
Utah 7 9 760 570 74 53 U 117 U 2
Nev. 8 28 326 206 64 46 - 5 - -
PACIFIC 173 168 5,785 8,086 1,318 1,635 4 156 1 10
Wash. 2 8 387 661 74 145 - 51 - -
Oreg. 22 22 676 2,142 58 97 - 4 - -
Calif. 145 133 4,630 5,104 1,160 1,369 2 36 - 5
Alaska 2 1 36 40 14 11 - 63 - -
Hawaii 2 4 56 139 12 13 2 2 1 5
Guam - - 2 7 - 4 U - U -
P.R. 1 3 89 80 279 488 - 7 - -
V.I. - - - 6 - 14 U - U -
Amer. Samoa - - - 6 - - U - U -
C.N.M.I. 10 11 1 24 5 22 U - U -
------------------------------------------------------------------------------------------------------------------------------
N: Not notifiable U: Unavailable -: no reported cases
* Of 190 cases reported among children aged <5 years, serotype was reported for 43 and of those, 13 were type b.
** For imported measles, cases include only those resulting from importation from other countries.
============================================================================================================================================
TABLE III. (page 2) Provisional cases of selected notifiable diseases preventable by vaccination, United
States, weeks ending October 5, 1996, and October 7, 1995 (40th Week)
Measles (Rubeola), cont'd.
--------------------------
Total Mumps Pertussis Rubella
-------------------------- -------------------------- --------------------------- ---------------------------
Reporting Area Cum. Cum. Cum. Cum. Cum. Cum. Cum. Cum.
1996 1995 1996 1996 1995 1996 1996 1995 1996 1996 1995
------------------------------------------------------------------------------------------------------------------------------------------
UNITED STATES 445 275 9 491 651 129 3,859 3,298 1 200 106
NEW ENGLAND 15 9 - 1 11 37 812 460 - 26 44
Maine - - - - 4 - 20 28 - - -
N.H. - - - - 1 - 76 40 - - 1
Vt. 2 - - - - 5 80 62 - 2 -
Mass. 12 2 - 1 2 27 579 305 - 20 7
R.I. - 5 - - 1 5 30 2 - - -
Conn. 1 2 - - 3 - 27 23 - 4 36
MID. ATLANTIC 28 12 1 65 99 15 328 273 - 10 13
Upstate N.Y. - 1 1 22 24 15 193 124 - 4 3
N.Y. City 12 5 - 14 15 - 25 42 - 4 8
N.J. 3 6 - 2 16 - 16 17 - 2 2
Pa. 13 - - 27 44 - 94 90 - - -
E.N. CENTRAL 12 14 - 86 114 7 407 409 - 3 3
Ohio 5 1 - 39 36 - 192 114 - - -
Ind. - - - 7 8 3 46 42 - - -
Ill. 3 2 - 19 32 2 130 86 - 1 -
Mich. 3 5 - 20 38 2 34 61 - 2 3
Wis. 1 6 - 1 - - 5 106 - - -
W.N. CENTRAL 22 2 1 14 38 4 260 225 - 1 -
Minn. 18 - - 5 2 - 197 115 - - -
Iowa - - - 1 9 2 15 7 - 1 -
Mo. 3 1 1 5 22 2 32 53 - - -
N. Dak. - - - 2 1 - 1 8 - - -
S. Dak. - - - - - - 4 11 - - -
Nebr. - - - - 4 - 7 10 - - -
Kans. 1 1 - 1 - - 4 21 - - -
S. ATLANTIC 15 11 2 85 94 26 464 275 - 91 9
Del. 1 - - - - - 12 10 - - -
Md. 4 1 2 24 28 3 166 33 - - 1
D.C. - - - - - 1 1 5 - 1 -
Va. 3 - - 12 20 16 71 15 - 2 -
W. Va. - - - - - - 2 - - - -
N.C. 4 - - 19 16 - 79 110 - 77 1
S.C. - - - 5 9 2 32 22 - 1 -
Ga. 2 2 - 3 6 - 17 19 - - -
Fla. 1 8 - 22 15 4 84 61 - 10 7
E.S. CENTRAL 2 - - 21 9 2 76 262 - 2 1
Ky. - - - - - - 29 20 - - -
Tenn. 2 - - 3 2 - 20 205 - - 1
Ala. - - - 3 4 - 18 35 - 2 -
Miss. - - - 15 3 2 9 2 N N N
W.S. CENTRAL 28 29 - 28 45 2 92 251 - 3 7
Ark. - 2 - 2 7 - 10 33 - - -
La. - 18 - 13 10 - 8 17 - 1 -
Okla. - - - - - - 8 28 - - -
Tex. 28 9 - 13 28 2 66 173 - 2 7
MOUNTAIN 157 68 - 21 28 13 339 496 1 7 4
Mont. - - - - 1 1 27 3 - - -
Idaho 1 - - - 3 - 102 89 1 3 -
Wyo. 1 - - - - 1 5 1 - - -
Colo. 7 26 - 3 2 6 90 85 - 2 -
N. Mex. 16 31 N N N 1 47 89 - - -
Ariz. 8 10 - 1 2 4 27 153 - 1 3
Utah 119 - U 2 11 U 14 19 U - 1
Nev. 5 1 - 15 9 - 27 57 - 1 -
PACIFIC 166 130 5 170 213 23 1,081 647 - 57 25
Wash. 51 19 - 18 10 - 463 216 - 2 1
Oreg. 4 1 - - - - 31 42 - 1 -
Calif. 41 108 4 124 183 23 557 342 - 51 19
Alaska 63 - - 2 12 - 3 - - - -
Hawaii 7 2 1 26 8 - 27 47 - 3 5
Guam - - U 5 3 U 1 2 U - 1
P.R. 7 3 - 1 2 - 1 1 - - -
V.I. - - U - 3 U - - U - -
Amer. Samoa - - U - - U - - U - -
C.N.M.I. - - U - 1 U - - U - -
------------------------------------------------------------------------------------------------------------------------------------------
N: Not notifiable U: Unavailable -: no reported cases
============================================================================================================================================
Return to top. Table_IV Note: To print large tables and graphs users may have to change their printer settings to landscape and use a small font size.
TABLE IV. Deaths in 121 U.S. cities* week ending
October 5, 1996 (40th Week)
===================================================================================================================================
All Causes, By Age (Years)
------------------------------------------------------------------------ P&I**
Reporting Area All Ages >=65 45-64 25-44 1-24 <1 Total
---------------------------------------------------------------------------------------------------------------
NEW ENGLAND 536 394 78 36 18 10 28
Boston, Mass. 144 102 17 10 9 6 3
Bridgeport, Conn. 45 28 10 5 2 - 6
Cambridge, Mass. 17 11 4 1 - 1 1
Fall River, Mass. 21 16 3 2 - - 3
Hartford, Conn. U U U U U U U
Lowell, Mass. 25 17 4 3 1 - 1
Lynn, Mass. 13 10 3 - - - -
New Bedford, Mass. 31 28 1 1 - 1 1
New Haven, Conn. 39 24 13 - 2 - 2
Providence, R.I. 74 57 11 5 1 - -
Somerville, Mass. 2 2 - - - - -
Springfield, Mass. 44 35 6 2 1 - 6
Waterbury, Conn. 23 20 2 - - 1 1
Worcester, Mass. 58 44 4 7 2 1 4
MID. ATLANTIC 2,344 1,569 470 212 39 54 110
Albany, N.Y. 45 36 6 3 - - 3
Allentown, Pa. U U U U U U U
Buffalo, N.Y. 77 51 18 6 - 2 8
Camden, N.J. 29 18 4 4 2 1 2
Elizabeth, N.J. 11 7 3 1 - - -
Erie, Pa.*** 40 27 10 - 2 1 2
Jersey City, N.J. 49 34 7 5 2 1 3
New York City, N.Y. 1,187 781 238 129 14 25 33
Newark, N.J. 61 27 16 12 - 6 3
Paterson, N.J. 21 8 10 2 - 1 -
Philadelphia, Pa. 404 253 91 36 12 12 24
Pittsburgh, Pa.*** 50 37 10 1 1 1 6
Reading, Pa. 9 4 3 - 2 - -
Rochester, N.Y. 147 115 21 6 1 4 13
Schenectady, N.Y. 28 24 3 - 1 - 1
Scranton, Pa.*** 38 32 5 1 - - 1
Syracuse, N.Y. 95 76 14 4 1 - 7
Trenton, N.J. 14 10 3 1 - - 1
Utica, N.Y. 19 14 5 - - - -
Yonkers, N.Y. 20 15 3 1 1 - 3
E.N. CENTRAL 2,055 1,356 397 172 67 63 104
Akron, Ohio 49 36 10 2 - 1 -
Canton, Ohio 37 26 6 3 1 1 4
Chicago, Ill. 399 221 86 69 15 8 35
Cincinnati, Ohio 88 63 18 4 2 1 6
Cleveland, Ohio 128 75 34 8 2 9 -
Columbus, Ohio 188 112 47 13 8 8 12
Dayton, Ohio 104 73 19 4 2 6 3
Detroit, Mich. 217 124 40 25 17 11 5
Evansville, Ind. 40 34 3 1 1 1 -
Fort Wayne, Ind. 48 34 10 4 - - 2
Gary, Ind. U U U U U U U
Grand Rapids, Mich. 65 50 9 3 1 2 5
Indianapolis, Ind. 197 140 33 11 4 9 11
Madison, Wis. 74 54 14 3 2 1 7
Milwaukee, Wis. 128 91 20 13 2 2 5
Peoria, Ill. 40 29 6 2 2 1 2
Rockford, Ill. 41 32 9 - - - 3
South Bend, Ind. 41 31 6 3 - 1 2
Toledo, Ohio 98 75 14 4 4 1 1
Youngstown, Ohio 73 56 13 - 4 - 1
W.N. CENTRAL 719 513 121 49 16 16 41
Des Moines, Iowa 26 18 4 2 1 1 3
Duluth, Minn. 28 20 6 2 - - -
Kansas City, Kans. 47 31 12 3 1 - 1
Kansas City, Mo. 72 50 12 2 - 4 2
Lincoln, Nebr. 51 41 5 3 1 1 1
Minneapolis, Minn. 169 135 20 10 2 2 12
Omaha, Nebr. 87 65 11 5 1 5 7
St. Louis, Mo. 91 58 17 10 5 1 6
St. Paul, Minn. 60 40 16 3 1 - 5
Wichita, Kans. 88 55 18 9 4 2 4
S. ATLANTIC 1,008 627 198 129 30 24 49
Atlanta, Ga. 127 75 27 19 3 3 3
Baltimore, Md. 142 81 31 20 6 4 8
Charlotte, N.C. 66 36 19 8 2 1 6
Jacksonville, Fla. 118 74 23 14 2 5 3
Miami, Fla. 105 65 21 13 6 - 1
Norfolk, Va. 52 35 9 3 2 3 6
Richmond, Va. U U U U U U U
Savannah, Ga. 35 26 7 1 1 - 3
St. Petersburg, Fla. 39 31 - 6 1 1 3
Tampa, Fla. 166 114 27 17 2 6 12
Washington, D.C. 146 78 34 28 5 1 4
Wilmington, Del. 12 12 - - - - -
E.S. CENTRAL 729 495 145 63 11 12 41
Birmingham, Ala. 125 93 15 9 3 2 3
Chattanooga, Tenn. 41 24 13 4 - - 1
Knoxville, Tenn. 79 50 20 7 1 1 3
Lexington, Ky. 80 57 17 3 1 2 10
Memphis, Tenn. 186 131 36 15 3 1 12
Mobile, Ala. 43 32 6 5 - - 1
Montgomery, Ala. 50 28 15 4 3 - 1
Nashville, Tenn. 125 80 23 16 - 6 10
W.S. CENTRAL 1,370 862 284 155 41 28 74
Austin, Tex. 60 34 14 8 3 1 2
Baton Rouge, La. 12 10 2 - - - -
Corpus Christi, Tex. 73 47 13 7 4 2 3
Dallas, Tex. 203 108 52 30 10 3 4
El Paso, Tex. 50 33 8 7 1 1 1
Ft. Worth, Tex. U U U U U U U
Houston, Tex. 414 252 89 56 11 6 34
Little Rock, Ark. 75 53 15 4 - 3 3
New Orleans, La. 162 103 31 19 4 5 -
San Antonio, Tex. 173 117 33 16 3 4 15
Shreveport, La. 50 38 7 3 2 - 9
Tulsa, Okla. 98 67 20 5 3 3 3
MOUNTAIN 849 553 158 75 36 26 56
Albuquerque, N.M. 92 61 20 4 5 2 4
Colo. Springs, Colo. 53 42 9 1 1 - 4
Denver, Colo. 91 58 21 7 1 4 10
Las Vegas, Nev. 149 84 39 14 9 3 5
Ogden, Utah 27 18 5 1 3 - 5
Phoenix, Ariz. 165 102 31 16 6 9 16
Pueblo, Colo. 33 24 5 3 1 - 1
Salt Lake City, Utah 96 59 13 12 6 6 4
Tucson, Ariz. 143 105 15 17 4 2 7
PACIFIC 1,594 1,104 277 135 42 36 130
Berkeley, Calif. 19 14 3 2 - - -
Fresno, Calif. 112 73 18 11 4 6 14
Glendale, Calif. 20 14 5 1 - - 1
Honolulu, Hawaii U U U U U U U
Long Beach, Calif. 60 45 8 2 2 3 7
Los Angeles, Calif. 382 267 67 27 17 4 23
Pasadena, Calif. 40 22 12 4 1 1 3
Portland, Oreg. 134 99 18 11 2 4 6
Sacramento, Calif. 108 84 15 6 1 2 10
San Diego, Calif. 124 79 24 18 2 1 14
San Francisco, Calif. 133 89 20 20 1 3 22
San Jose, Calif. 144 96 31 11 4 2 12
Santa Cruz, Calif. 32 28 3 - 1 - 3
Seattle, Wash. 139 88 31 11 4 5 3
Spokane, Wash. 64 46 10 7 1 - 5
Tacoma, Wash. 83 60 12 4 2 5 7
TOTAL 11,204**** 7,473 2,128 1,026 300 269 633
---------------------------------------------------------------------------------------------------------------
U: Unavailable -: no reported cases
* Mortality data in this table are voluntarily reported from 121 cities in the United States, most of which have populations
of 100,000 or more. A death is reported by the place of its occurrence and by the week that the death certificate was
filed. Fetal deaths are not included.
** Pneumonia and influenza.
*** Because of changes in reporting methods in these 3 Pennsylvania cities, these numbers are partial counts for the current
week. Complete counts will be available in 4 to 6 weeks.
**** Total includes unknown ages.
===================================================================================================================================
Return to top. Disclaimer All MMWR HTML versions of articles are electronic conversions from ASCII text into HTML. This conversion may have resulted in character translation or format errors in the HTML version. Users should not rely on this HTML document, but are referred to the electronic PDF version and/or the original MMWR paper copy for the official text, figures, and tables. An original paper copy of this issue can be obtained from the Superintendent of Documents, U.S. Government Printing Office (GPO), Washington, DC 20402-9371; telephone: (202) 512-1800. Contact GPO for current prices. **Questions or messages regarding errors in formatting should be addressed to mmwrq@cdc.gov.Page converted: 09/19/98 |
|||||||||
This page last reviewed 5/2/01
|