 |
|
|
|
|
|
|
| ||||||||||
|
|
|
|
|
|
|
||||
| ||||||||||
|
|
|
|
|
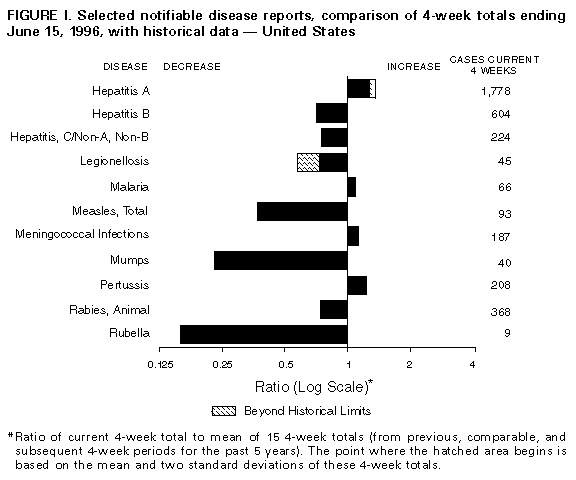
Persons using assistive technology might not be able to fully access information in this file. For assistance, please send e-mail to: mmwrq@cdc.gov. Type 508 Accommodation and the title of the report in the subject line of e-mail. Notifiable Diseases/Deaths in Selected Cities Weekly InformationFigure_I Selected notifiable disease reports, comparison of 4-week totals ending June 15, 1996, with historical data -- United States Table_I Summary -- cases of selected notifiable diseases, United States, cumulative, week ending June 15, 1996 (24th Week) Table_II Cases of selected notifiable diseases, United States, weeks ending June 15, 1996 and June 17, 1995 (24th Week) Table_III Cases of selected notifiable diseases preventable by vaccination, United States, weeks ending June 15, 1996 and June 17, 1995 (24th Week) Table_IV Deaths in 121 U.S. cities, week ending
June 15, 1996 (24th Week)
TABLE I. Summary -- cases of specified notifiable diseases, United States,
cumulative, week ending June 15, 1996 (24th Week)
===============================================================================
                                             Cum. 1996
------------------------------------------------------
Anthrax                                              -
Brucellosis                                         36
Cholera                                              2
Congenital rubella syndrome                          1
Cryptosporidiosis*                                 711
Diphtheria                                           1
Encephalitis:  California*                           5
               eastern equine*                       1
               St. Louis*                            -
               western equine*                       -
Hansen Disease                                      44
Hantavirus pulmonary syndrome*+                      -
HIV infection, pediatric*&                         122
Plague                                               -
Poliomyelitis, paralytic@                            -
Psittacosis                                         16
Rabies, human                                        -
Rocky Mountain spotted fever (RMSF)                133
Streptococcal toxic-shock syndrome*                 10
Syphilis, congenital**                               -
Tetanus                                              9
Toxic-shock syndrome                                64
Trichinosis                                         11
Typhoid fever                                      150
------------------------------------------------------
 * Not notifiable in all states
 + Updated weekly from reports to the Division of Viral and Rickettsial
   Diseases, National Center for Infectious Diseases (NCID).
 & Updated monthly to the Division of HIV/AIDS Prevention, National
   Center for HIV, STD, and TB Prevention (NCHSTP) (proposed), last update
   May 28, 1996.
 @ One suspected cases of polio with onset in 1996 has been reported to date.
** Updated quarterly from reports to the Division of STD Prevention,
   NCHSTP. First quarter 1996 is not yet available.
-: no reported cases
===============================================================================
Return to top. Table_II Note: To print large tables and graphs users may have to change their printer settings to landscape and use a small font size.
TABLE II. (page 1) Cases of selected notifiable diseases, United States, weeks ending
June 15, 1996, and June 17, 1995 (24th Week)
Escherichia
coli O157:H7
------------------- Hepatitis
AIDS* Chlamydia NETSS** PHLIS*** Gonorrhea C\NA,NB Legionellosis
----------------- --------- -------- -------- ------------------- ---------------- -----------------
Reporting Area Cum. Cum. Cum. Cum. Cum. Cum. Cum. Cum. Cum. Cum. Cum.
1996 1995 1996 1996 1996 1996 1995 1996 1995 1996 1995
------------------------------------------------------------------------------------------------------------------------------------------
UNITED STATES 28,480 32,078 133,551 483 208 125,444 177,102 1,645 1,821 324 535
NEW ENGLAND 1,123 1,696 8,058 44 17 3,453 2,291 54 56 18 10
Maine 16 26 - 3 - 21 34 - - 1 3
N.H. 31 47 344 1 2 68 52 3 8 - 1
Vt. 9 14 - 6 5 27 20 22 6 2 -
Mass. 550 792 3,088 22 10 1,003 1,361 26 41 9 5
R.I. 73 121 938 5 - 241 235 3 1 6 1
Conn. 444 696 3,688 7 - 2,093 589 - - N N
MID. ATLANTIC 7,891 8,351 18,121 51 23 13,821 20,826 168 178 64 71
Upstate N.Y. 1,000 978 N 33 12 2,697 4,167 143 88 17 22
N.Y. City 4,489 4,473 7,743 - - 4,200 8,358 1 1 - 1
N.J. 1,511 1,770 2,053 18 5 2,328 1,702 - 78 7 14
Pa. 891 1,130 8,325 N 6 4,596 6,599 24 11 40 34
E.N. CENTRAL 2,298 2,543 22,366 130 64 22,871 36,133 215 150 95 176
Ohio 521 539 9,865 40 19 7,264 11,333 7 5 42 80
Ind. 347 255 4,751 20 11 3,252 3,950 7 - 23 40
Ill. 974 1,101 - 49 16 7,722 9,315 28 48 2 18
Mich. 323 494 4,101 21 18 2,911 8,500 173 97 22 18
Wis. 133 154 3,649 N - 1,722 3,035 - - 6 20
W.N. CENTRAL 691 689 11,282 81 41 5,302 9,202 108 30 22 40
Minn. 126 149 - 23 18 U 1,410 - 2 1 -
Iowa 51 43 1,878 14 10 488 674 80 3 5 12
Mo. 327 278 5,913 14 - 3,547 5,311 18 10 5 12
N. Dak. 6 1 2 1 5 1 14 - 3 - 2
S. Dak. 7 7 672 3 - 95 89 - 1 2 -
Nebr. 49 62 762 7 2 153 455 2 8 7 11
Kans. 125 149 2,055 19 6 1,018 1,249 8 3 2 3
S. ATLANTIC 7,305 7,937 24,412 29 4 45,146 49,894 116 133 50 88
Del. 142 162 - - - 661 912 1 - - -
Md. 853 1,123 2,881 N 1 5,771 5,778 - 6 7 15
D.C. 452 507 N - - 2,011 2,173 - - 3 3
Va. 396 550 5,190 N 1 4,312 5,135 7 5 12 7
W. Va. 49 35 - N - 218 293 7 24 1 3
N.C. 355 405 - 7 2 8,628 11,190 21 27 3 17
S.C. 387 402 - 3 - 5,187 5,622 15 11 4 15
Ga. 1,096 1,093 5,822 7 - 10,118 9,305 - 15 1 11
Fla. 3,575 3,660 10,519 11 - 8,240 9,486 65 45 19 17
E.S. CENTRAL 953 982 13,631 17 13 14,272 18,044 296 568 25 24
Ky. 153 118 3,108 2 1 1,894 2,071 13 18 3 5
Tenn. 352 402 5,980 7 12 5,053 6,169 281 548 10 8
Ala. 278 261 3,878 4 - 6,056 7,513 2 2 1 3
Miss. 170 201 U 4 - 1,269 2,291 U - 11 8
W.S. CENTRAL 2,656 2,490 6,040 25 4 8,514 23,429 202 105 2 11
Ark. 121 108 - 6 2 1,333 2,345 2 2 - 4
La. 656 360 3,148 4 2 3,565 5,477 82 64 - 2
Okla. 96 130 2,892 2 - 1,788 2,247 60 24 2 3
Tex. 1,783 1,892 - 13 - 1,828 13,360 58 15 - 2
MOUNTAIN 811 1,047 4,454 41 18 3,279 4,187 288 224 20 60
Mont. 10 8 - 4 - 13 38 9 9 1 4
Idaho 19 24 720 11 4 43 59 76 30 - 1
Wyo. 2 7 310 - 2 13 23 90 94 2 4
Colo. 248 340 - 14 5 825 1,382 25 32 6 26
N. Mex. 45 81 - 2 - 402 471 34 30 1 4
Ariz. 240 298 2,354 N 7 1,711 1,483 36 14 7 5
Utah 90 58 254 8 - 49 99 11 7 1 3
Nev. 157 231 816 2 - 223 632 7 8 2 13
PACIFIC 4,752 6,343 25,187 65 24 8,786 13,096 198 377 28 55
Wash. 366 458 4,557 15 5 1,006 1,107 29 102 1 7
Oreg. 223 208 2,578 21 14 246 202 4 24 - -
Calif. 4,074 5,511 17,062 28 - 7,187 11,168 69 241 27 43
Alaska 11 45 432 1 - 193 331 2 1 - -
Hawaii 78 121 558 N 5 154 288 94 9 - 5
Guam 3 - 114 N - 26 58 1 3 - 1
P.R. 426 1,332 N 12 U 149 286 37 76 - -
V.I. 9 19 N - U - 21 - - - -
Amer. Samoa - - - - U - 8 - - - -
C.N.M.I. - - N - U 11 13 - - - -
------------------------------------------------------------------------------------------------------------------------------------------
N: Not notifiable U: Unavailable -: no reported cases C.N.M.I.: Commonwealth of North Mariana Islands
* Updated monthly to the Division of HIV/AIDS Prevention, National Center for HIV, STD, and TB Prevention (proposed), last update
May 28, 1996.
** National Electronic Telecommunications System for Surveillance.
*** Public Health Laboratory Information System.
=======================================================================================================================================================
TABLE II. (page 2) Cases of selected notifiable diseases, United States, weeks ending
June 15, 1996, and June 17, 1995 (24th Week)
Meningococcal Syphilis
Lyme Malaria Disease (Primary & Secondary) Tuberculosis Rabies, Animal
---------------- ---------------- ---------------- --------------------- ----------------- ----------------
Reporting Area Cum. Cum. Cum. Cum. Cum. Cum. Cum. Cum. Cum. Cum. Cum. Cum.
1996 1995 1996 1995 1996 1995 1996 1995 1996 1995 1996 1995
-----------------------------------------------------------------------------------------------------------------------------------------------------
UNITED STATES 1,772 2,501 470 467 1,743 1,650 4,982 7,348 7,424 8,040 2,460 3,404
NEW ENGLAND 259 292 16 19 65 77 73 94 174 192 284 784
Maine 3 3 3 1 10 6 - 2 4 - - -
N.H. 3 12 1 1 2 14 1 1 6 5 38 88
Vt. 1 4 2 - 3 6 - - - 2 81 107
Mass. 35 22 7 6 24 24 34 37 75 109 52 281
R.I. 39 50 3 2 - - 1 1 20 18 22 131
Conn. 178 201 - 9 26 27 37 53 69 58 91 177
MID. ATLANTIC 1,298 1,780 111 115 140 212 202 401 1,300 1,713 394 995
Upstate N.Y. 692 989 28 21 45 64 33 38 142 186 237 570
N.Y. City 159 167 50 57 22 26 65 177 703 925 - -
N.J. 86 216 28 26 37 54 55 87 310 309 67 175
Pa. 361 408 5 11 36 68 49 99 145 293 90 250
E.N. CENTRAL 20 92 42 67 221 250 712 1,250 827 695 21 19
Ohio 16 9 7 3 85 69 251 423 139 134 4 2
Ind. 4 7 7 6 37 36 113 142 91 67 1 2
Ill. - 6 8 41 47 70 234 463 511 467 1 3
Mich. - 1 13 9 28 44 41 130 39 U 8 11
Wis. U 69 7 8 24 31 73 92 47 27 7 1
W.N. CENTRAL 46 35 12 10 136 92 188 387 197 278 250 169
Minn. 3 - 3 3 15 16 27 26 38 66 14 11
Iowa 16 1 2 1 31 16 11 27 31 35 123 54
Mo. 7 16 5 4 60 35 141 318 83 102 13 18
N. Dak. - - - - 2 1 - - 2 1 25 17
S. Dak. - - - - 3 4 - - 13 10 59 44
Nebr. - 3 - 2 10 8 5 7 7 17 3 1
Kans. 20 15 2 - 15 12 4 9 23 47 13 24
S. ATLANTIC 72 200 108 93 381 273 1,807 1,956 1,248 1,288 1,186 1,014
Del. 4 23 2 1 2 3 17 7 20 23 37 53
Md. 31 126 22 23 34 21 276 195 127 194 289 208
D.C. 1 1 4 9 6 2 86 60 68 49 2 9
Va. 3 13 13 17 32 32 216 305 118 105 252 191
W. Va. 4 12 1 1 8 5 1 1 27 45 48 46
N.C. 17 14 10 7 45 45 502 535 192 175 302 200
S.C. 2 5 3 - 37 36 211 303 40 144 37 63
Ga. - 4 8 10 88 56 321 359 322 U 138 139
Fla. 10 2 45 25 129 73 177 191 334 553 81 105
E.S. CENTRAL 26 19 12 9 103 102 1,202 1,430 607 624 80 120
Ky. 8 3 2 - 19 26 65 96 115 137 20 9
Tenn. 7 9 5 4 10 32 467 392 179 207 30 48
Ala. 1 1 2 5 37 25 250 279 197 179 30 60
Miss. 10 6 3 - 37 19 420 663 116 101 - 3
W.S. CENTRAL 16 44 11 8 210 191 543 1,452 871 1,038 31 67
Ark. 7 2 - 1 27 21 140 218 39 90 9 22
La. - - 1 1 36 27 261 499 U 94 12 25
Okla. 2 19 - - 19 22 68 76 34 - 10 20
Tex. 7 23 10 6 128 121 74 659 798 854 - -
MOUNTAIN 2 2 29 28 107 127 57 114 248 261 53 57
Mont. - - 3 2 4 2 - 3 7 3 8 22
Idaho - - - 1 12 5 1 - 4 6 - -
Wyo. 2 1 2 - 3 5 1 - 3 1 14 17
Colo. - - 14 16 20 31 17 65 43 6 10 -
N. Mex. - - 1 3 20 26 - 4 39 40 1 3
Ariz. - - 3 3 29 42 35 19 106 143 15 13
Utah - - 4 2 11 8 - 4 10 10 2 1
Nev. - 1 2 1 8 8 3 19 36 52 3 1
PACIFIC 33 37 129 118 380 326 198 264 1,952 1,951 161 179
Wash. 1 2 8 11 54 54 3 7 114 122 - 3
Oreg. 7 3 11 7 71 59 5 6 45 23 - -
Calif. 24 32 104 92 251 206 190 250 1,689 1,690 153 169
Alaska - - 2 1 2 5 - 1 27 38 8 7
Hawaii 1 - 4 7 2 2 - - 77 78 - -
Guam - - - - 1 2 3 2 35 56 - -
P.R. - - - 1 3 13 71 154 58 86 25 29
V.I. - - - - - - - 1 - - - -
Amer. Samoa - - - - - - - - - 3 - -
C.N.M.I. - - - 1 - - 1 3 - 13 - -
-----------------------------------------------------------------------------------------------------------------------------------------------------
N: Not notifiable U: Unavailable -: no reported cases
=======================================================================================================================================================
Return to top. Table_III Note: To print large tables and graphs users may have to change their printer settings to landscape and use a small font size.
TABLE III. (page 1) Cases of selected notifiable diseases preventable by vaccination, United
States, weeks ending June 15, 1996, and June 17, 1995 (24th Week)
Hepatitis (Viral), by type Measles (Rubeola)
H. influenzae, --------------------------------------- -------------------------------------
invasive A B Indigenous Imported**
---------------- ----------------- ----------------- --------------- ---------------
Reporting Area Cum. Cum. Cum. Cum. Cum. Cum. Cum. Cum.
1996* 1995 1996 1995 1996 1995 1996 1996 1996 1996
------------------------------------------------------------------------------------------------------------------------------
UNITED STATES 587 612 12182 12,041 4,172 4,520 39 202 1 19
NEW ENGLAND 13 34 150 109 67 103 - 6 - 2
Maine 2 3 12 15 2 6 - - - -
N.H. 7 7 6 5 5 11 - - - -
Vt. - 1 3 3 3 2 - 1 - -
Mass. 4 7 76 44 24 33 - 4 - 2
R.I. - - 6 12 6 8 - - - -
Conn. - 16 47 30 27 43 - 1 - -
MID. ATLANTIC 89 73 700 782 602 636 8 12 1 5
Upstate N.Y. 27 20 184 174 162 156 - - - -
N.Y. City 14 18 302 392 287 216 - 4 - 3
N.J. 31 11 133 100 99 160 - - - -
Pa. 17 24 81 116 54 104 8 8 1 2
E.N. CENTRAL 83 109 1,028 1,583 439 523 1 6 - 3
Ohio 50 51 448 902 58 60 - 2 - -
Ind. 7 15 152 75 75 105 - - - -
Ill. 16 27 185 307 89 138 1 2 - 1
Mich. 5 14 172 182 190 187 - 1 - 2
Wis. 5 2 71 117 27 33 - 1 - -
W.N. CENTRAL 25 34 953 764 232 283 - 16 - 1
Minn. 10 14 50 86 19 25 - 13 - 1
Iowa 7 2 213 38 71 21 - - - -
Mo. 5 14 439 540 111 201 - 2 - -
N. Dak. - - 22 13 - 3 U - U -
S. Dak. 1 - 36 18 - 2 - - - -
Nebr. 1 2 106 21 8 15 - - - -
Kans. 1 2 87 48 23 16 - 1 - -
S. ATLANTIC 142 154 530 537 645 632 - 3 - 2
Del. 1 - 6 7 1 4 - 1 - -
Md. 32 46 99 91 143 120 - 2 - -
D.C. 5 - 15 7 15 10 - - - -
Va. 4 16 75 92 68 42 - - - 2
W. Va. 4 6 10 11 14 29 - - - -
N.C. 16 20 57 55 155 144 - - - -
S.C. 3 - 29 19 40 27 - - - -
Ga. 65 31 15 47 7 58 - - - -
Fla. 12 35 224 208 202 198 - - - -
E.S. CENTRAL 12 4 803 661 366 460 - - - -
Ky. 3 1 15 30 28 46 - - - -
Tenn. 3 - 562 546 229 359 - - - -
Ala. 5 3 98 47 25 55 - - - -
Miss. 1 - 128 38 84 - U - U -
W.S. CENTRAL 24 30 2,377 1,305 511 475 - - - 2
Ark. - 4 241 113 35 21 - - - -
La. 1 1 63 43 55 81 - - - -
Okla. 22 16 924 321 53 71 - - - -
Tex. 1 9 1,149 828 368 302 - - - 2
MOUNTAIN 64 61 1,929 1,863 514 377 16 37 - 1
Mont. - - 60 35 5 10 - - - -
Idaho 1 2 128 190 60 44 - 1 - -
Wyo. 32 3 18 64 15 10 - - - -
Colo. 6 9 180 229 62 60 - 5 - 1
N. Mex. 8 10 232 368 172 152 - - - -
Ariz. 9 17 770 515 124 48 - 8 - -
Utah 6 6 435 400 59 37 15 18 - -
Nev. 2 14 106 62 17 16 1 5 - -
PACIFIC 135 113 3,712 4,437 796 1,031 14 122 - 3
Wash. 2 5 253 316 50 76 - 45 - -
Oreg. 18 14 507 900 36 55 - 2 - -
Calif. 112 92 2,882 3,113 702 885 14 16 - 2
Alaska 1 - 25 16 3 6 - 58 - -
Hawaii 2 2 45 92 5 9 - 1 - 1
Guam - - 2 2 - 1 U - U -
P.R. 1 3 59 37 235 169 - 1 - -
V.I. - - - - - 2 U - U -
Amer. Samoa - - - 5 - - U - U -
C.N.M.I. 10 5 1 15 5 7 U - U -
------------------------------------------------------------------------------------------------------------------------------
* Of 135 cases reported among children aged <5 years, serotype was reported for 32 and of those, 8 were type b.
** For imported measles, cases include only those resulting from importation from other countries.
N: Not notifiable U: Unavailable -: no reported cases
============================================================================================================================================
TABLE III. (page 2) Cases of selected notifiable diseases preventable by vaccination, United
States, weeks ending June 15, 1996, and June 17, 1995 (24th Week)
Measles (Rubeola), cont'd.
--------------------------
Total Mumps Pertussis Rubella
-------------------------- -------------------------- --------------------------- ---------------------------
Reporting Area Cum. Cum. Cum. Cum. Cum. Cum. Cum. Cum.
1996 1995 1996 1996 1995 1996 1996 1995 1996 1996 1995
------------------------------------------------------------------------------------------------------------------------------------------
UNITED STATES 221 223 7 302 471 22 1,317 1,222 5 82 61
NEW ENGLAND 8 4 - - 8 4 207 187 - 11 14
Maine - - - - 4 - 8 18 - - 1
N.H. - - - - - - 20 14 - - 1
Vt. 1 - - - - - 7 9 - 2 -
Mass. 6 2 - - 2 4 169 136 - 7 2
R.I. - 2 - - - - - - - - -
Conn. 1 - - - 2 - 3 10 - 2 10
MID. ATLANTIC 17 4 2 45 70 2 102 113 - 4 8
Upstate N.Y. - - 1 12 16 1 57 60 - 3 1
N.Y. City 7 - - 11 8 - 14 15 - 1 6
N.J. - 4 - - 9 - - 6 - - 1
Pa. 10 - 1 22 37 1 31 32 - - -
E.N. CENTRAL 9 8 - 68 77 3 158 133 - 3 -
Ohio 2 1 - 27 23 1 73 45 - - -
Ind. - - - 5 5 2 14 15 - - -
Ill. 3 - - 16 23 - 51 28 - 1 -
Mich. 3 5 - 20 26 - 15 33 - 2 -
Wis. 1 2 - - - - 5 12 - - -
W.N. CENTRAL 17 1 - 4 28 - 62 76 - 1 -
Minn. 14 - - 1 2 - 42 27 - - -
Iowa - - - - 8 - 2 2 - 1 -
Mo. 2 1 - 1 15 - 12 19 - - -
N. Dak. - - U 2 - U - 6 U - -
S. Dak. - - - - - - 1 7 - - -
Nebr. - - - - 3 - 1 5 - - -
Kans. 1 - - - - - 4 10 - - -
S. ATLANTIC 5 5 3 43 68 5 151 107 2 14 16
Del. 1 - - - - - 9 5 - - -
Md. 2 - 1 13 23 1 54 16 - - -
D.C. - - - - - - - 2 - 1 -
Va. 2 - 1 4 13 1 19 8 2 2 -
W. Va. - - - - - - 2 - - - -
N.C. - - 1 9 16 - 29 50 - - -
S.C. - - - 5 7 3 9 11 - 1 -
Ga. - 2 - 2 1 - 7 - - - -
Fla. - 3 - 10 8 - 22 15 - 10 16
E.S. CENTRAL - - - 15 6 - 44 36 2 2 -
Ky. - - - - - - 23 7 - - -
Tenn. - - - 2 - - 14 4 - - -
Ala. - - - 3 4 - 4 25 2 2 -
Miss. - - U 10 2 U 3 - N N N
W.S. CENTRAL 2 15 - 14 33 3 30 69 - 2 2
Ark. - 2 - - 5 - 3 9 - - -
La. - 13 - 10 7 - 4 4 - 1 -
Okla. - - - - - - 4 9 - - -
Tex. 2 - - 4 21 3 19 47 - 1 2
MOUNTAIN 38 66 - 20 23 1 155 293 - 6 4
Mont. - - - - 1 - 4 3 - - -
Idaho 1 - - - 2 - 67 73 - 2 -
Wyo. - - - - - - - 1 - - -
Colo. 6 26 - 2 - 1 21 45 - 2 -
N. Mex. - 29 N N N - 29 39 - - -
Ariz. 8 10 - 1 2 - 11 111 - 1 3
Utah 18 - - 2 10 - 6 10 - - 1
Nev. 5 1 - 15 8 - 17 11 - 1 -
PACIFIC 125 120 2 93 158 4 408 208 1 39 17
Wash. 45 17 1 10 10 4 161 37 - 1 -
Oreg. 2 1 N N N - 27 15 - 1 1
Calif. 18 100 1 67 132 - 209 137 - 34 13
Alaska 58 - - 2 12 - 2 - - - -
Hawaii 2 2 - 14 4 - 9 19 1 3 3
Guam - - U 3 3 U - 2 U - 1
P.R. 1 9 - 1 1 - 1 8 - - -
V.I. - - U - 2 U - - U - -
Amer. Samoa - - U - - U - - U - -
C.N.M.I. - - U - - U - - U - -
------------------------------------------------------------------------------------------------------------------------------------------
N: Not notifiable U: Unavailable -: no reported cases
============================================================================================================================================
Return to top. Table_IV Note: To print large tables and graphs users may have to change their printer settings to landscape and use a small font size.
TABLE IV. Deaths in 121 U.S. cities* week ending
June 15, 1996 (24th Week)
===================================================================================================================================
All Causes, By Age (Years)
------------------------------------------------------------------------ P&I**
Reporting Area All Ages >=65 45-64 25-44 1-24 <1 Total
---------------------------------------------------------------------------------------------------------------
NEW ENGLAND 543 371 101 47 10 14 24
Boston, Mass. 153 94 32 18 3 6 1
Bridgeport, Conn. 35 19 9 5 2 - 3
Cambridge, Mass. 16 14 1 1 - - 1
Fall River, Mass. 20 16 2 2 - - -
Hartford, Conn. 51 33 9 6 3 - 1
Lowell, Mass. 21 13 5 3 - - 2
Lynn, Mass. 11 9 2 - - - -
New Bedford, Mass. 21 18 1 2 - - 1
New Haven, Conn. 41 24 13 1 - 3 1
Providence, R.I. 51 37 10 4 - - 4
Somerville, Mass. 2 2 - - - - -
Springfield, Mass. 32 21 6 1 - 4 -
Waterbury, Conn. 28 21 5 1 1 - 4
Worcester, Mass. 61 50 6 3 1 1 6
MID. ATLANTIC 2,432 1,611 465 259 44 53 118
Albany, N.Y. 59 43 10 3 - 3 2
Allentown, Pa. 28 22 5 1 - - -
Buffalo, N.Y. 91 60 19 7 3 2 2
Camden, N.J. 29 14 9 6 - - 3
Elizabeth, N.J. 23 19 - 3 - 1 -
Erie, Pa.*** 44 36 6 2 - - 3
Jersey City, N.J. 21 14 - 5 1 1 -
New York City, N.Y. 1,244 815 236 146 26 21 46
Newark, N.J. 49 17 16 11 2 3 7
Paterson, N.J. 26 13 8 5 - - -
Philadelphia, Pa. 400 245 89 41 11 14 23
Pittsburgh, Pa.*** 47 29 10 5 - 3 2
Reading, Pa. 17 11 5 1 - - 1
Rochester, N.Y. 125 100 13 11 - 1 12
Schenectady, N.Y. 17 15 2 - - - 1
Scranton, Pa.*** 30 21 7 2 - - 2
Syracuse, N.Y. 96 74 17 3 1 1 10
Trenton, N.J. 39 28 7 2 - 2 1
Utica, N.Y. 20 17 - 2 - 1 -
Yonkers, N.Y. 27 18 6 3 - - 3
E.N. CENTRAL 1,965 1,315 401 163 41 42 101
Akron, Ohio 55 40 10 2 2 1 -
Canton, Ohio 43 34 8 1 - - 3
Chicago, Ill. 313 176 75 45 10 4 20
Cincinnati, Ohio 158 113 29 9 4 3 11
Cleveland, Ohio 128 79 30 11 2 6 2
Columbus, Ohio 161 110 36 6 3 6 13
Dayton, Ohio 124 91 24 8 1 - 9
Detroit, Mich. 178 109 43 20 4 2 7
Evansville, Ind. 50 38 6 4 1 1 -
Fort Wayne, Ind. 58 39 6 9 3 1 2
Gary, Ind. 17 12 2 3 - - -
Grand Rapids, Mich. 58 46 7 4 - 1 4
Indianapolis, Ind. 201 128 41 18 4 10 9
Madison, Wis. U U U U U U U
Milwaukee, Wis. 103 74 24 3 2 - 5
Peoria, Ill. 47 35 7 4 - 1 3
Rockford, Ill. 40 28 7 2 2 1 5
South Bend, Ind. 48 38 5 5 - - 1
Toledo, Ohio 111 75 24 5 3 4 4
Youngstown, Ohio 72 50 17 4 - 1 3
W.N. CENTRAL 724 485 137 50 24 18 38
Des Moines, Iowa 82 54 16 7 - 5 8
Duluth, Minn. 34 26 5 1 2 - 2
Kansas City, Kans. 28 20 3 3 1 1 -
Kansas City, Mo. 94 57 21 2 3 1 3
Lincoln, Nebr. 21 15 2 1 3 - 1
Minneapolis, Minn. 142 94 27 14 3 4 9
Omaha, Nebr. 96 69 15 8 3 1 2
St. Louis, Mo. 121 79 22 10 5 5 9
St. Paul, Minn. 57 40 13 1 3 - 2
Wichita, Kans. 49 31 13 3 1 1 2
S. ATLANTIC 1,175 727 259 117 33 37 57
Atlanta, Ga. 211 128 46 24 5 8 6
Baltimore, Md. 237 140 63 25 7 2 26
Charlotte, N.C. 84 53 19 3 3 5 -
Jacksonville, Fla. 132 83 30 13 1 4 5
Miami, Fla. 110 62 23 15 7 3 -
Norfolk, Va. 41 24 8 5 - 4 2
Richmond, Va. 82 48 15 13 1 5 3
Savannah, Ga. 51 33 14 3 - 1 3
St. Petersburg, Fla. 47 36 4 6 - 1 1
Tampa, Fla. 166 111 37 5 9 4 11
Washington, D.C. U U U U U U U
Wilmington, Del. 14 9 - 5 - - -
E.S. CENTRAL 800 537 172 56 22 11 51
Birmingham, Ala. 111 66 28 12 2 1 3
Chattanooga, Tenn. 84 58 19 4 1 2 2
Knoxville, Tenn. 75 48 18 2 4 3 8
Lexington, Ky. 83 57 19 5 2 - 9
Memphis, Tenn. 188 130 36 15 7 - 16
Mobile, Ala. 54 44 5 3 - 2 1
Montgomery, Ala. 66 48 8 5 4 1 5
Nashville, Tenn. 139 86 39 10 2 2 7
W.S. CENTRAL 1,400 878 291 138 52 40 73
Austin, Tex. 81 57 15 4 3 2 7
Baton Rouge, La. 50 29 12 6 1 2 1
Corpus Christi, Tex. 53 40 8 2 2 1 3
Dallas, Tex. 196 117 34 26 9 10 2
El Paso, Tex. 41 30 9 1 1 - 4
Ft. Worth, Tex. 94 65 19 6 2 2 3
Houston, Tex. 324 189 79 39 9 8 24
Little Rock, Ark. 77 47 15 7 6 2 3
New Orleans, La. 98 55 19 15 5 4 -
San Antonio, Tex. 228 145 44 22 11 5 13
Shreveport, La. 55 35 14 4 - 2 7
Tulsa, Okla. 103 69 23 6 3 2 6
MOUNTAIN 795 511 153 81 24 23 51
Albuquerque, N.M. 92 56 22 12 1 1 2
Colo. Springs, Colo. 50 39 6 4 - 1 4
Denver, Colo. 93 58 17 11 3 4 9
Las Vegas, Nev. 141 88 36 11 1 2 9
Ogden, Utah 39 28 5 3 2 1 2
Phoenix, Ariz. 150 85 32 14 12 7 13
Pueblo, Colo. 21 18 2 1 - - -
Salt Lake City, Utah 88 56 11 12 3 6 4
Tucson, Ariz. 121 83 22 13 2 1 8
PACIFIC 1,406 959 231 154 42 20 107
Berkeley, Calif. 16 12 3 1 - - -
Fresno, Calif. 81 53 14 6 4 4 4
Glendale, Calif. U U U U U U U
Honolulu, Hawaii 75 55 8 7 4 1 6
Long Beach, Calif. 84 54 15 12 3 - 10
Los Angeles, Calif. U U U U U U U
Pasadena, Calif. 27 17 7 2 - 1 4
Portland, Oreg. 140 99 20 13 6 2 3
Sacramento, Calif. 212 140 36 27 6 3 16
San Diego, Calif. 131 86 23 16 4 2 15
San Francisco, Calif. 142 87 26 28 1 - 11
San Jose, Calif. 192 129 40 17 3 3 23
Santa Cruz, Calif. 36 25 8 2 1 - 5
Seattle, Wash. 131 92 16 13 7 3 5
Spokane, Wash. 54 39 8 6 1 - 4
Tacoma, Wash. 85 71 7 4 2 1 1
TOTAL 11,240**** 7,394 2,210 1,065 292 258 620
---------------------------------------------------------------------------------------------------------------
* Mortality data in this table are voluntarily reported from 121 cities in the United States, most of which have populations
of 100,000 or more. A death is reported by the place of its occurrence and by the week that the death certificate was
filed. Fetal deaths are not included.
** Pneumonia and influenza.
*** Because of changes in reporting methods in these 3 Pennsylvania cities, these numbers are partial counts for the current
week. Complete counts will be available in 4 to 6 weeks.
**** Total includes unknown ages.
U: Unavailable -: no reported cases
===================================================================================================================================
Return to top. Disclaimer All MMWR HTML versions of articles are electronic conversions from ASCII text into HTML. This conversion may have resulted in character translation or format errors in the HTML version. Users should not rely on this HTML document, but are referred to the electronic PDF version and/or the original MMWR paper copy for the official text, figures, and tables. An original paper copy of this issue can be obtained from the Superintendent of Documents, U.S. Government Printing Office (GPO), Washington, DC 20402-9371; telephone: (202) 512-1800. Contact GPO for current prices. **Questions or messages regarding errors in formatting should be addressed to mmwrq@cdc.gov.Page converted: 09/19/98 |
|||||||||
This page last reviewed 5/2/01
|